ILRS Network Performance Werner Gurtner Astronomical Institute University


- Slides: 28
ILRS Network Performance Werner Gurtner Astronomical Institute University of Bern ILRS Workshop 3 -7 October 2005 Eastbourne
Network Performance u Data quantity u Number of stations u Number of observations per station u Data quality u Precision, u Data biases, accuracy, reliability distribution u Geographic distribution of the stations u Temporal distribution of the data u Data latency
Data quantity u Number of passes / pass segments u Number of normal points u Satellites u low, Lageos, high u Performance u Is charts there any progress since 1998 (Start of ILRS)?
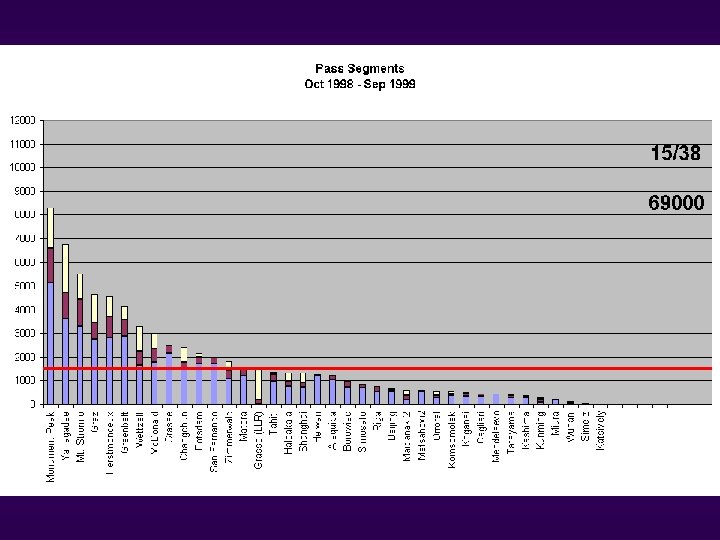
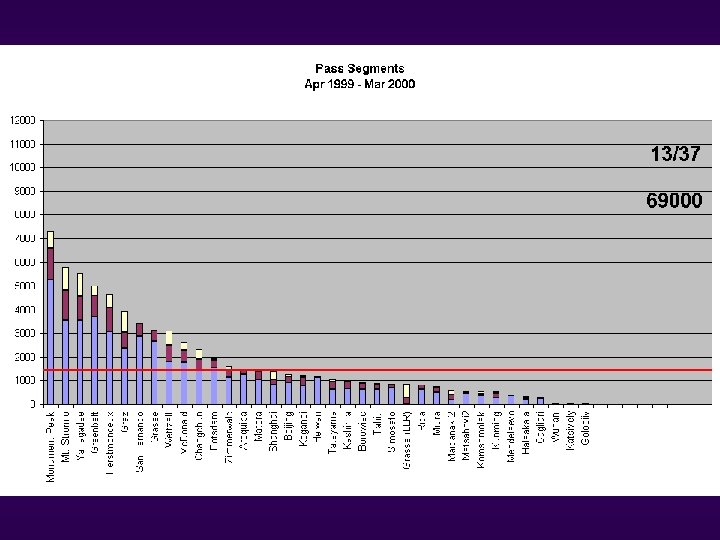
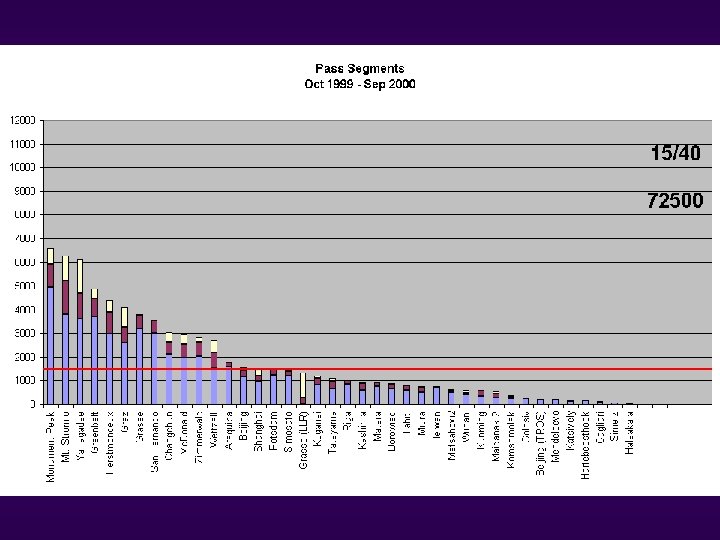
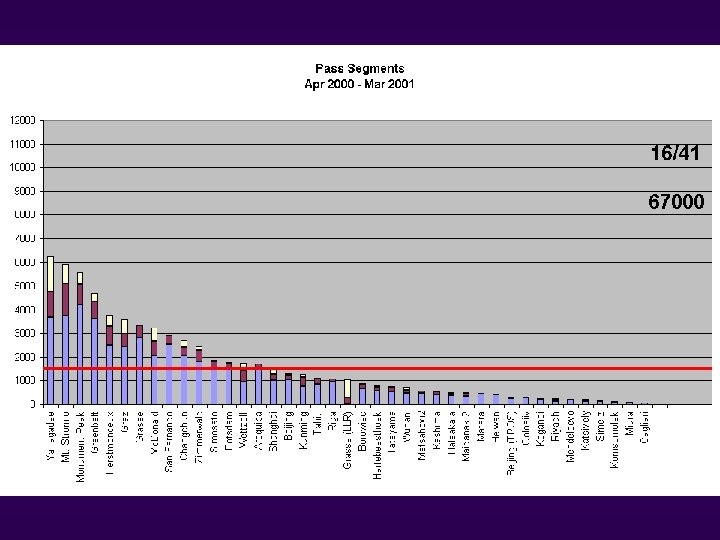
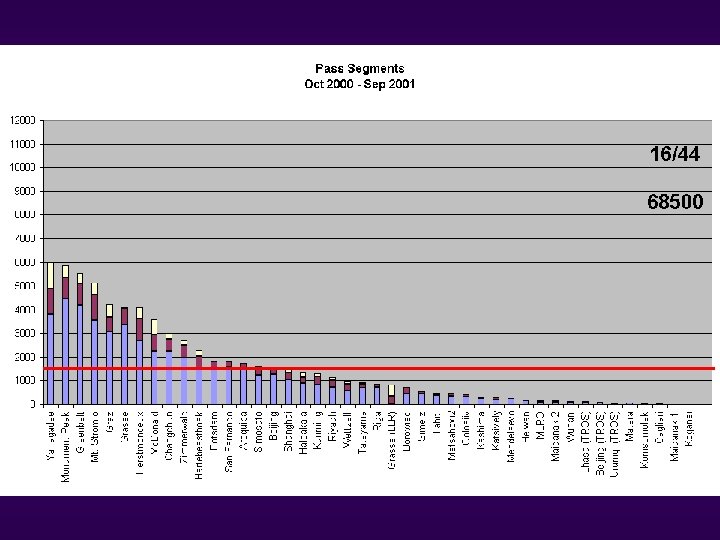
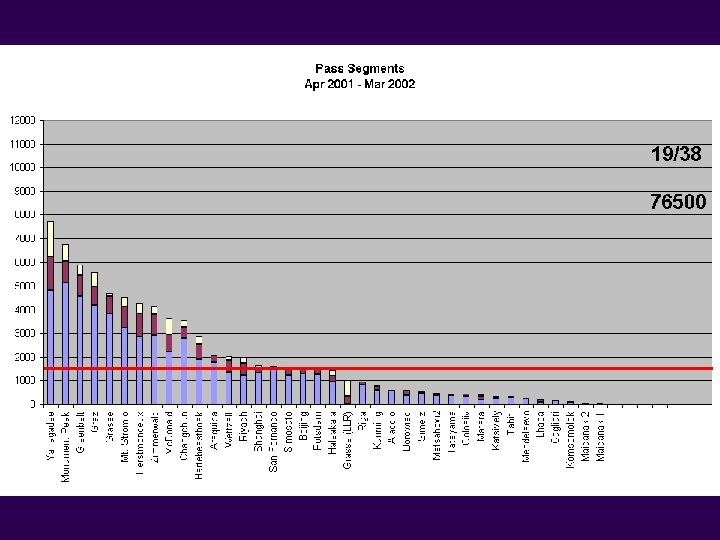
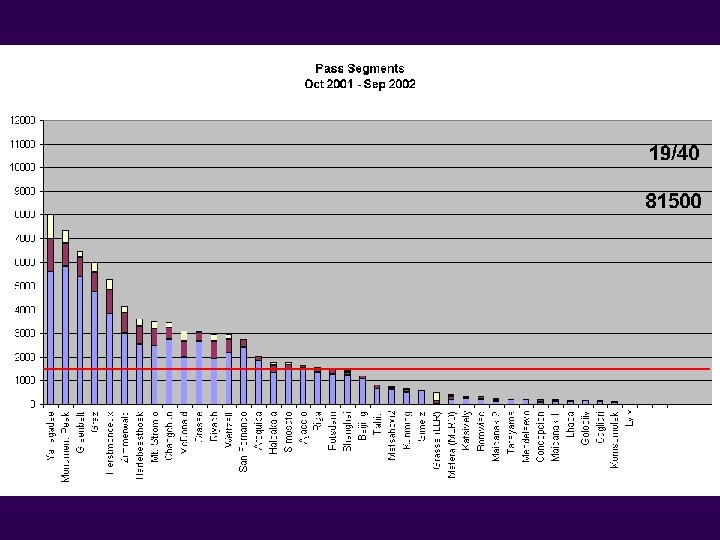
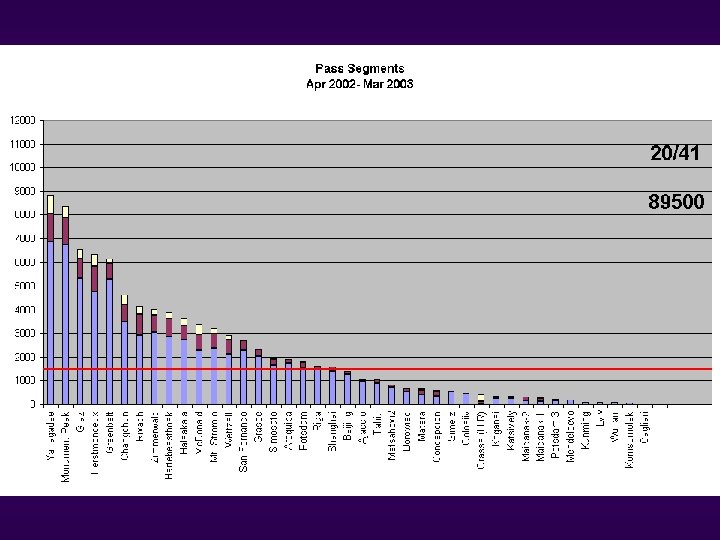
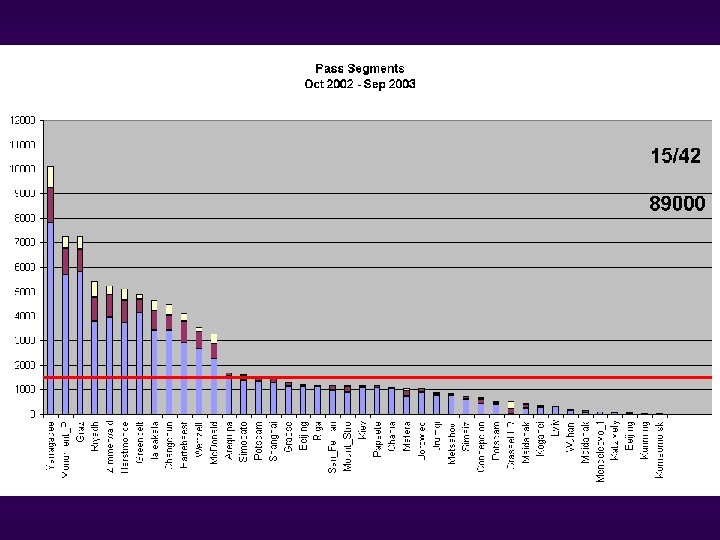
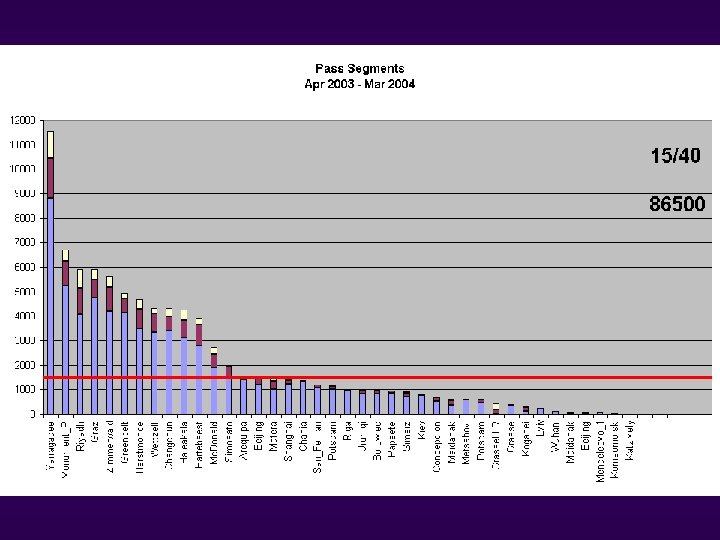
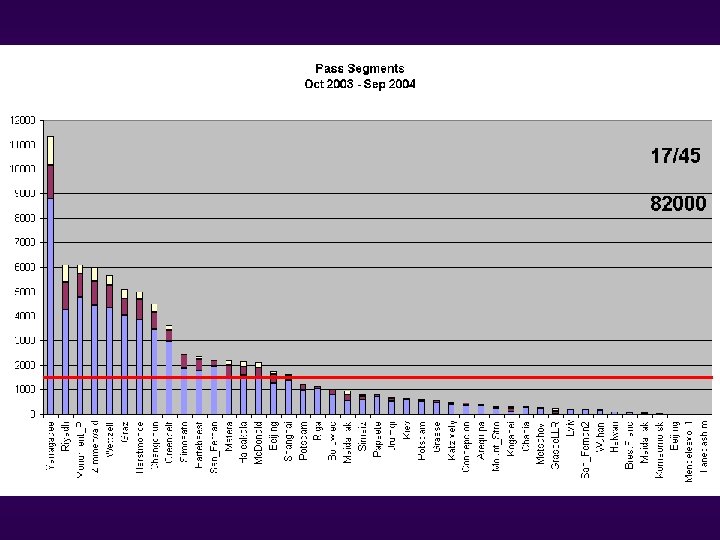
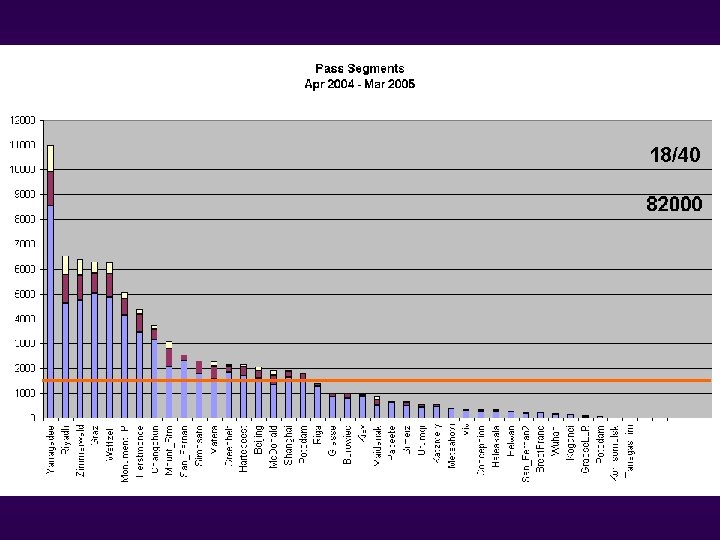
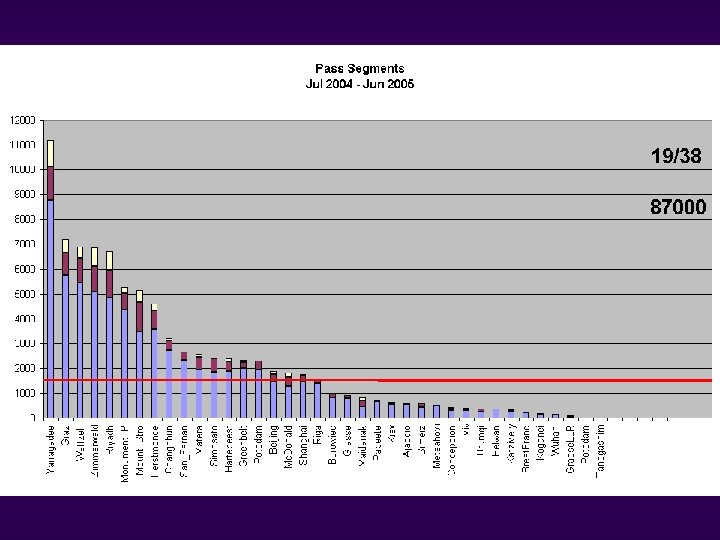
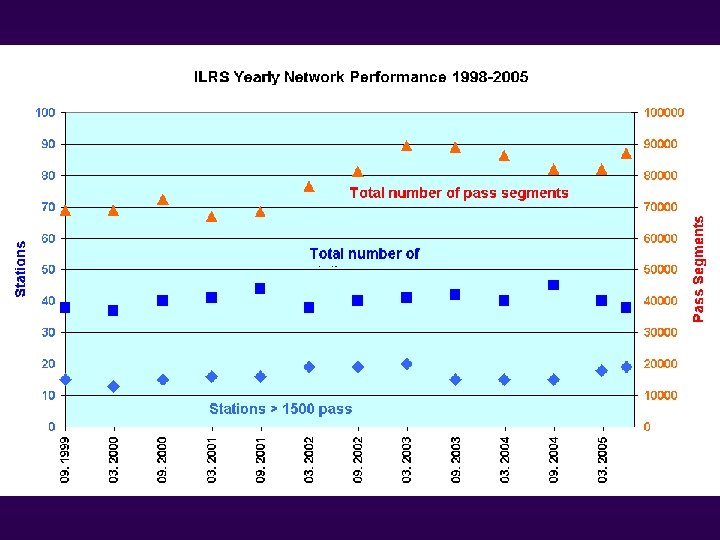
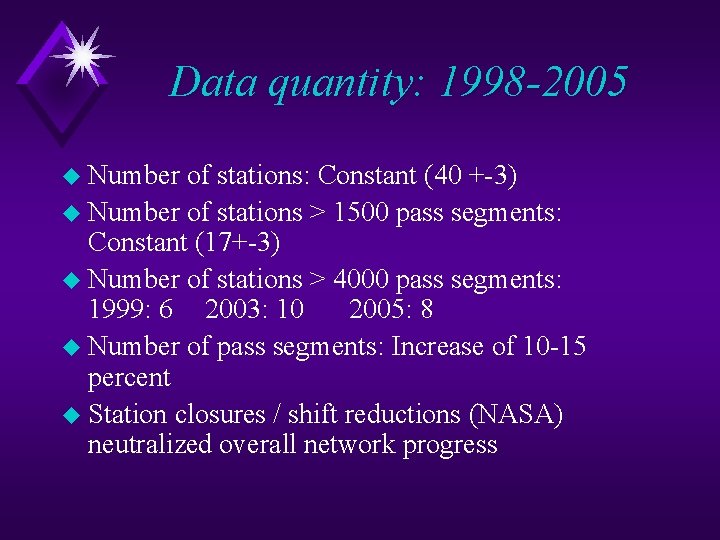
Data quantity: 1998 -2005 u Number of stations: Constant (40 +-3) u Number of stations > 1500 pass segments: Constant (17+-3) u Number of stations > 4000 pass segments: 1999: 6 2003: 10 2005: 8 u Number of pass segments: Increase of 10 -15 percent u Station closures / shift reductions (NASA) neutralized overall network progress
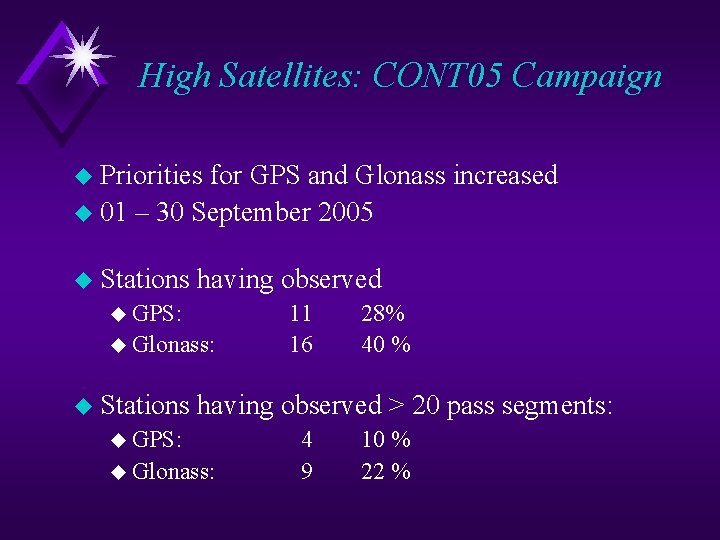
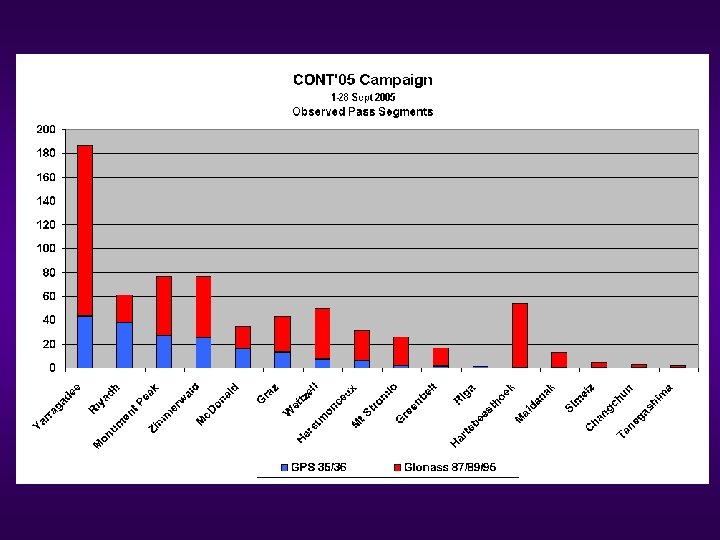
High Satellites: CONT 05 Campaign u Priorities for GPS and Glonass increased u 01 – 30 September 2005 u Stations having observed u GPS: u Glonass: u Stations 11 16 28% 40 % having observed > 20 pass segments: u GPS: u Glonass: 4 9 10 % 22 %
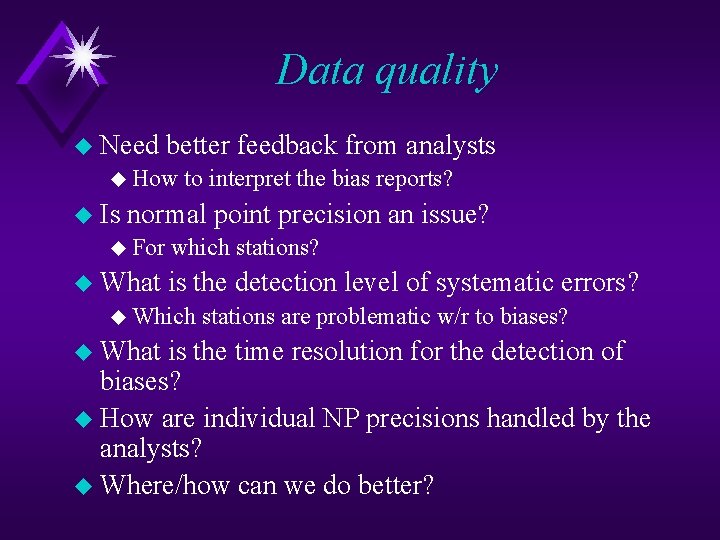
Data quality u Need better feedback from analysts u How u Is to interpret the bias reports? normal point precision an issue? u For u What which stations? is the detection level of systematic errors? u Which u What stations are problematic w/r to biases? is the time resolution for the detection of biases? u How are individual NP precisions handled by the analysts? u Where/how can we do better?
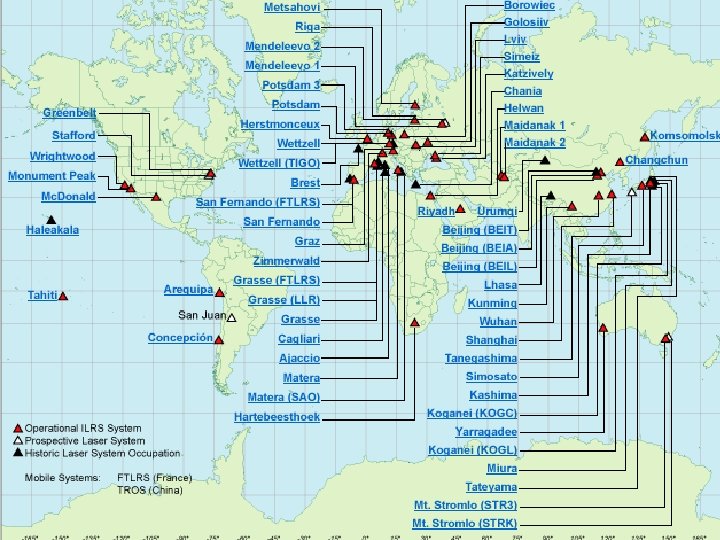
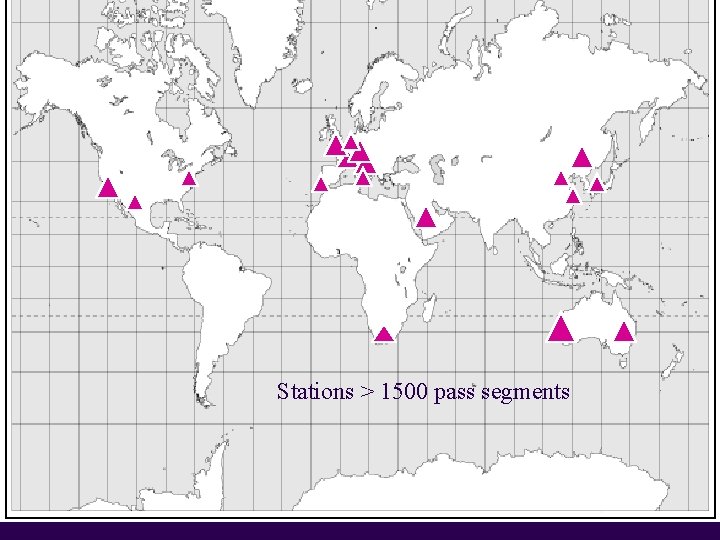
Data distribution u Station distribution: Well-known disbalance between north and south u Only three top stations in the southern hemisphere
Stations > 1500 pass segments
Data latency u Significantly u Important improved in the last years for low satellites u Update of time bias functions u More frequent prediction generation u Faster u Do feedback from analysts all stations submit their data within the hour?
Improving performance u Where is our biggest problem? u Data quantity? u Data quality? u Data distribution? u Where can we do significant improvements? u How can we increase the number of stations with acceptable data yield?
Automation: Where does it help us u Costs for operation u No observers u Less observers, less qualified observers u Observers can do something else, just occasional checks, interaction if needed u More reliable for some targets / tasks u More persistent, does not get tired u GPS, Glonass, Etalon, Lageos u Maintenance of constant return energy u Fine-tuning of pointing Larger data volume
Automation: Applications u Necessary for restricted tracking u Pass segment administration u Laser beam shutter control u Go-Nogo flags u Suitable u Time for bias import u Dynamic priorities u Post-manoeuvre prediction handling