Higher And Scarier Strengths Weaknesses and Uncertainties In
 Strengths, Weaknesses, and Uncertainties In Aircraft Markets Government of Ontario International")


 $10 $9")
 10 9 Value of Deliveries '17 $ Billions 8")


 25 20 15")
 4")


 10 8 6 4 2 V-22")


- Slides: 59
Higher (And Scarier) Strengths, Weaknesses, and Uncertainties In Aircraft Markets Government of Ontario International Trade Branch Presentation Toronto, Ontario Richard Aboulafia Vice President, Analysis Teal Group Corporation www. tealgroup. com August 2017
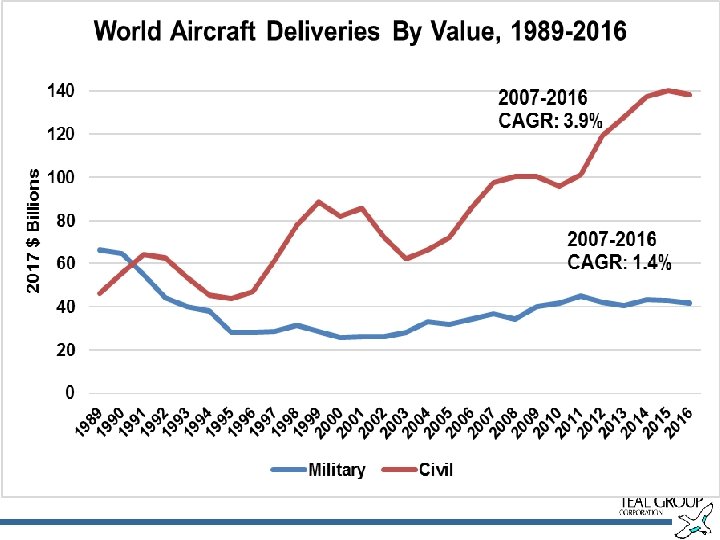
Aircraft Markets, Through Good And Bad Years
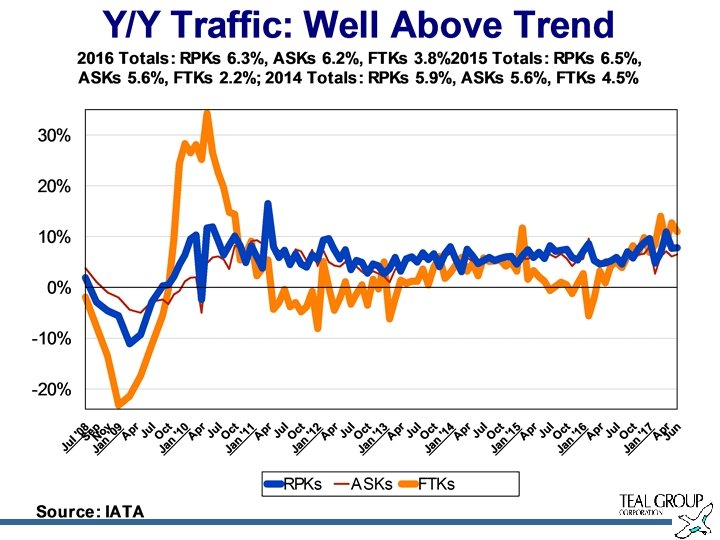
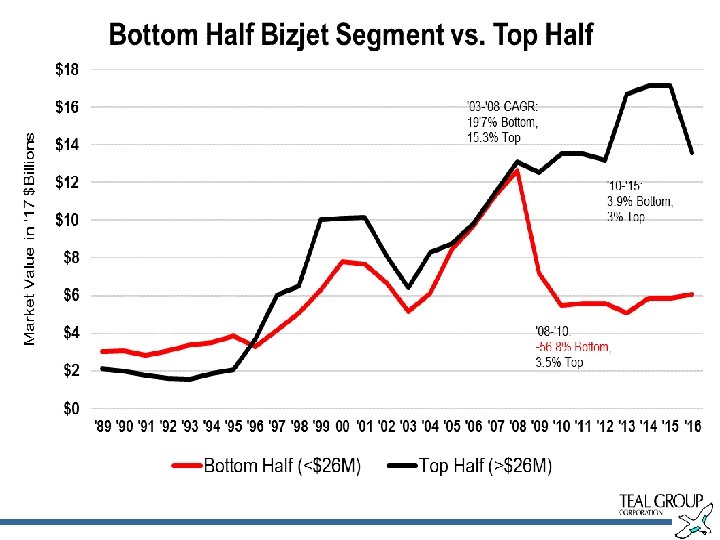
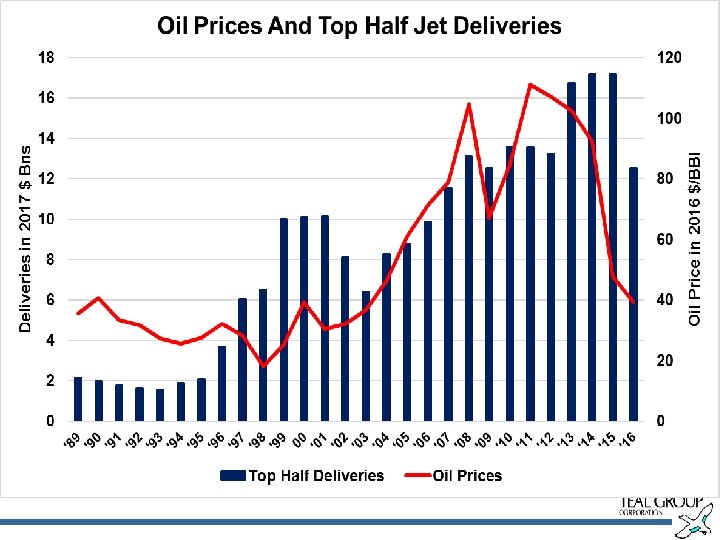
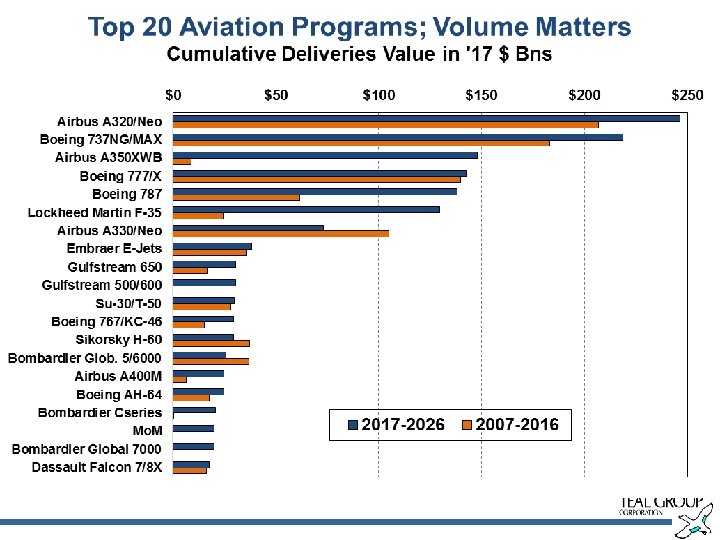
Headline News • Great traffic, people and things • Single Aisles Forever, Twin Aisles complicated • Boeing progress on 787 • 797 v A 322 • Primes V. Supply Chain • Robust defense…to a point • Stagnant bizjets.
The Civil Market
Global Economy Outpaced By Travel Demand Growth 4 500 140 000 4 000 120 000 3 500 100 000 80 000 GDP 2 500 2 000 60 000 1 500 40 000 1 000 20 000 500 RPMs (Bns) GDP (PPP, Bns) 16 20 14 20 12 20 10 20 8 20 0 06 20 04 20 02 20 00 20 98 19 96 19 94 19 92 19 90 19 88 19 86 19 84 19 82 0 19 80 0 19 RPMs 3 000
A 320 ceo A 320 neo A 322 neo B 737 NG B 737 MAX CSeries C 919/MS 21 24 20 23 20 22 20 21 20 20 20 19 20 18 20 17 20 16 20 15 20 14 20 13 20 12 20 11 20 10 20 09 20 08 20 07 20 06 20 05 20 04 20 03 20 02 20 Deliveries in 2017 $ Billions Single Aisle Deliveries: Driven By Change. . . And Hubris 70 60 50 40 30 20 10 0
Twin Aisles: Getting Mighty Crowded $60 Deliveries in 2017 $ Bns $50 $40 $30 $20 $10 $0 2002 2003 2004 2005 2006 2007 2008 2009 2010 2011 2012 2013 2014 2015 2016 2017 2018 2019 2020 2021 2022 2023 A 350 A 330 neo A 340 A 380 B 767 B 777 X B 787 B 747
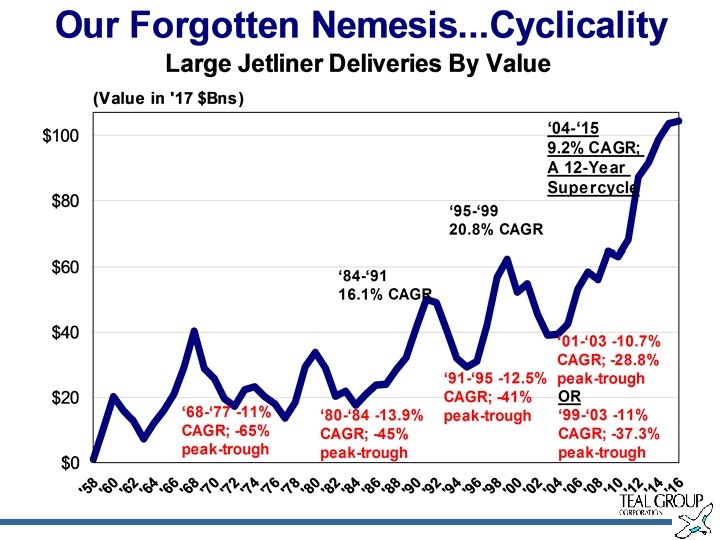
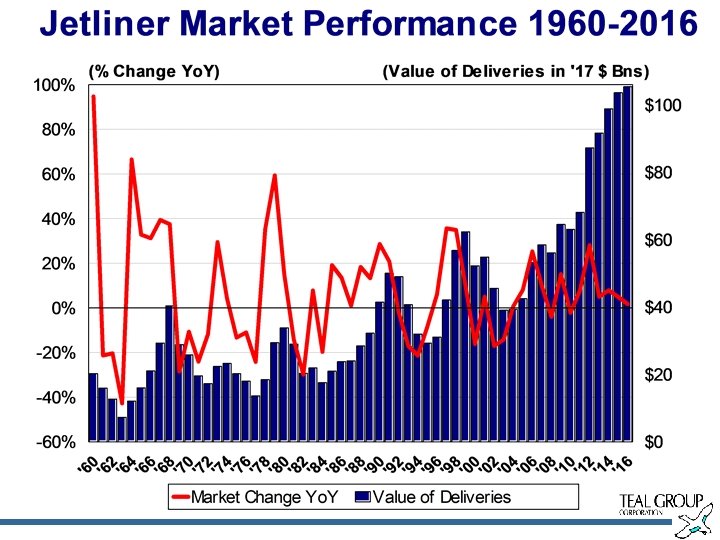
58 68 19 70 19 72 19 74 19 76 19 78 19 80 19 82 19 84 19 86 19 88 19 90 19 92 19 94 19 96 19 98 20 00 20 02 20 04 20 06 20 08 20 10 20 12 20 14 20 16 20 18 20 20 20 22 20 24 20 26 19 64 19 62 19 60 19 19 Value in 2017 $ Billions 120 80 1000 60 800 40 600 400 20 200 0 0 Value Units Deliveries "It Was Different That Time, " We Hope To One Day Say 1800 1600 1400 1200
Firm Order Backlog Values 500 450 400 2017 $Billions 350 300 250 200 150 100 50 0 Boeing Airbus Bombardier 1 h 1997 130, 0 48, 6 — 1 h 2001 End 2004 End 2006 End 2008 End 2009 End 2010 End 2011 End 2012 End 2013 End 2014 End 2015 End 2016 107, 8 79, 5 199, 1 300, 4 271, 1 270, 0 300, 1 316, 8 365, 3 421, 9 413, 8 399, 7 112, 9 115, 5 173, 0 281, 8 268, 2 277, 6 309, 5 321, 6 397, 4 436, 3 456, 7 463, 0 — — 2, 0 3, 5 5, 2 5, 8 7, 1 9, 5 9, 2
Mid-Market Backlogs: Airbus's Strong Position 1400 1200 1000 800 600 400 200 0 A 321 neo 737 MAX 9 A 321 ceo 787 -8 737 -900 A 330 -200 A 330 -800
Regional Market: A Series of Crashing Waves Value of Deliveries ('17 $Billions) $10 $9 $8 $7 $6 $5 $4 $3 $2 $1 19/37 -seat Props 38/72 -seat Props 30/50 -seat Jets 70/80 -seat Jets 90/110 -seat Jets '1 4 '0 8 '0 2 '9 6 '9 0 '8 4 '7 8 '7 2 '6 6 '6 0 $0
Regional Deliveries By OEM (Value) 10 9 Value of Deliveries '17 $ Billions 8 7 6 5 4 3 2 1 0 '07 '08 '09 '10 '11 Bombardier '12 '13 '14 '15 Embraer (pre-E-2) '16 E-2 '17 '18 MRJ '19 ATR '20 '21 Super. Jet '22 '23 ARJ 21 '24 '25 '26
Business Aircraft Market by Class A Gradual Shift Towards Larger Aircraft $35 $30 '17 $Millions $25 $20 $15 $10 $5 $0 '07 '08 '09 '10 '11 '12 '13 '14 '15 '16 '17 '18 '19 '20 '21 '22 '23 '24 Very Light Entry Level Mid-Sized Super Mid-Sized Large Very Large Ultra Jetliners+RJs Turboprops '25 ‘ 26
Pardon Me, Could I Possibly Interest You In A Section Pertaining To Canada?
. 1 90 6. 13 5. 1 90 6. 14 5. 1 90 6. 15 5. 1 90 6. 16 5. 1 90 6. 17 5. 1 90 6. 18 5. 1 90 6. 19 5. 1 90 6. 20 5. 1 90 6. 21 5. 1 90 6. 22 5. 1 90 6. 23 5. 1 90 6. 24 5. 1 90 6. 25 5. 1 90 6. 26 5. 1 90 6. 27 5. 1 90 6. 28 5. 1 90 6. 29 5. 1 90 6. 30 5. 1 90 5 7. 1. 19 05 7. 2. 19 05 7. 3. 19 05 7. 4. 19 05 7. 5. 19 05 7. 6. 19 05 7. 7. 19 05 7. 8. 19 05 6. 12 Canada – Total Aerospace Exports and Imports Millions of $US $16 000 $14 000 $9 500 $12 000 Source: OECD and TEAL GROUP $7 500 $10 000 $5 500 $8 000 $6 000 $3 500 $4 000 $1 500 $2 000 $0 -$500 SURPLUS/DEFICIT EXPORTS IMPORTS
Canada –Aerospace Exports Thousands of $US $382 576 $312 855 $286 573 $244 256 $337 293 $108 051 $187 710 US $359 222 $600 324 France $530 602 $420 536 $726 671 Germany UK $754 785 $481 777 Spain Mexico $6 533 619 $7 808 997 China Singapore Japan 2006 Source: OECD and TEAL GROUP 2016
Canada –Aerospace Imports Thousands of $US $178 101 $271 647 $216 287 $401 406 $1 102 386 US France Germany UK Spain Mexico China $1 022 052 $500 340 $142 592 $565 938 $368 726 $6 316 418 $4 218 947 2006 Source: OECD and TEAL GROUP 2016
Canada – Aerospace Surpluses and Deficits 2016 Millions of $US $1 400 $900 $400 -$100 Source: OECD and TEAL GROUP Si an Ja p ng ap or e in a Ch M ex ic o in Sp a K U an y er m G Fr an ce U S -$600
Canada – Imports, Intermediate vs. Capital Goods Millions of $US $9 000 $8 000 $7 000 $6 000 $5 000 $4 000 $3 000 $2 000 $1 000 $0 90 19 19 92 19 94 19 96 98 19 00 20 02 20 Intermediate Goods Source: OECD and TEAL GROUP 04 20 06 20 08 20 Capital Goods 10 20 12 20 14 20 16 20
RJs Dash 8 Lear Challenger/Global CSeries 23 20 22 20 21 20 20 20 19 20 18 20 17 20 16 20 15 20 14 20 13 20 12 20 11 20 10 20 09 20 08 20 07 20 06 20 05 20 04 20 03 20 02 20 01 20 00 20 99 19 98 19 97 19 96 19 Deliveries in 2017 $ Billions BBD Aero: What A Long Weird Road It's Been 12 10 8 6 4 2 0
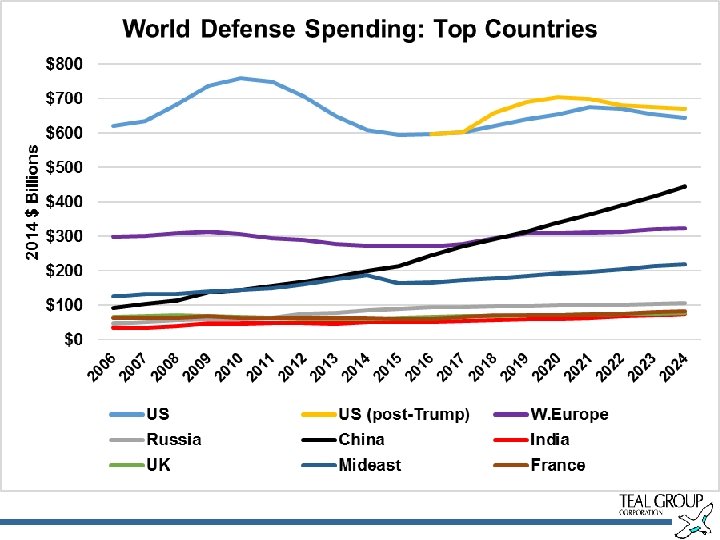
Military Markets
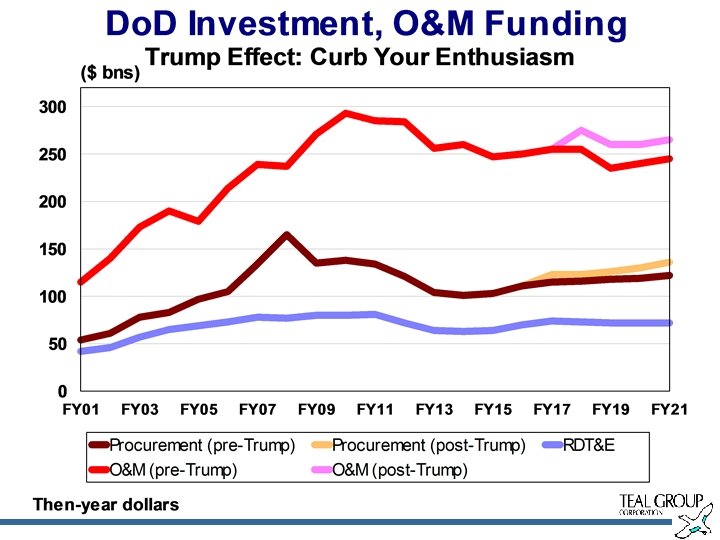
Do. D Tactical Aircraft Procurement FY 86 -FY 17 A Sudden Return to the Peak, But Still a Fundamental Problem 12 400 Funding 350 Units 300 8 6 200 150 4 100 2 50 0 FY 1 FY 6 17 FY 14 FY 12 10 FY FY 08 FY 06 FY 04 FY 02 FY 00 FY 98 FY 96 FY 94 FY 92 FY 90 FY 88 0 FY 86 Units Procured 250 Funding in FY 17 $ Billions 10
World Fighter Production Shares 30 (Value of Deliveries in '17 Billions) 25 20 15 10 5 0 '07 '08 '09 F-35 US '10 '11 '12 '13 F-35 International '14 '15 '16 Undetermined '17 '18 Europe '19 '20 Russia '21 '22 Ro. W '23 '24 '25 Non-F-35 US 26
Trainer/Light Attack Aircraft Market Outlook 4, 5 (Share by '17 $ Billions Value) 4 3, 5 3 2, 5 2 1, 5 1 0, 5 0 '07 '08 '09 '10 '11 '12 '13 '14 '15 '16 Props '17 Jets '18 T-X '19 '20 '21 '22 '23 '24 '25 26
Military Transport Deliveries by Value 7 Value in 2017 $Billions 6 5 4 3 2 1 0 '07 '08 '09 '10 '11 '12 C-17 '13 '14 C-130 J '15 '16 '17 A 400 M '18 '19 KC-390 '21 Other '22 '23 '24 '25 '26
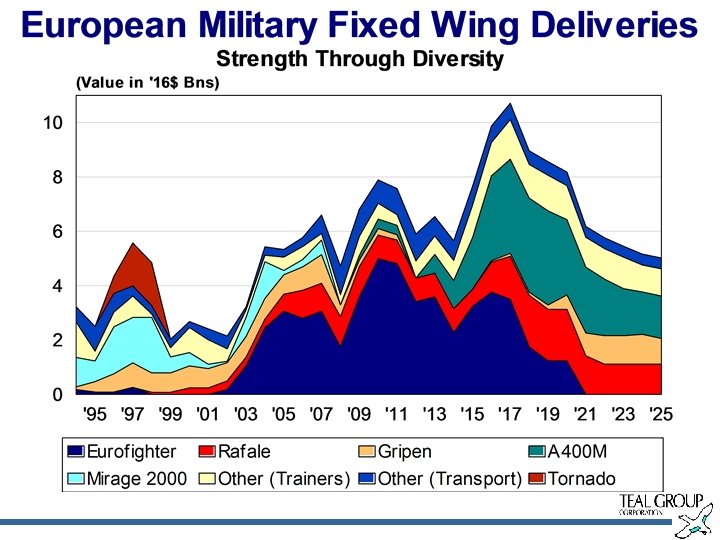
US Military Fixed Wing Deliveries 20 18 16 Deliveries in 2017 $ Billions 14 12 10 8 6 4 2 0 '94 '95 '96 '97 '98 '99 C-17 '00 '01 AV-8 B '02 '03 F/A-18 '04 '05 F-15 '06 F-16 '07 '08 F-22 '09 T-45 '10 '11 T-6 '12 C-130 '13 '14 F-35 '15 T-X '16 '17 B-21 '18 '19 20 21 22 23
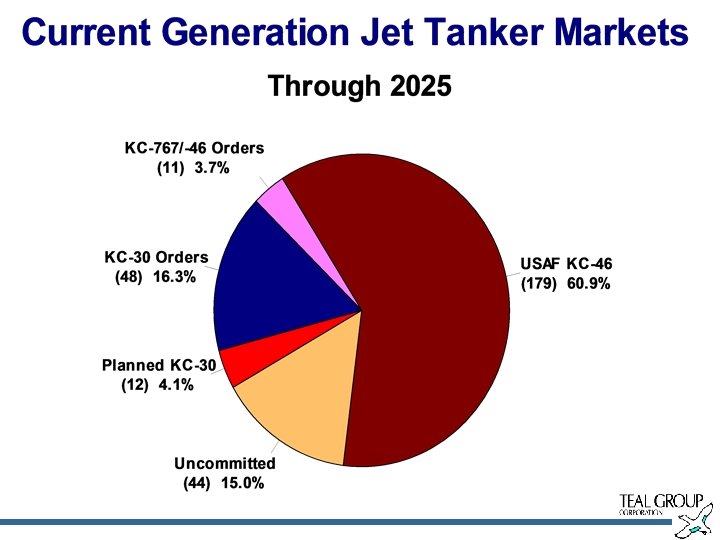
C-17 P-8 KC-46/767 F-15 F/A-18 25 20 24 20 23 20 22 20 21 20 20 20 19 20 18 20 17 20 16 20 15 20 14 20 13 20 12 20 11 20 10 20 09 20 08 20 07 20 06 20 05 20 04 20 03 20 02 20 Deliveries in 2017 $ Bns BMA: From Dedicated Platforms To Jetliner Derivatives, And Then? $10 $9 $8 $7 $6 $5 $4 $3 $2 $1 $0
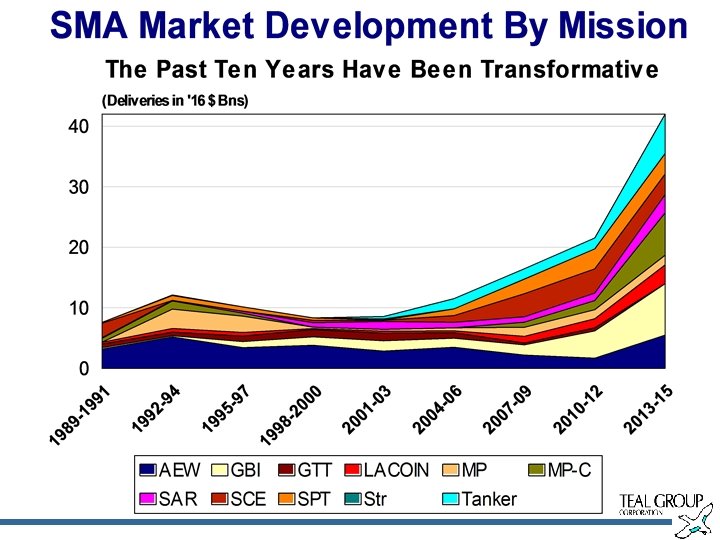
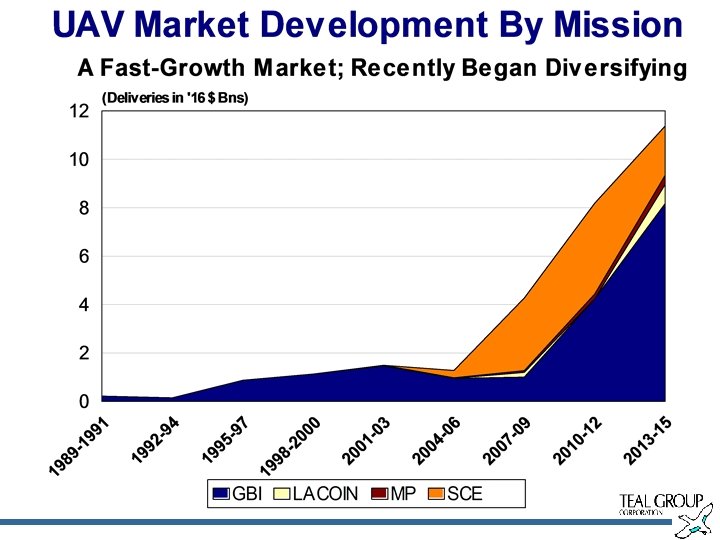
Missiles, Munitions, UAVs: Strong Growth 20 18 Deliveries in 2017 $ billions 16 14 12 10 8 6 4 2 0 '04 '05 '06 '07 '08 AAM '09 ASM '10 '11 ADM '12 ATM '13 '14 '15 Anti-Ship '16 SSM '17 '18 '19 '20 Smart munitions '21 '22 UAVs '23 '24 '25 ‘ 26
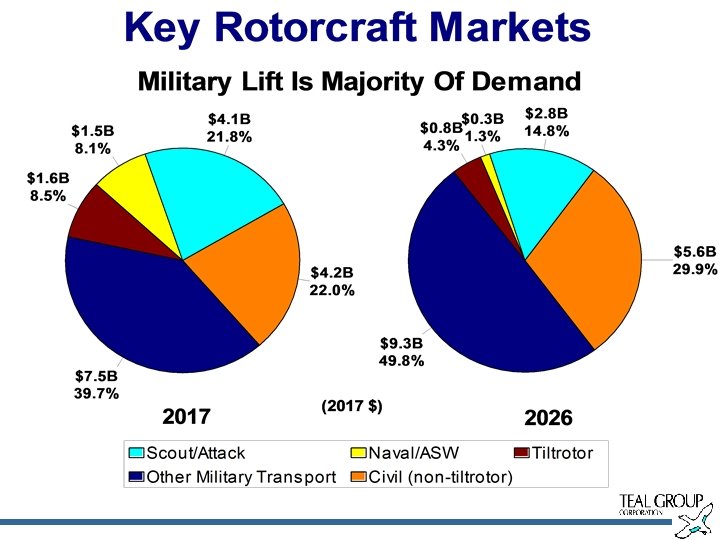
Rotorcraft
29. 0 6 30. 19. 0 05 6 01. 19 0: 0. 0 05 0: 0 7 02. 19 0: 0 05 0: 0 7 03. 19 0: 0 05 0: 0 7 04. 19 0: 0 05 0: 0 7 05. 19 0: 0 05 0: 0 7 06. 19 0: 0 05 0: 0 7 07. 19 0: 0 05 0: 0 7 08. 19 0: 0 05 0: 0 7 09. 19 0: 0 05 0: 0 7 10. 19 0: 0 05 0: 0 7 11. 19 0: 0 05 0: 0 7 12. 19 0: 0 05 0: 0 7 13. 19 0: 0 05 0: 0 7 14. 19 0: 0 05 0: 0 7 15. 19 0: 0 05 0: 0 7 16. 19 0: 0 05 0: 0 7 17. 19 0: 0 05 0: 0 7 18. 19 0: 0 05 0: 0 7. 19 0: 0 0 05 0: 0: 00 00 : 0 0 Units 1 800 1 400 1 200 1 000 15 800 10 600 400 5 200 0 Value Units Delivered Value (2017 $ Billions) The World Rotorcraft Market The End of a Great Surge 25 1 600 20
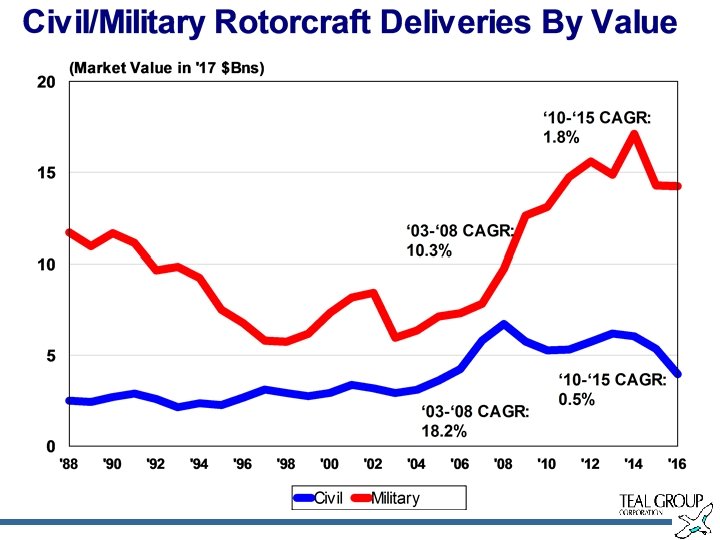
US Miliary Rotorcraft Market Falling; International Military Growing, Civil Falling Market Value in 2017 $Billions 12 10 8 6 4 2 0 07 08 09 10 11 12 13 14 15 16 17 18 19 20 21 22 23 24 25 26 20 20 20 20 20 Civil Military (US) Military (International)
US Military Rotorcraft Deliveries By Value (Includes Exports) 10 8 6 4 2 V-22 AH-64 MH-60 R/S/SH-60 UH-60 CH-47 H-1 USAF UH-1 Repl CH-53 24 20 22 20 20 20 18 20 16 20 14 20 12 20 10 20 08 20 06 20 04 20 02 20 00 20 98 0 19 Deliveries in 2017 $ Billions 12
Rotorcraft Manufacturer Market Shares 2017 -2026 vs 2007 -2016 30% Excludes undetermined competitions 24, 8% 24, 6% 25% 22, 9% 24, 1% 21, 4% 21, 1% 20% 15, 7% 15% 13, 3% 12, 8% 11, 5% 10% 4, 6% 5% 3, 0% 0% Airbus Bell Boeing 2007 -2016 Leonardo 2017 -2026 Sikorsky Other
Concluding Thoughts
Global Aircraft Market Outlook In One Page