Health Tracker Professional Monitoring Plugin for Net App


- Slides: 17
Health. Tracker Professional Monitoring Plugin for Net. App Storage Systems Robert Graf CEO rg@prolion. at +43 664 1314403 2 nd Sept. 2019
We care about your data! 1001110 1101011 1010011 1111001 protect manage analyze
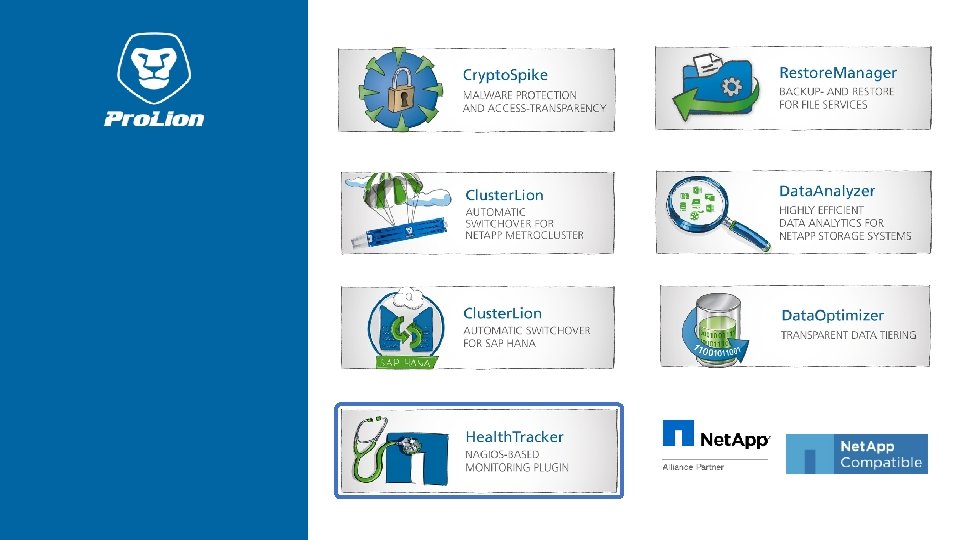
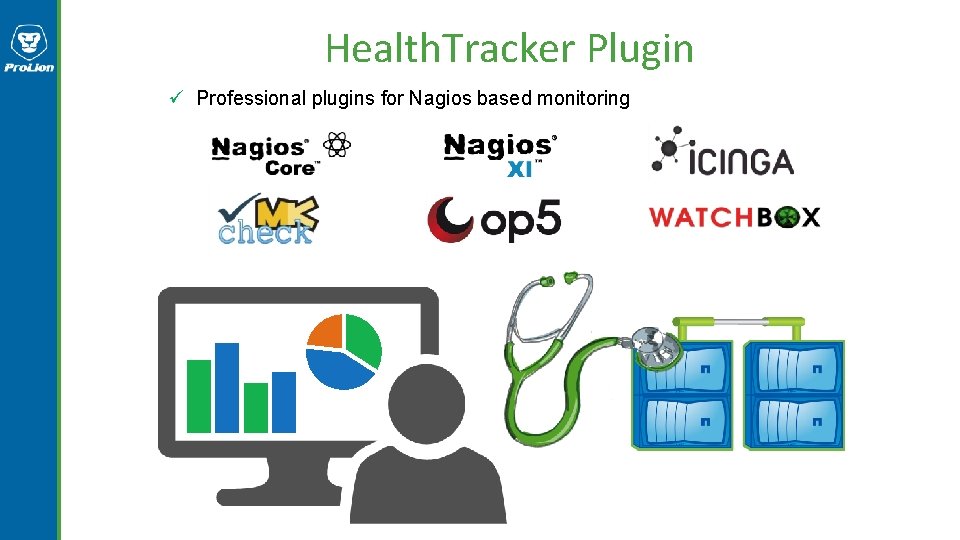
Health. Tracker Plugin ü Professional plugins for Nagios based monitoring
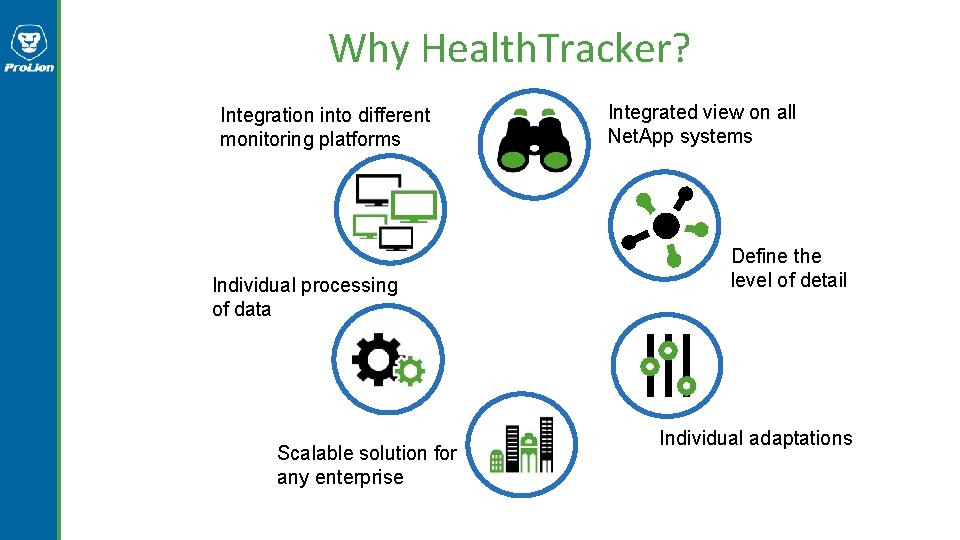
Why Health. Tracker? Integration into different monitoring platforms Individual processing of data Scalable solution for any enterprise Integrated view on all Net. App systems Define the level of detail Individual adaptations
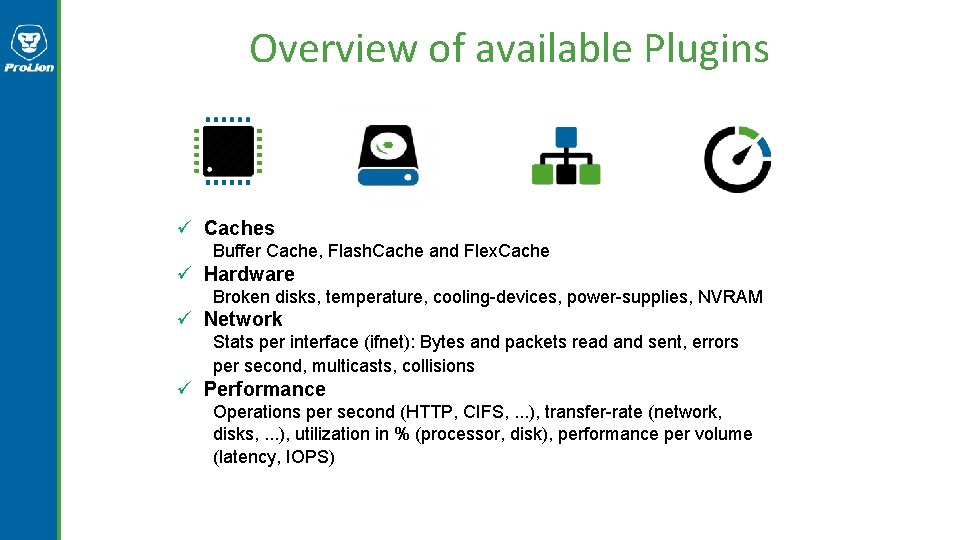
Overview of available Plugins ü Caches Buffer Cache, Flash. Cache and Flex. Cache ü Hardware Broken disks, temperature, cooling-devices, power-supplies, NVRAM ü Network Stats per interface (ifnet): Bytes and packets read and sent, errors per second, multicasts, collisions ü Performance Operations per second (HTTP, CIFS, . . . ), transfer-rate (network, disks, . . . ), utilization in % (processor, disk), performance per volume (latency, IOPS)
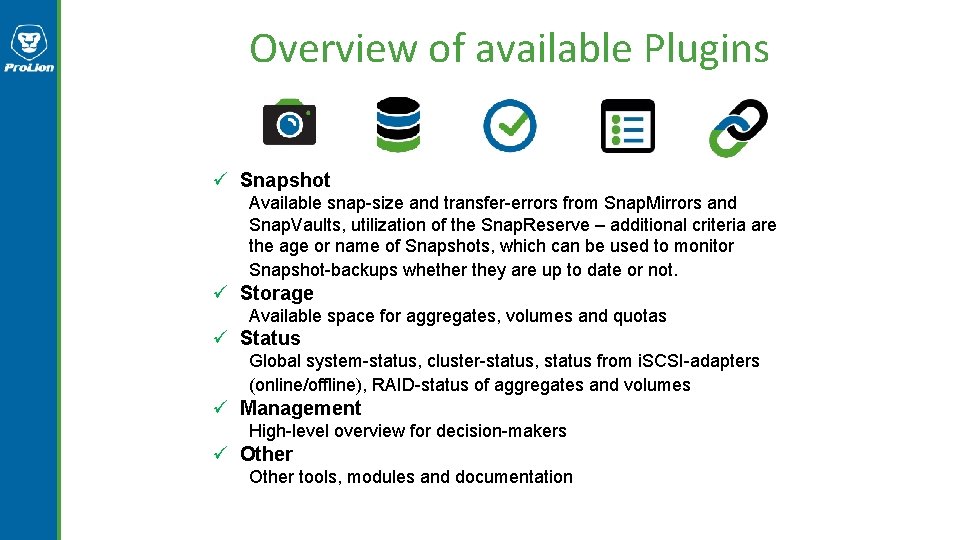
Overview of available Plugins ü Snapshot Available snap-size and transfer-errors from Snap. Mirrors and Snap. Vaults, utilization of the Snap. Reserve – additional criteria are the age or name of Snapshots, which can be used to monitor Snapshot-backups whether they are up to date or not. ü Storage Available space for aggregates, volumes and quotas ü Status Global system-status, cluster-status, status from i. SCSI-adapters (online/offline), RAID-status of aggregates and volumes ü Management High-level overview for decision-makers ü Other tools, modules and documentation
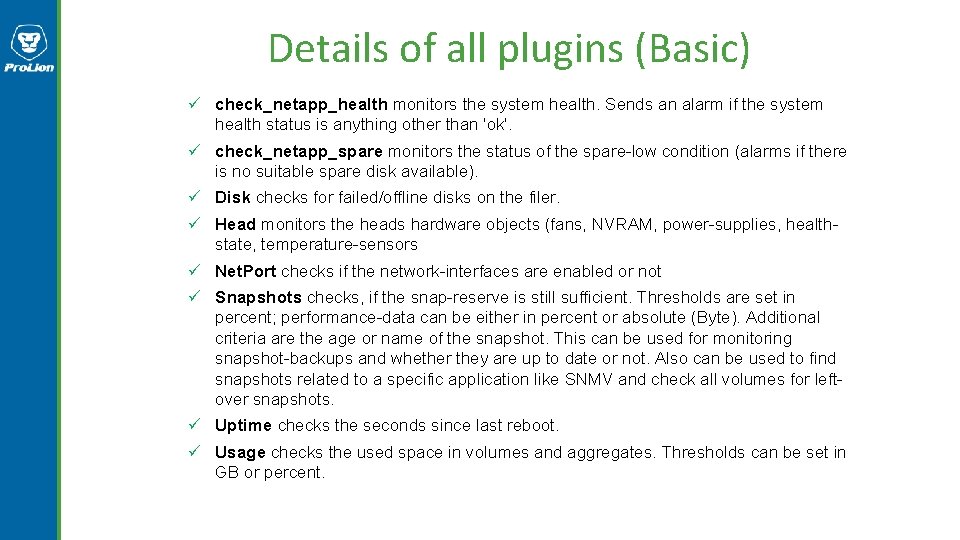
Details of all plugins (Basic) ü check_netapp_health monitors the system health. Sends an alarm if the system health status is anything other than 'ok'. ü check_netapp_spare monitors the status of the spare-low condition (alarms if there is no suitable spare disk available). ü Disk checks for failed/offline disks on the filer. ü Head monitors the heads hardware objects (fans, NVRAM, power-supplies, healthstate, temperature-sensors ü Net. Port checks if the network-interfaces are enabled or not ü Snapshots checks, if the snap-reserve is still sufficient. Thresholds are set in percent; performance-data can be either in percent or absolute (Byte). Additional criteria are the age or name of the snapshot. This can be used for monitoring snapshot-backups and whether they are up to date or not. Also can be used to find snapshots related to a specific application like SNMV and check all volumes for leftover snapshots. ü Uptime checks the seconds since last reboot. ü Usage checks the used space in volumes and aggregates. Thresholds can be set in GB or percent.
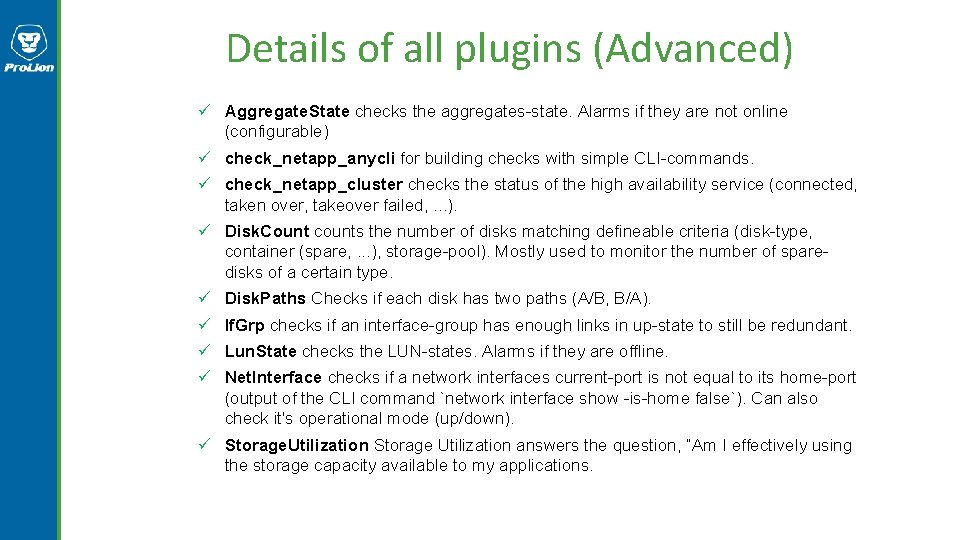
Details of all plugins (Advanced) ü Aggregate. State checks the aggregates-state. Alarms if they are not online (configurable) ü check_netapp_anycli for building checks with simple CLI-commands. ü check_netapp_cluster checks the status of the high availability service (connected, taken over, takeover failed, . . . ). ü Disk. Count counts the number of disks matching defineable criteria (disk-type, container (spare, . . . ), storage-pool). Mostly used to monitor the number of sparedisks of a certain type. ü Disk. Paths Checks if each disk has two paths (A/B, B/A). ü If. Grp checks if an interface-group has enough links in up-state to still be redundant. ü Lun. State checks the LUN-states. Alarms if they are offline. ü Net. Interface checks if a network interfaces current-port is not equal to its home-port (output of the CLI command `network interface show -is-home false`). Can also check it's operational mode (up/down). ü Storage. Utilization Storage Utilization answers the question, “Am I effectively using the storage capacity available to my applications.
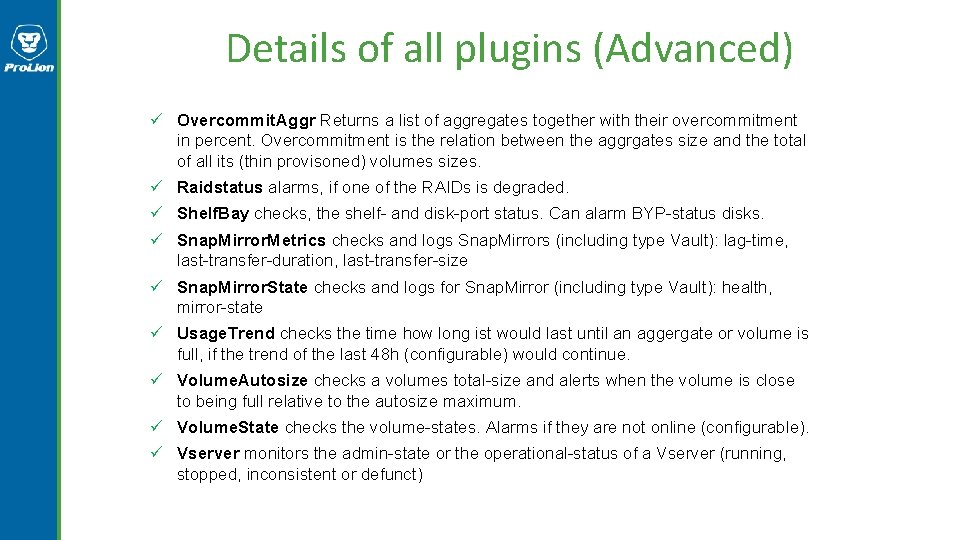
Details of all plugins (Advanced) ü Overcommit. Aggr Returns a list of aggregates together with their overcommitment in percent. Overcommitment is the relation between the aggrgates size and the total of all its (thin provisoned) volumes sizes. ü Raidstatus alarms, if one of the RAIDs is degraded. ü Shelf. Bay checks, the shelf- and disk-port status. Can alarm BYP-status disks. ü Snap. Mirror. Metrics checks and logs Snap. Mirrors (including type Vault): lag-time, last-transfer-duration, last-transfer-size ü Snap. Mirror. State checks and logs for Snap. Mirror (including type Vault): health, mirror-state ü Usage. Trend checks the time how long ist would last until an aggergate or volume is full, if the trend of the last 48 h (configurable) would continue. ü Volume. Autosize checks a volumes total-size and alerts when the volume is close to being full relative to the autosize maximum. ü Volume. State checks the volume-states. Alarms if they are not online (configurable). ü Vserver monitors the admin-state or the operational-status of a Vserver (running, stopped, inconsistent or defunct)
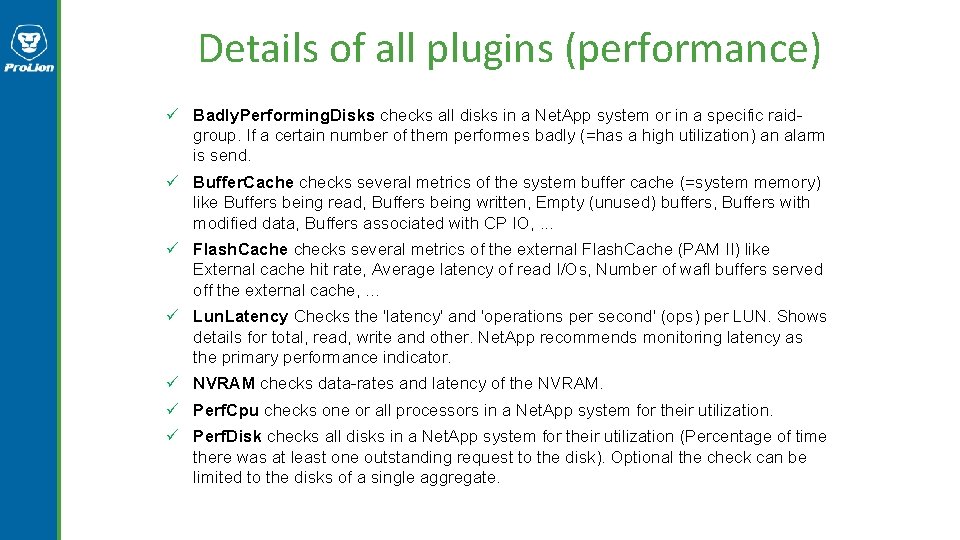
Details of all plugins (performance) ü Badly. Performing. Disks checks all disks in a Net. App system or in a specific raidgroup. If a certain number of them performes badly (=has a high utilization) an alarm is send. ü Buffer. Cache checks several metrics of the system buffer cache (=system memory) like Buffers being read, Buffers being written, Empty (unused) buffers, Buffers with modified data, Buffers associated with CP IO, . . . ü Flash. Cache checks several metrics of the external Flash. Cache (PAM II) like External cache hit rate, Average latency of read I/Os, Number of wafl buffers served off the external cache, . . . ü Lun. Latency Checks the 'latency' and 'operations per second' (ops) per LUN. Shows details for total, read, write and other. Net. App recommends monitoring latency as the primary performance indicator. ü NVRAM checks data-rates and latency of the NVRAM. ü Perf. Cpu checks one or all processors in a Net. App system for their utilization. ü Perf. Disk checks all disks in a Net. App system for their utilization (Percentage of time there was at least one outstanding request to the disk). Optional the check can be limited to the disks of a single aggregate.
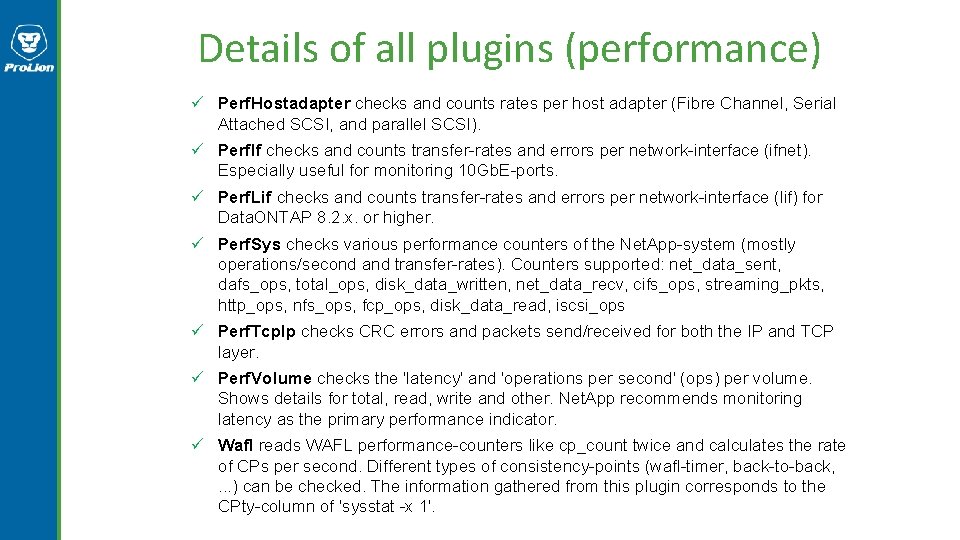
Details of all plugins (performance) ü Perf. Hostadapter checks and counts rates per host adapter (Fibre Channel, Serial Attached SCSI, and parallel SCSI). ü Perf. If checks and counts transfer-rates and errors per network-interface (ifnet). Especially useful for monitoring 10 Gb. E-ports. ü Perf. Lif checks and counts transfer-rates and errors per network-interface (lif) for Data. ONTAP 8. 2. x. or higher. ü Perf. Sys checks various performance counters of the Net. App-system (mostly operations/second and transfer-rates). Counters supported: net_data_sent, dafs_ops, total_ops, disk_data_written, net_data_recv, cifs_ops, streaming_pkts, http_ops, nfs_ops, fcp_ops, disk_data_read, iscsi_ops ü Perf. Tcp. Ip checks CRC errors and packets send/received for both the IP and TCP layer. ü Perf. Volume checks the 'latency' and 'operations per second' (ops) per volume. Shows details for total, read, write and other. Net. App recommends monitoring latency as the primary performance indicator. ü Wafl reads WAFL performance-counters like cp_count twice and calculates the rate of CPs per second. Different types of consistency-points (wafl-timer, back-to-back, . . . ) can be checked. The information gathered from this plugin corresponds to the CPty-column of 'sysstat -x 1'.
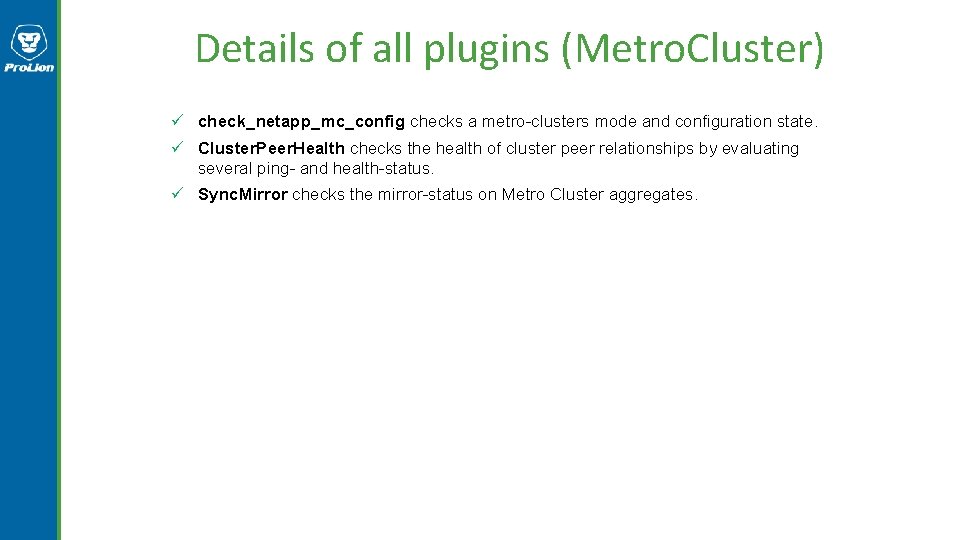
Details of all plugins (Metro. Cluster) ü check_netapp_mc_config checks a metro-clusters mode and configuration state. ü Cluster. Peer. Health checks the health of cluster peer relationships by evaluating several ping- and health-status. ü Sync. Mirror checks the mirror-status on Metro Cluster aggregates.
Evaluation üTRIAL PERIOD Free evaluation for 30 days ü ALL FEATURES Full functionality ü ADDITIONAL SERVICE Support during trial period
EMC, Veritas and Brocade AVAMAR | CENTERA | DATADOMAIN | RECOVER POINT ISILON | VMAX | VNX BLOCK | VNX FILE | VPLEX Net. Backup Appliance Fibre. Channel Switches and Dell-EMC OEM
Health. Tracker Plugin Use professional Nagios based plugins for your Net. App system monitoring
. . . we go the extra mile. . .