Foundations of Astronomy 13 e Seeds Chapter 9


 Star A Star B Earth Both")

 Apparent luminosity is measured using a magnitude scale, based")


 of a Star Brightness also increases with size: A B Star")

 For the vast majority of stars that cannot be imaged directly,")


Spectral Classification Hottest Stars Coolest Stars Temperatures Above 30, 000°C Below 3, 900°C")


")

 Our height and Weight are also Found along a “main sequence”.")


 © Cengage Learning 2016")


 © Cengage Learning 2016")
 • Typical sequence of spectra from a spectroscopic binary system")


 • Main problem for creating such a survey: –")
 are the most common stars")


 • A star seems to have no measurable stellar parallax.")


- Slides: 59
Foundations of Astronomy | 13 e Seeds Chapter 9 The Family of Stars © Cengage Learning 2016
Guidepost • In this chapter, you will consider stars, the building blocks of the Universe: – How far away are the stars? – How much energy do stars make? – How do spectra of stars allow you to determine their temperatures? – How big are stars? – How much mass do stars contain? © Cengage Learning 2016
Introduction • If you hope to understand what the universe is, what our Sun is, what our Earth is, and what we are, you must first understand the stars • Knowing how to find the basic properties of stars, we can trace the history of the stars from birth to death © Cengage Learning 2016
© Cengage Learning 2016
The Properties of Stars • In this chapter, we will learn how we can determine a star’s: – Distance, luminosity, radius, mass – And how all the different types of stars make up the big family of stars © Cengage Learning 2016
How can we tell how far? Review of parallax: star appears slightly shifted from different positions of the Earth on its orbit (parallax decreases as distance increases) Can’t be used for stars more than 50 LY away
The farther away the star the smaller the parallax angle
9 -2 Apparent Brightness, Intrinsic Brightness, and Luminosity • The more distant a light source is, the fainter it appears – Apparent brightness: a function of how much light we can see © Cengage Learning 2016
Luminosity and Apparent Brightness ● Luminosity, or absolute/intrinsic brightness, is a measure of the total Energy radiated by a star. This is an intrinsic property… ● Apparent brightness is how bright a star Appears when viewed from Earth. ○ Depends on the absolute brightness [luminosity] but also on the distance of the star: ○ Remember this symbol is proportionality… Your book calls this “FLUX’
Intrinsic Brightness / Absolute brightness or luminosity (2) Star A Star B Earth Both stars may appear equally bright, although star A is intrinsically much brighter than star B.
Distance vs. brightness
Luminosity and Apparent Brightness (2) Apparent luminosity is measured using a magnitude scale, based on OUR VIEW. Absolute brightness: magnitude that a star would have if it were at a distance of 10 pc (1 pc= 3. 26 light years) • Luminosity ratio: Difference in absolute magnitudes: MV = 6. 8 – 5. 5 = 1. 3 => (2. 51)1. 3 = 3. 3 Flux ratio: 2. 51
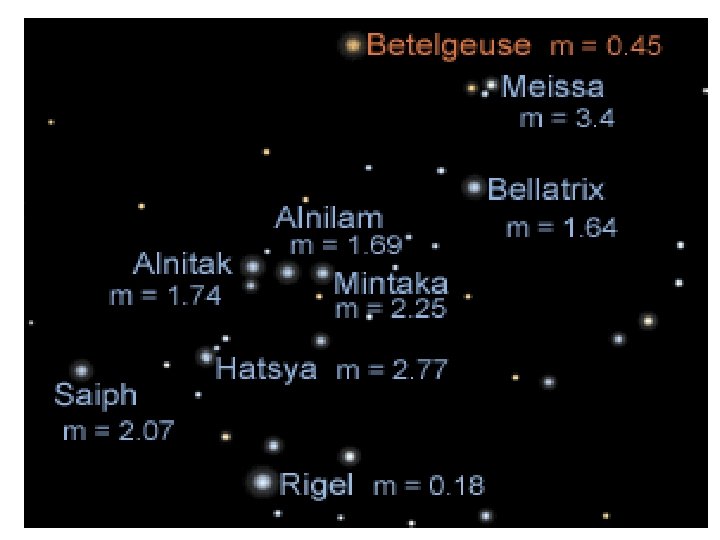
Distance and Intrinsic Brightness Rigel appears 1. 28 times brighter than Betelgeuse, But Rigel is 1. 6 times further away than Betelgeuse (in this case-distance known) Betelgeuse • Rigel is intrinsically 1. 28*(1. 6)2 = 3. 3 times brighter than Betelgeuse Rigel
Luminosity and Apparent Brightness This is an example of an inverse-square law (think about these imaginary spheres surrounding the light source…. Energy is spread Out over an Increasing area And therefore “diluted” as it Expands into Space…. Ex: Jupiter, 5 % of Sunlight—solar panels wouldn’t work!!
The Size (Radius) of a Star Brightness also increases with size: A B Star B will be brighter than star A. Absolute brightness is proportional to radius squared, L ~ R 2.
Stellar Sizes radius-temp-luminosity ---indirect measurement of size.
Stellar Sizes (2) For the vast majority of stars that cannot be imaged directly, size must be calculated knowing the luminosity and temperature: Dwarf stars have radii equal to, or less than, the Sun’s. Giant stars have radii between 10 and 100 times the Sun’s. Supergiant stars have radii more than 100 times the Sun’s.
Example: Stellar Radii • Polaris has just about the same spectral type (and thus surface temperature) as our sun, but it is 10, 000 times brighter than our sun • How much bigger is Polaris than our sun? • This causes its luminosity to be 1002 = 10, 000 times more than our sun’s –(Square root of 10000) © Cengage Learning 2016
Stellar Temperatures The color of a star is indicative of its temperature. Red stars are relatively cool, while blue ones are hotter.
Stellar Temperatures There are seven general categories of stellar spectra, corresponding to different TEMPERATURES. From highest to lowest, those categories are: OBAFGKM
(temps 2)Spectral Classification Hottest Stars Coolest Stars Temperatures Above 30, 000°C Below 3, 900°C
The Brightest Stars The open star cluster M 39 Brightest~Blue and red stars
Stellar Temperatures ● Stellar spectra are the source of all detailed information we have on stellar composition. The seven spectral types: ● Dark lines are absorption. . ● Notice short wavelengths are absorbed in cooler Stars
Temperature Spectral Types • Different types of stars show different characteristic sets of absorption lines © Cengage Learning 2016
• Infer the composition of stars from the relative strength of absorption lines
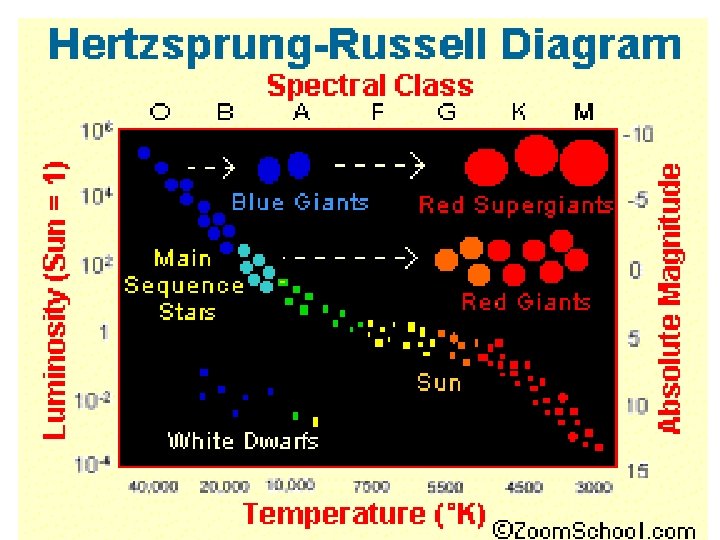
The Hertzsprung-Russell Diagram • We know that stars have different: – Temperatures – Luminosities – Sizes • To order them, we use the Hertzsprung. Russell (H-R) diagram – Luminosity (or absolute magnitude) versus temperature (or spectral type) © Cengage Learning 2016
H-R Diagram (showing Main Sequence)
Types of stars • Main sequence stars – dwarf stars – mid mass main sequence – high mass main sequence • Giant stars • Supergiant stars • White dwarfs • black dwarfs (but haven’t found any yet) Our Sun: G 2 star on the Main Sequence © Cengage Learning 2016
H-R Diagram (4) Our height and Weight are also Found along a “main sequence”. . This is like the Average. Taller people usually Weigh more… What are the exceptions?
H-R Diagram. Muy Importante’ ❖When stars are on the main sequence They are in equilibrium. ❖They are burning hydrogen at a constant rate, producing helium. ❖Outward force of Fusion is balanced with inward force of gravity. ❖Spend 90% of life here, so 90% of stars are found here.
Hydrostatic equilibrium gravity balance with fusion 4/2/2014 33
The Hertzsprung-Russell Diagram (cont’d. ) © Cengage Learning 2016
The Radii of Stars in the Hertzsprung-Russell Diagram Betelgeuse Rigel 10 Polaris Sun , 00 sun 0 tim ’s r es t h ad ius e 10 0 t su ime n’s s rad the ius As lar ge as the su n
Masses of Stars in the Hertzsprung-Russell Diagram The higher a star’s mass, the brighter it is: High-mass stars have much shorter lives than low-mass stars: 10 Msun: ~ 30 million yr. Sun: ~ 10 billion yr. gh m as s es M as s Low ses s ma 0. 1 Msun: ~ 3 trillion yr. Hi
The Radii of Stars in the H-R Diagram © Cengage Learning 2016
9 -5 Star Masses ― Binary Stars • More than 50 % of all stars in our Milky Way • Pairs or multiple systems of stars which orbit their common center of mass • The more unequal the masses are, the more it shifts toward the more massive star • Use Kepler’s laws © Cengage Learning 2016
How Do We Know? 9 -1 • Chains of Inferences – For quantities that cannot be measured directly, scientists must construct chains of inference that connect observable parameters to the unobservable quantities. – The mass of a star cannot be measured directly, so one must use what is observable ― orbital period angular separation ― to figure out step-by-step the parameters needed to calculate the mass. © Cengage Learning 2016
Visual Binaries • The ideal case – Both stars can be seen directly – But usually, binary separation cannot be measured directly because the stars are too close to each other – spectroscopic binaries are the most common, allowing for mass calculation © Cengage Learning 2016
Spectroscopic Binaries • In the spectrum: – Approaching star → blue shifted lines – Receding star → red shifted lines • Doppler shift → Measurement of radial velocities → Estimate of separation → Estimate of masses © Cengage Learning 2016
Spectroscopic Binaries (cont’d. ) © Cengage Learning 2016
Spectroscopic Binaries (cont’d. ) • Typical sequence of spectra from a spectroscopic binary system © Cengage Learning 2016
Eclipsing Binaries • Usually, the inclination angle of binary systems is unknown → uncertainty in mass estimates – Special case: eclipsing binaries – Here, we know that we are looking at the system edge-on © Cengage Learning 2016
© Cengage Learning 2016
Eclipsing Binaries – Algol in the Constellation of Perseus • From the light curve of Algol, we can infer that the system contains two stars of very different surface temperature, orbiting in a slightly inclined plane © Cengage Learning 2016
Surveys of Stars • Ideal situation for creating a census of the stars: determine properties of all stars within a certain volume © Cengage Learning 2016
© Cengage Learning 2016
© Cengage Learning 2016
Surveys of Stars (cont’d. ) • Main problem for creating such a survey: – Fainter stars are hard to observe © Cengage Learning 2016
Census of Stars • Faint, red dwarfs (low mass) are the most common stars • Bright, hot, blue main-sequence stars (high-mass) are very rare • Giants and supergiants are extremely rare © Cengage Learning 2016
Stellar lifetimes • A consequence: The universe consists of a relatively large proportion of cool, red stars that formed early in the history of the universe 4/2/2014 53
Stellar Mass distributions
How Do We Know? 9 -2 • Basic scientific data – In order to understand the relationship between mass and luminosity, a scientist must know the masses and luminosities of many stars – Over the years, many astronomers have added their results to the growing data file on stellar masses – Scientific data accumulate and can be analyzed by later generations of scientists © Cengage Learning 2016
Discussion Question • A star is listed as a G 2 V. What is the star’s spectral class, luminosity class, and peak color? – Hint: Are you familiar with a G 2 V-type star? • Do you think Earth, and YOU would be here if our sun was a binary? Could our sun be a binary, and we just don’t know it? © Cengage Learning 2016
Discussion Questions (cont’d. ) • A star seems to have no measurable stellar parallax. Can you still find the distance to the star? If so, how? If not, why not? – Hint: Think about the limitations of using parallax to determine distance? © Cengage Learning 2016
Minimum Mass of Main-Sequence Stars Mmin = 0. 08 Msun → Brown Dwarfs
Brown Dwarfs Hard to find because they are very faint and cool; emit mostly in the infrared. Many have been detected in star forming regions like the Orion Nebula.