Factorial Analysis of variance Factorial Analysis of variance


 and adult density (8, 15, 30 y 45")


- Slides: 15
Factorial Analysis of variance
Factorial Analysis of variance
Orthogonal • Is the property that every level of one factor is present in the experiment in combination with every level of the other factor
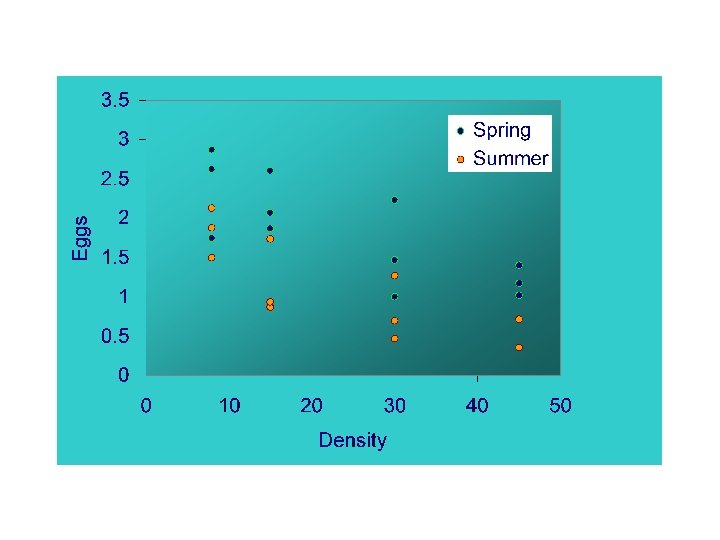
Effects of season (winter/spring and summer/fall) and adult density (8, 15, 30 y 45 animales/225 cm 2) on egg production of Siphonaria diemenensis
Spring-30 Summer- 15 Summer- 45 Summer- 30 Spring-8 Spring-15 Summer- 15 Spring-15 Summer- 8 Spring-45 Summer- 45 Spring-30 Summer- 45 Summer- 30 Spring-8 Summer- 15 Spring-30 Spring-45 Spring-15 Summer- 30 Summer- 8 Spring-8
Two single-factor design animales/225 cm 2 Density treatment 8 15 30 45 Winter/Spring Summer Fall
Null hypothesis • No effects of treatment A • No effects of treatment B • No effects of the interaction
Data Density 8 Spring 15 Summer Spring 30 Summer Spring 45 Summer Spring Summer 2. 875 2. 125 2. 600 0. 867 2. 230 1. 267 1. 400 0. 711 2. 625 1. 50 1. 866 0. 933 1. 466 0. 467 1. 022 0. 356 1. 750 1. 875 2. 066 1. 733 1. 00 0. 700 1. 177 0. 711
• Consider the entire analysis as though it were a single factorial experiment with ab experimental treatments Sum of Squares df Σia Σjb Σjn (Xij-X)2 ab-1 Residual Σia Σjb Σjn (Xijk-Xij)2 ab(n-1) Total Σia Σjb Σkn(Xijk-X)2 abn-1 Source AB
• Now start again and ignore any differences among the data that might be due to factor B. Equivalent to a single-factor analysis of variance of means of the levels of factor A (with a treatments each replicated bn times) Sum of Squares df Σia Σjb Σjn (Xi-X)2 a-1 Residual Σia Σjb Σjn (Xijk-Xij)2 a(bn-1) Total Σia Σjb Σkn(Xijk-X)2 abn-1 Source A A symmetrical argument can be made to analyze the data as a single factor B
Not all the differences among means of the ab combinations of treatments have been accounted for by the two single factor analyses • The remaining differences can be identified empirically as • SS among all treatments- SS factor A- SS factor B= Σia Σjb(Xij-Xi-Xj+X)2
Expected mean squares for test of null hypothesis for two factorial analysis (A fixed, B fixed) Source df Factor A a-1 Factor B b-1 Interaction Ax. B (a-1)(b-1) Within groups ab (n-1) Total abn-1 Sum of squares Mean square Expected mean square F ratio
Source Type III Sum of Squares Mean Square df F Sig. DENSITY 5. 284 3 1. 761 9. 669 . 001 SEASON 3. 250 17. 842 . 001 . 165 3 . 055 . 301 . 824 Error 2. 915 16 . 182 Total 11. 614 23 DENSITY * SEASON
Expected mean squares for test of null hypothesis for two factorial analysis (A random, B random) Source df Factor A a-1 Factor B b-1 Interaction Ax. B (a-1)(b-1) Within groups ab (n-1) Total abn-1 Sum of squares Mean square Expected mean square F ratio