Experimental Design Experimental Design Utilizing the scientific process

 to achieve reliable, valid results. Scientific Method:")


")


")


 in Arthropod hemolymph 240. 6, 238. 2, 236.")
- Slides: 19
Experimental Design
Experimental Design: Utilizing the scientific process (method) to achieve reliable, valid results. Scientific Method: Orderly, logical process scientists use to ask and answer questions. Guidelines of experiments and scientific research.
Reliability vs. Validity of an assessment is the degree to which it measures what it is supposed to measure. Reliability, the extent to which a measurement gives results that are very consistent.
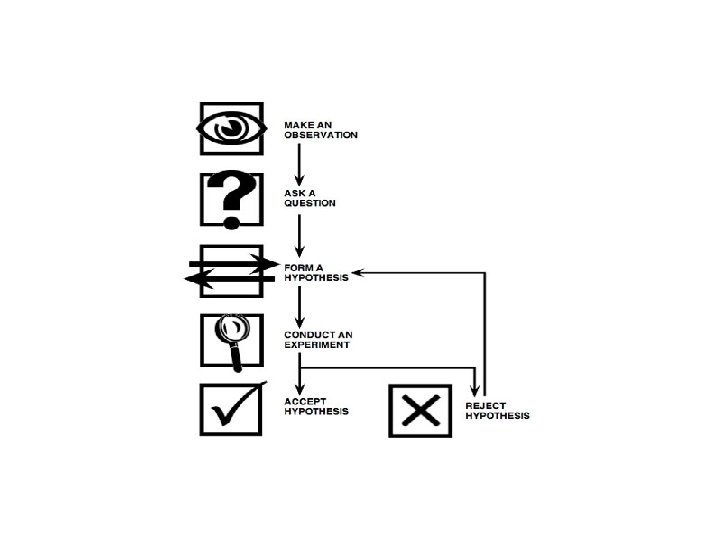
Scientific Method 1. State/Observe/Define the “Problem. ” 2. Research 3. Formulate a HYPOTHESIS - Make Predictions 4. Experiment - Replicate 5. Analyze Results 6. Formulate Conclusions - submit for peer review to validate results/conclusions
The Scientific Method should include the following: • Hypothesis: tentative explanation for an observation. A statement of “no difference. ” - Only usable if it can be falsified - Educated guess - Supported by evidence collected during investigation/observations
• Prediction: Expected outcome of a test/experiment… assuming the hypothesis is correct - “If/then” statements “If the hypothesis is true/supported, then the result will be ……
• Independent Variable: The factor being tested in an experiment. What the experimenter(s) varies in the experiment. - p. H, time, temperature, concentration, etc. - Affects the dependent variable There can be only ONE independent variable in any experiment!
• Dependent Variable: What is being measured in the experiment. - Influenced/affected by the independent variable - plant height, # infected, size of the tumor, bone density, etc. There can be multiple dependent variables in any given experiment!
• Controlled Variables: Variable kept CONSTANT during the experiment - CONSTANTS * Procedure: Process used to measure the dependent variable - developed by reading articles, communicating with other scientists, or, found in lab manuals
• Level of Treatment: appropriate values to use for the independent variable - based on prior knowledge/research • Replication: the number of times the experiment is repeated - must use the EXACT SAME CONDITIONS in all trials - obtain an average result from different trials
• Control: treatment that eliminates the independent variable or sets it at a standard value - allows for COMPARISONS to be made
Rattus norvegicus (Norway Rat)
What is the effect of protein supplements on Norway Rat weights? • • • Hypothesis Predictions Dependent variable(s) Independent variable Replication Controlled variables (Constants) Sample size Procedure
Biometry Biostatistical Analysis
Purpose • To quantify observations • To make decisions concerning the experimental results (accept or reject the H 0 with some indication of your confidence in the reliability and validity of the results)
Measures of Central Tendency • Mean: Average “score” or measurement • Median: Middle score or measurement in a set of data. Eliminates “outliers!”
• Mode: Most frequently occurring measurement in a set of data. Can have multiple modes. • Range: The difference between the highest and lowest measurements in a group/set of data
Problem: Amino acid concentration (mg/100 ml) in Arthropod hemolymph 240. 6, 238. 2, 236. 4, 244. 8, 240. 7, 241. 3 238. 2, 237. 9 Determine: Mean, Median, Mode, and Range for this set of data