Evolution Lamarcks Theory of Acquired Inheritance early 1800



- Slides: 88
Evolution
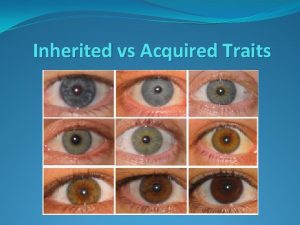
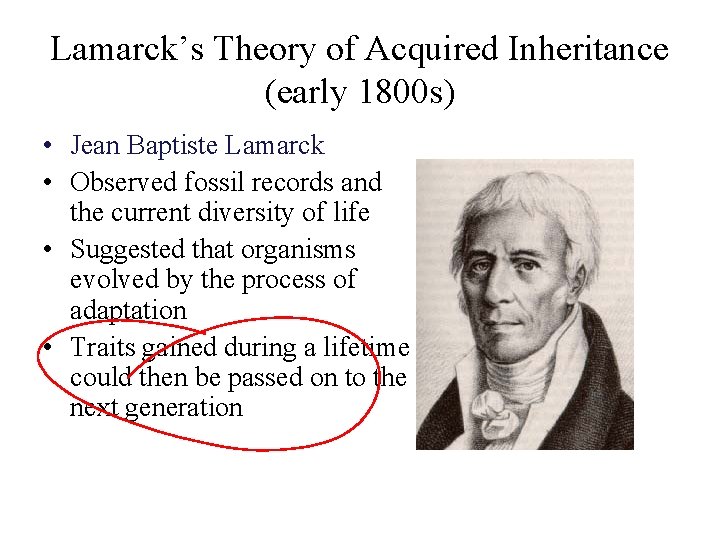
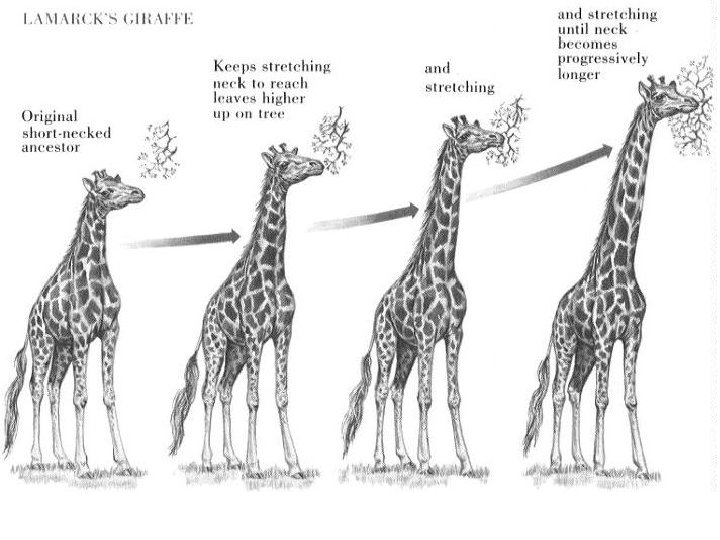
Lamarck’s Theory of Acquired Inheritance (early 1800 s) • Jean Baptiste Lamarck • Observed fossil records and the current diversity of life • Suggested that organisms evolved by the process of adaptation • Traits gained during a lifetime could then be passed on to the next generation
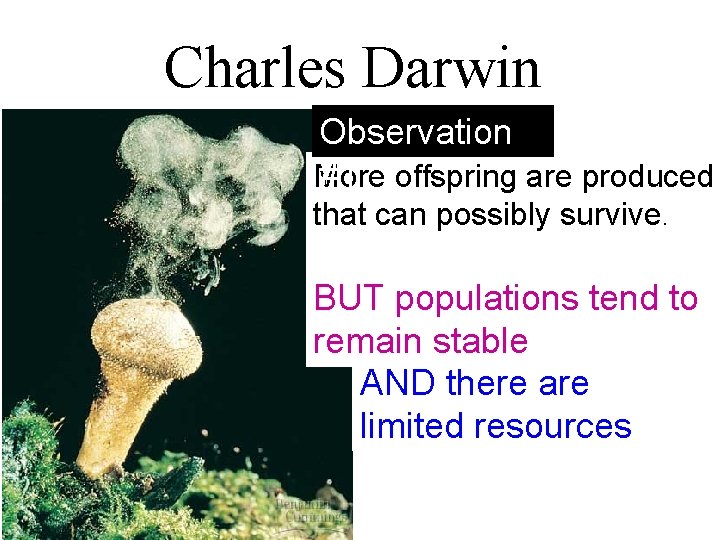
Charles Darwin Observation More #1 offspring are produced that can possibly survive. BUT populations tend to remain stable AND there are limited resources
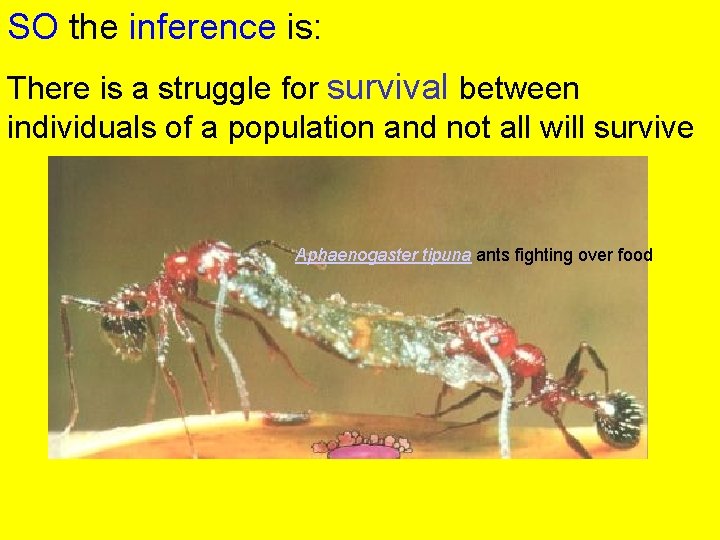
SO the inference is: There is a struggle for survival between individuals of a population and not all will survive Aphaenogaster tipuna ants fighting over food
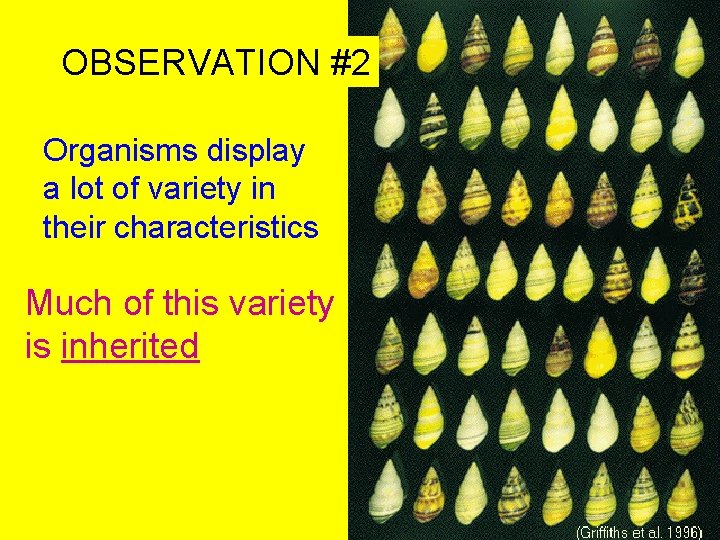
OBSERVATION #2 Organisms display a lot of variety in their characteristics Much of this variety is inherited
Inference #2: Those individuals whose inherited traits that best fit them to their particular environment will leave more offspring
Inference #3: This unequal ability of individuals to survive and reproduce will cause a gradual change in the population Favorable characteristics will accumulate in the population over time
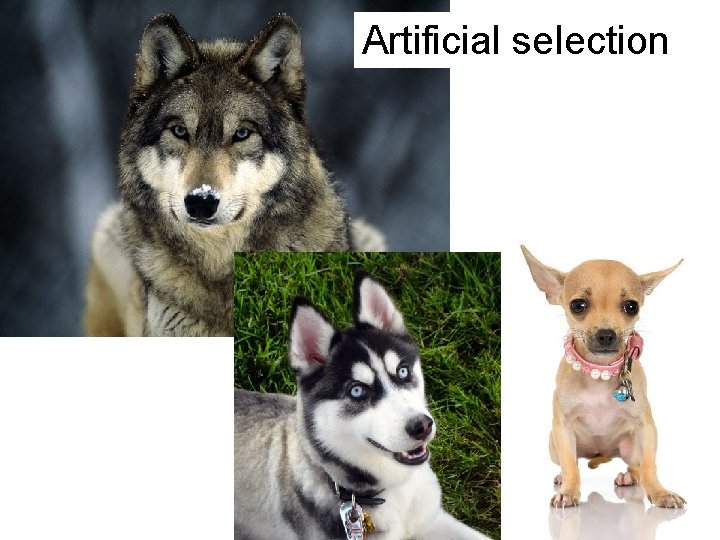
Artificial selection
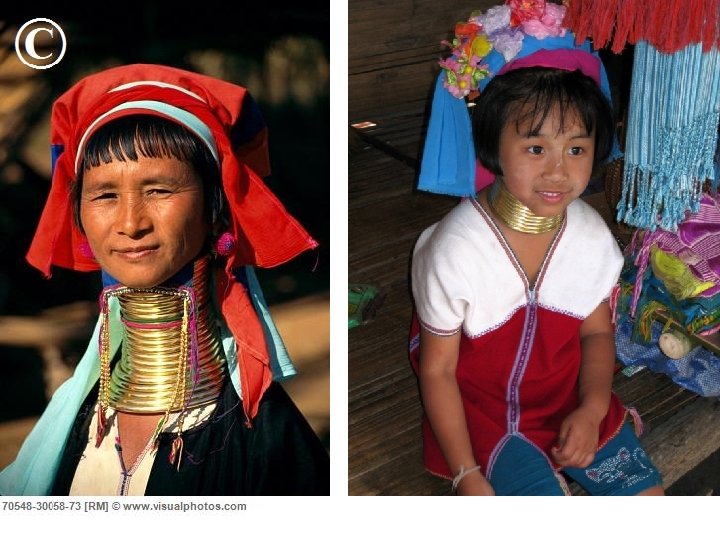
Individuals DO NOT EVOLVE. Populations evolve Evolution is not caused by a NEED of an individual. Surviving does not contribute to evolution alone. There also has to be reproduction Acquired characteristics are not passed down to the next generation. Adaptations depend on the environment
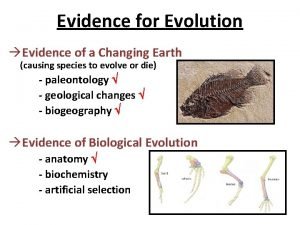
Evidence of Evolution • • • Fossil Record Biogeography Comparative anatomy Comparative embryology Molecular Biology
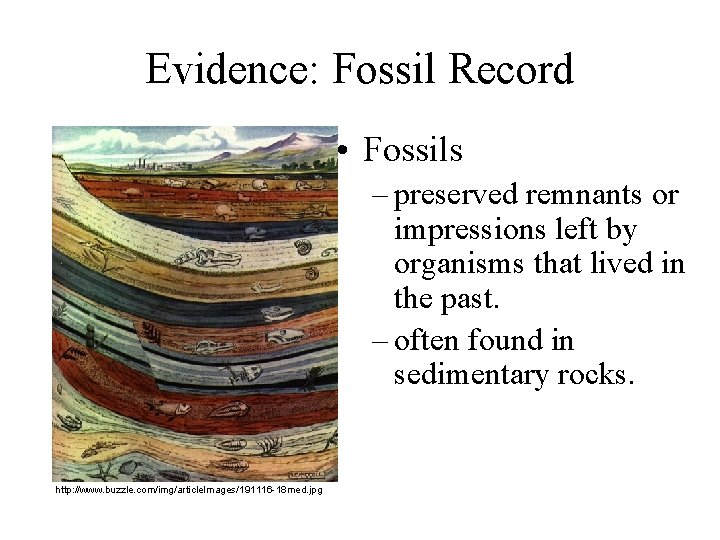
Evidence: Fossil Record • Fossils – preserved remnants or impressions left by organisms that lived in the past. – often found in sedimentary rocks. http: //www. buzzle. com/img/article. Images/191116 -18 med. jpg
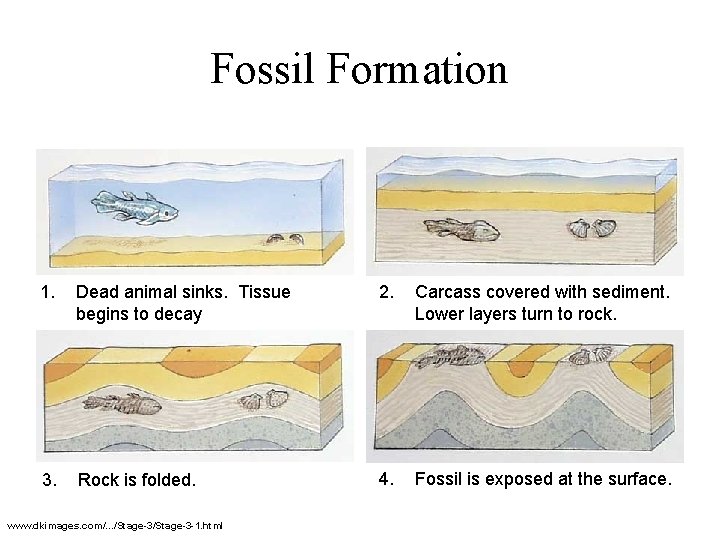
Fossil Formation 1. Dead animal sinks. Tissue begins to decay 2. Carcass covered with sediment. Lower layers turn to rock. 3. Rock is folded. 4. Fossil is exposed at the surface. www. dkimages. com/. . . /Stage-3 -1. html
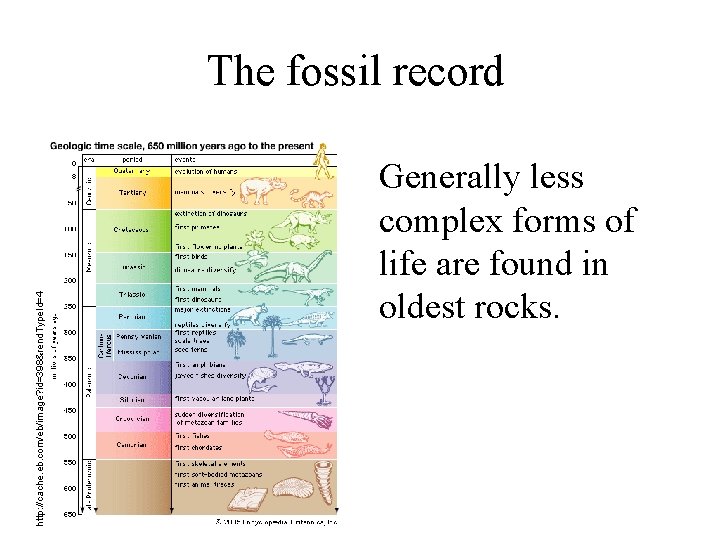
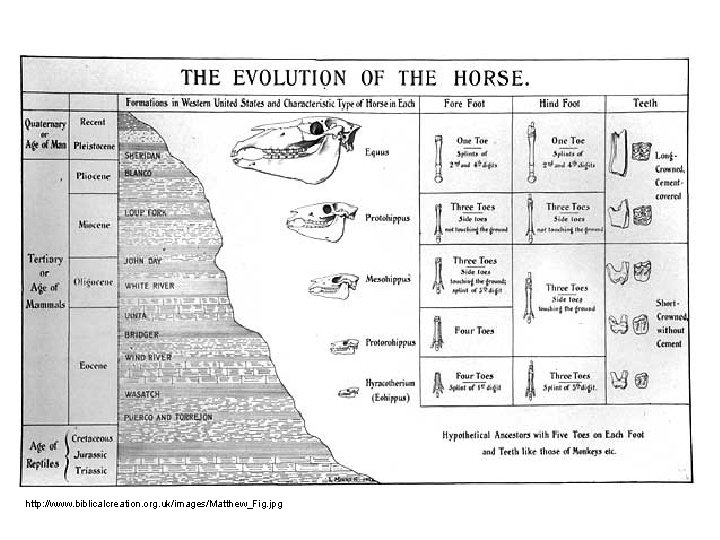
The fossil record • Is the ordered sequence of fossils as they appear in rock layers. • Reveals the appearance of organisms in a historical sequence. • Fits with other evidence of evolution.
http: //cache. eb. com/eb/image? id=398&rend. Type. Id=4 The fossil record Generally less complex forms of life are found in oldest rocks.
http: //www. biblicalcreation. org. uk/images/Matthew_Fig. jpg
Evidence: Biogeography • The geographic distribution of species • Darwin noted that Galápagos animals – Resembled species of the South American mainland more than animals on similar but distant islands
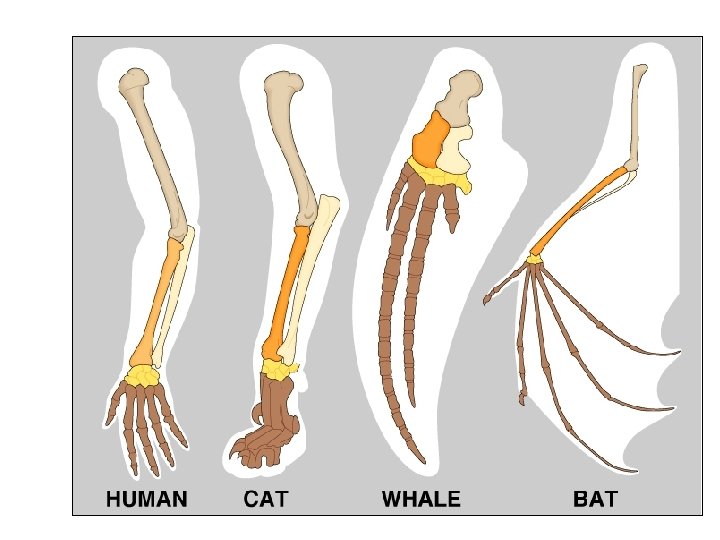
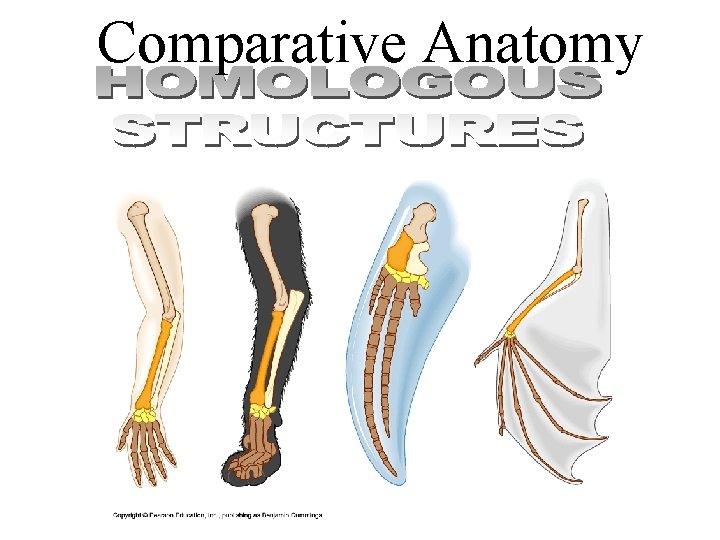
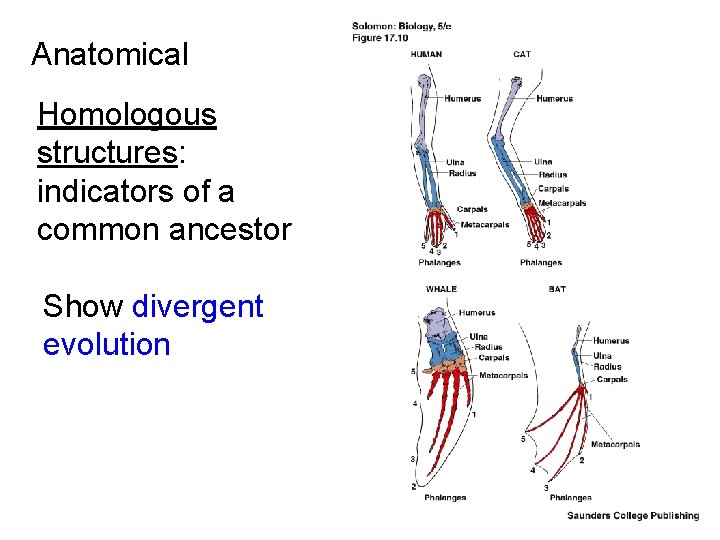
Evidence: Comparative Anatomy • Comparison of body structures between different species – Similarities give signs of common descent/common ancestor • Homologous structures—features that have similar structure but may have different functions
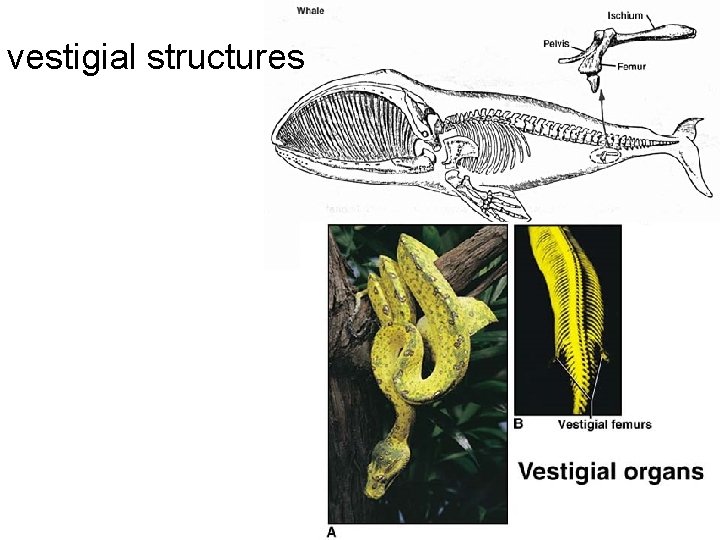
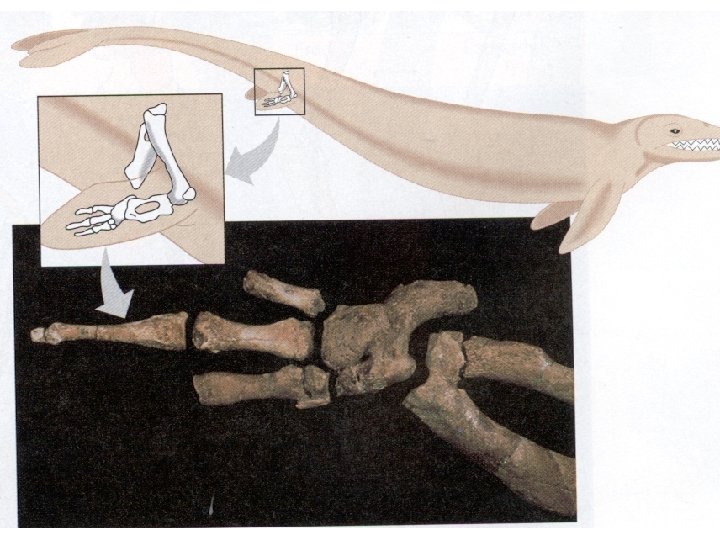
Evidence: Comparative Anatomy • Vestigial structures—Small body structures that may have been functional in the ancestors of a species, but have no or limited function at the present time
vestigial structures
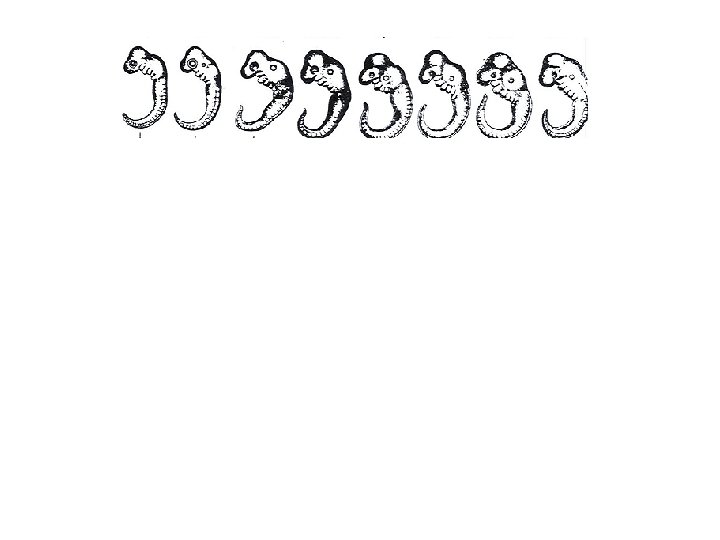
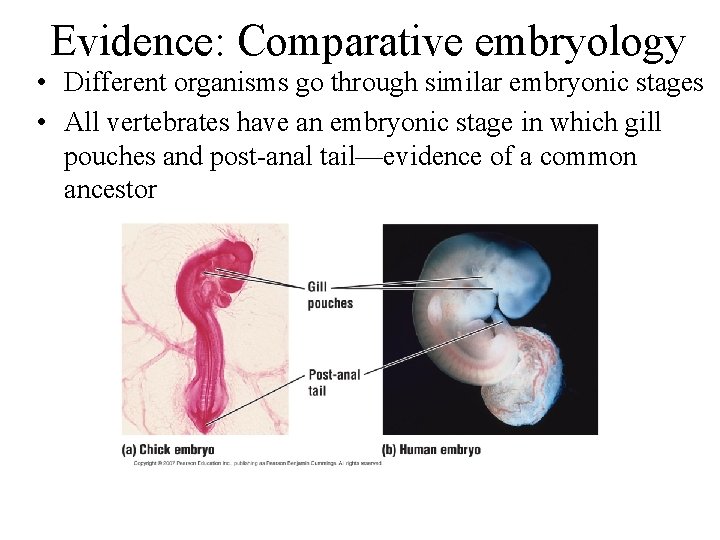
Evidence: Comparative embryology • Different organisms go through similar embryonic stages • All vertebrates have an embryonic stage in which gill pouches and post-anal tail—evidence of a common ancestor
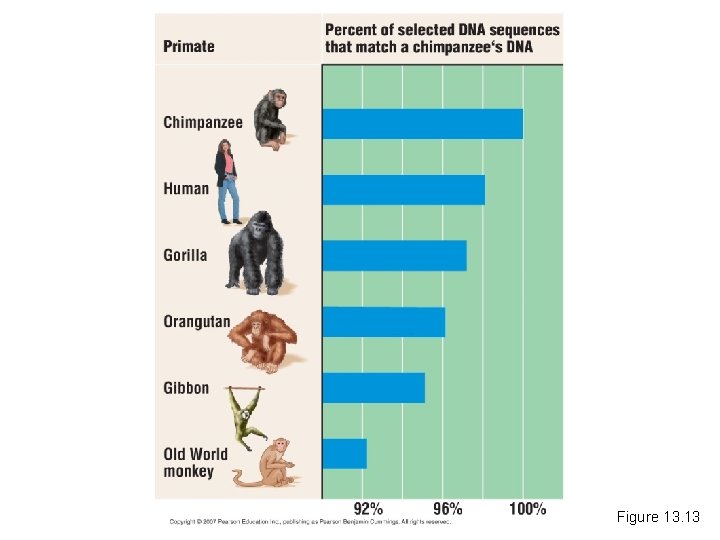
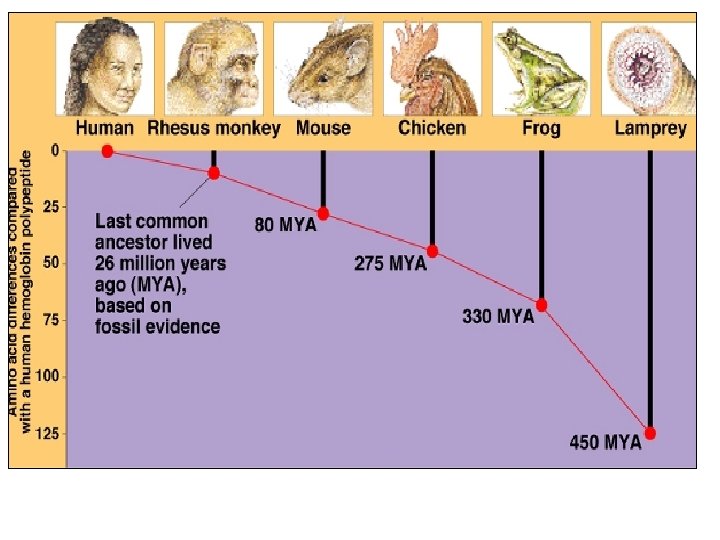
Molecular Biology • Study of molecular basis of genes • Universality of genetic code • Conservation of amino acid sequences in proteins such as hemoglobin/cytochrome C
Figure 13. 13
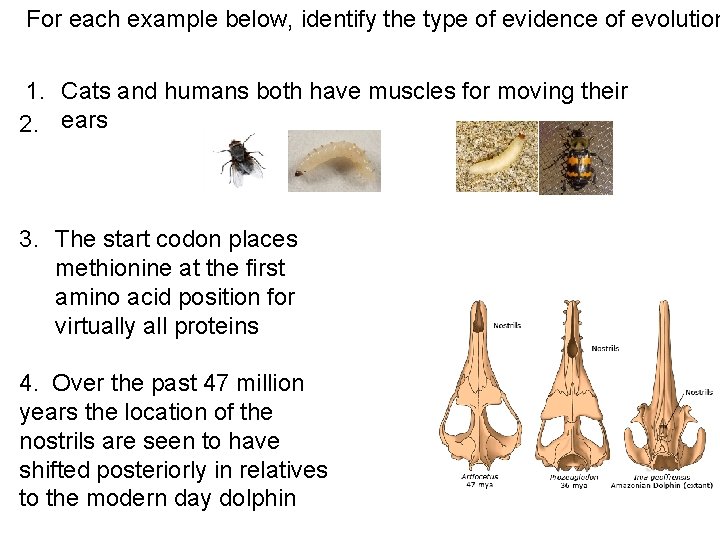
For each example below, identify the type of evidence of evolution 1. Cats and humans both have muscles for moving their 2. ears 3. The start codon places methionine at the first amino acid position for virtually all proteins 4. Over the past 47 million years the location of the nostrils are seen to have shifted posteriorly in relatives to the modern day dolphin
Generation to generation change in the frequencies of alleles in the gene pool Causes: Natural selection Genetic drift Gene flow Mutation
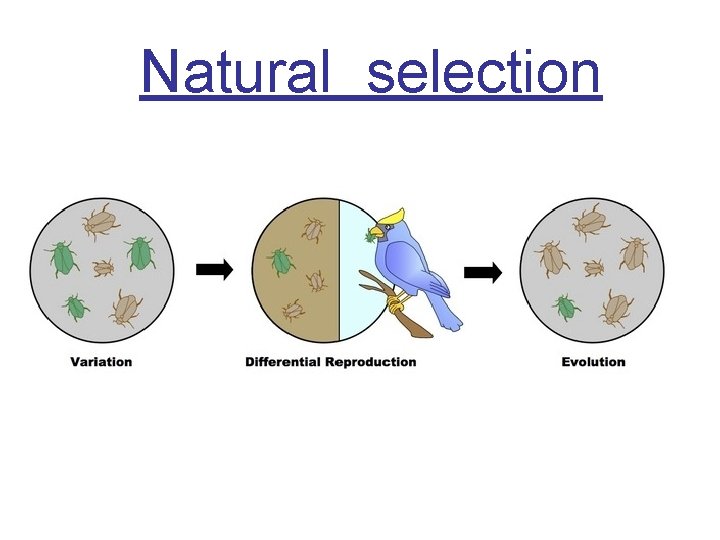
Natural selection
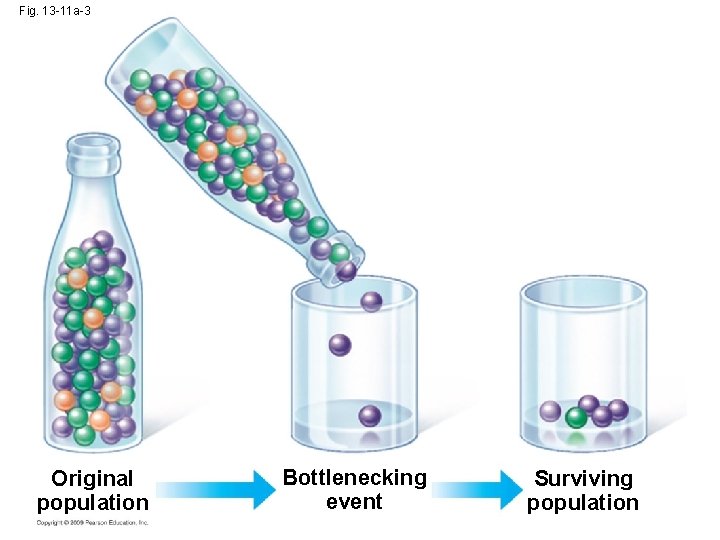
Genetic Drift: changes in allele frequencies due to chance Ex #1: Natural disaster wipes out a portion of a population
Fig. 13 -11 a-3 Original population Bottlenecking event Surviving population
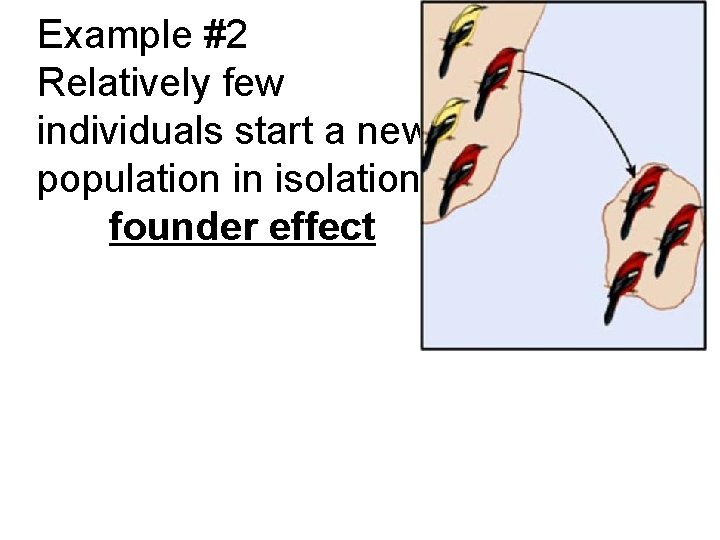
Example #2 Relatively few individuals start a new population in isolation founder effect
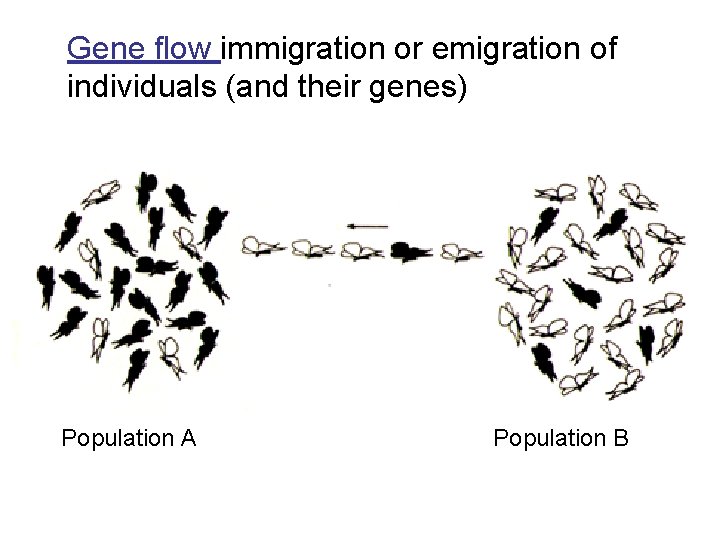
Gene flow immigration or emigration of individuals (and their genes) Population A Population B
Mutation introduces new alleles
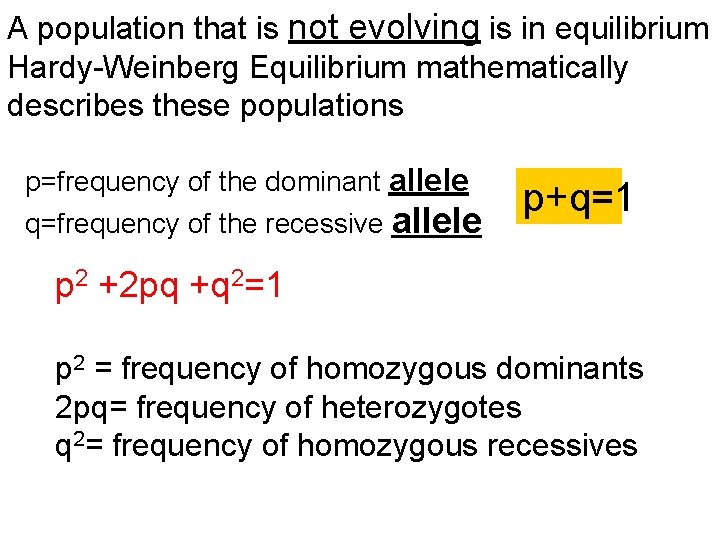
A population that is not evolving is in equilibrium Hardy-Weinberg Equilibrium mathematically describes these populations p=frequency of the dominant allele q=frequency of the recessive allele p+q=1 p 2 +2 pq +q 2=1 p 2 = frequency of homozygous dominants 2 pq= frequency of heterozygotes q 2= frequency of homozygous recessives
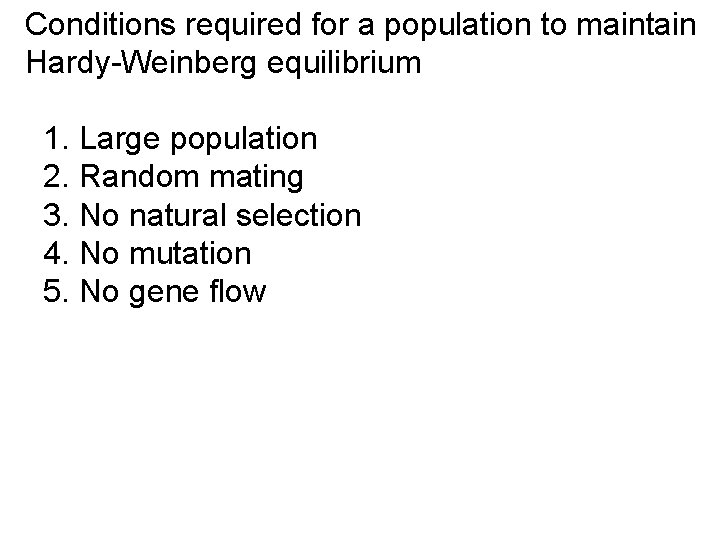
Conditions required for a population to maintain Hardy-Weinberg equilibrium 1. Large population 2. Random mating 3. No natural selection 4. No mutation 5. No gene flow
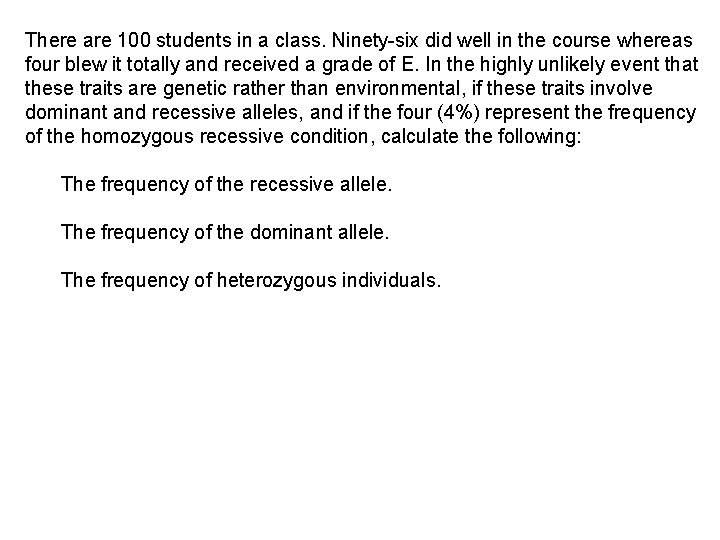
There are 100 students in a class. Ninety-six did well in the course whereas four blew it totally and received a grade of E. In the highly unlikely event that these traits are genetic rather than environmental, if these traits involve dominant and recessive alleles, and if the four (4%) represent the frequency of the homozygous recessive condition, calculate the following: The frequency of the recessive allele. The frequency of the dominant allele. The frequency of heterozygous individuals.
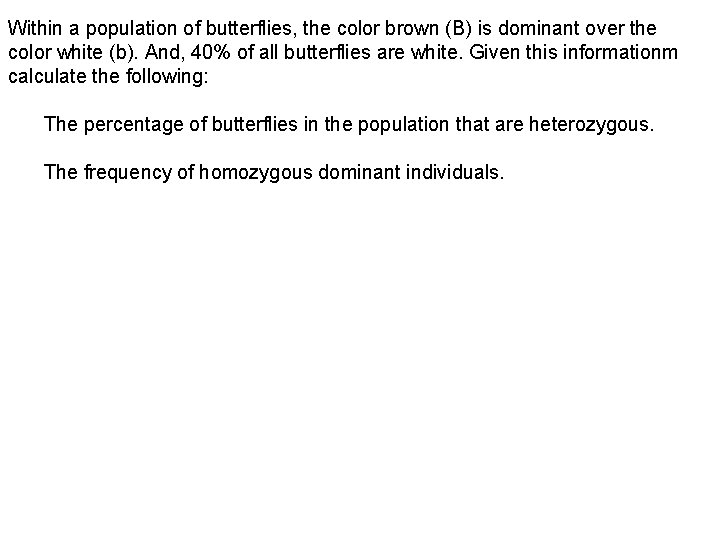
Within a population of butterflies, the color brown (B) is dominant over the color white (b). And, 40% of all butterflies are white. Given this informationm calculate the following: The percentage of butterflies in the population that are heterozygous. The frequency of homozygous dominant individuals.
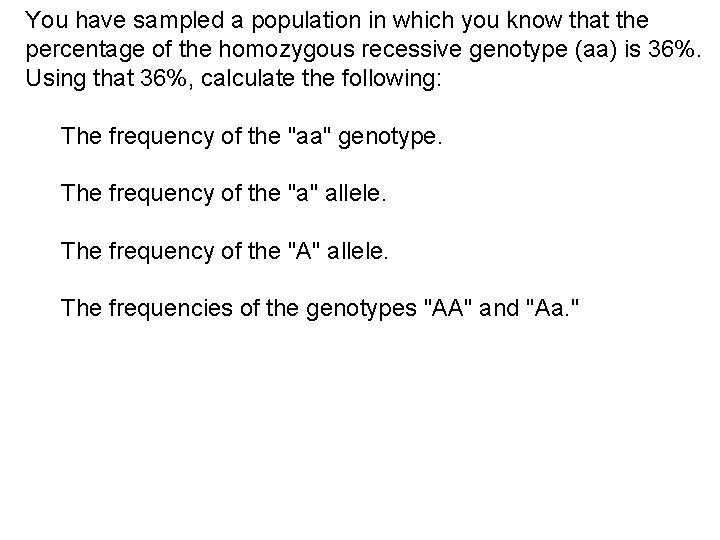
You have sampled a population in which you know that the percentage of the homozygous recessive genotype (aa) is 36%. Using that 36%, calculate the following: The frequency of the "aa" genotype. The frequency of the "a" allele. The frequency of the "A" allele. The frequencies of the genotypes "AA" and "Aa. "
Comparative Anatomy
Anatomical Homologous structures: indicators of a common ancestor Show divergent evolution
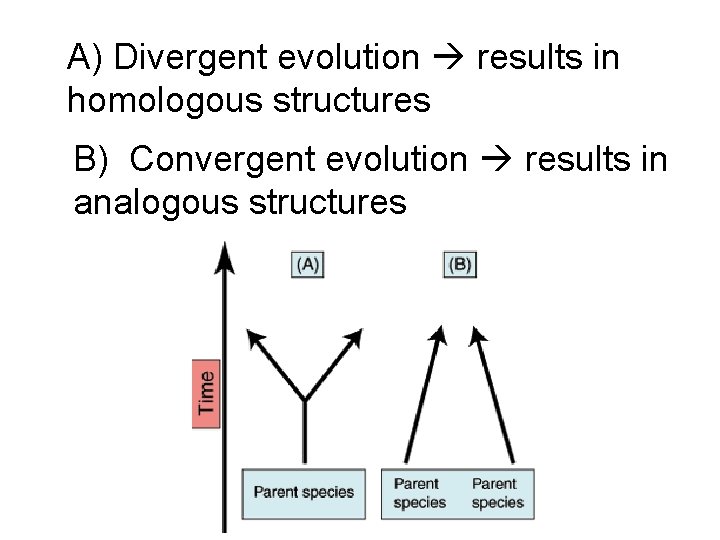
A) Divergent evolution results in homologous structures B) Convergent evolution results in analogous structures
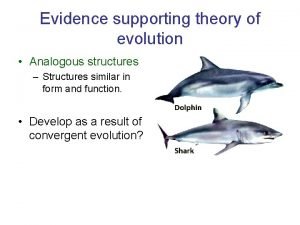
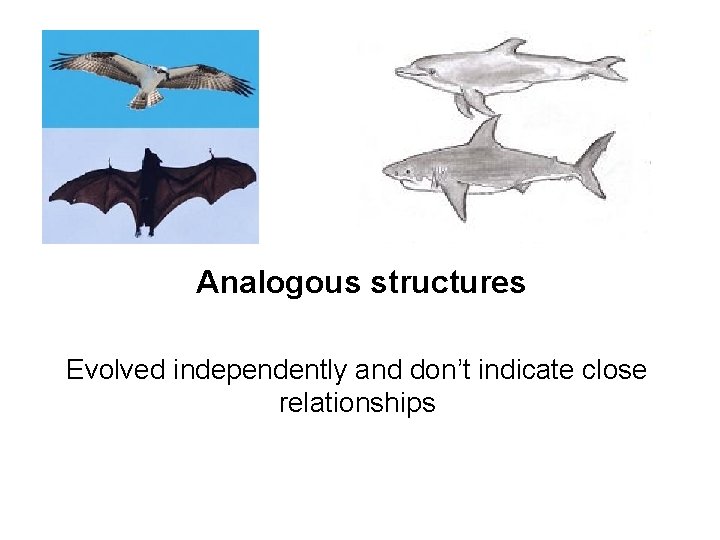
Analogous structures Evolved independently and don’t indicate close relationships
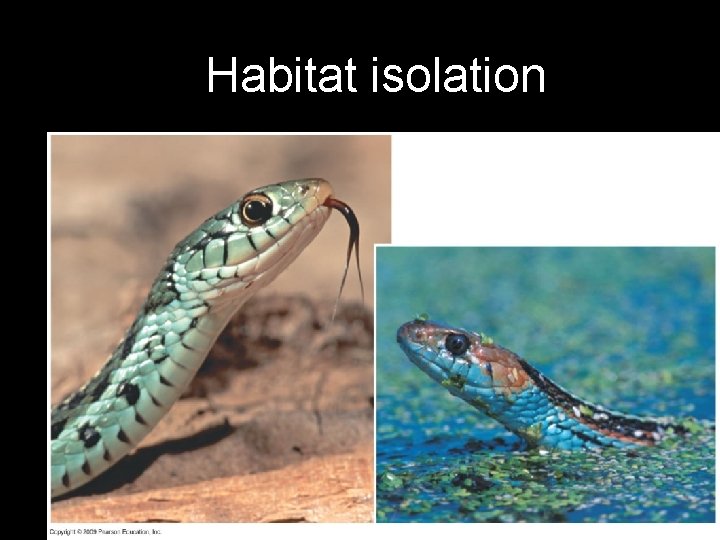
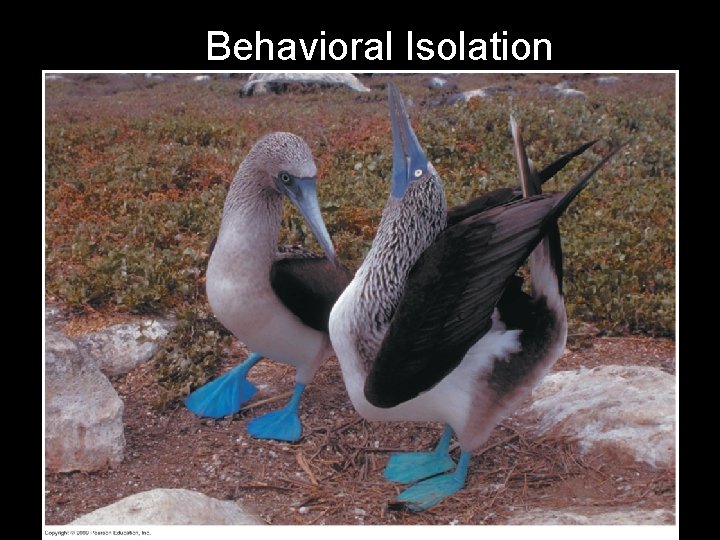
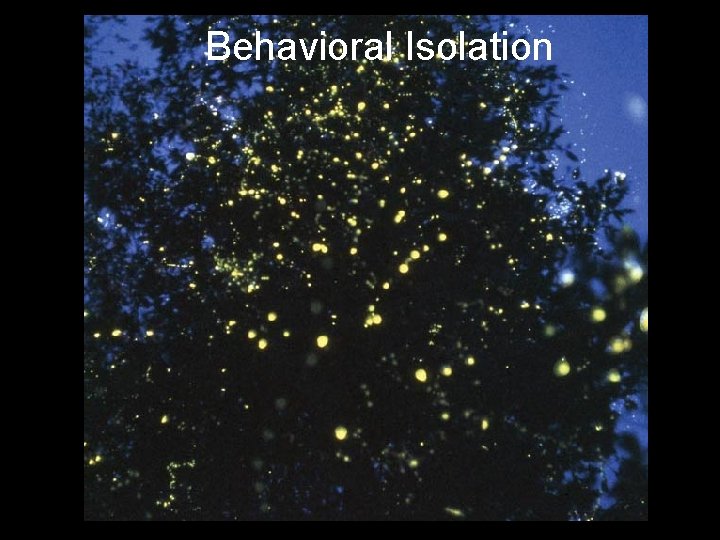
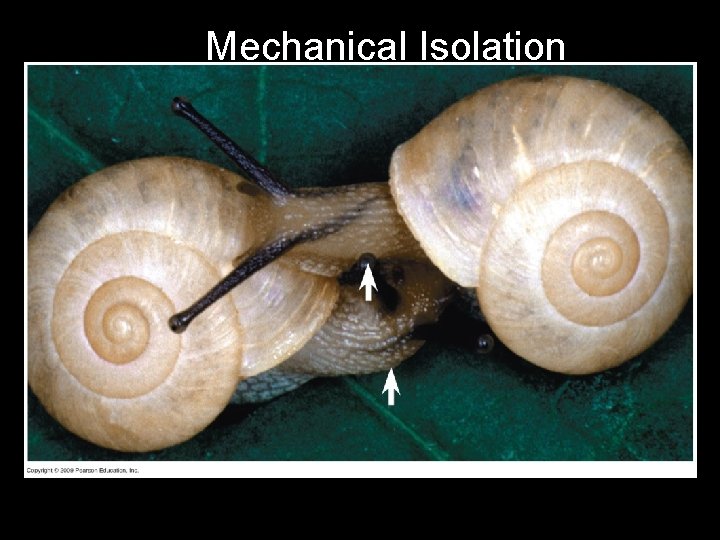
Population or group of populations that have the potential to interbreed with each other in nature and produce viable offspring Key idea: reproductive isolation
Fig. 14 -3 a Habitat isolation
Fig. 14 -3 b Behavioral Isolation
Behavioral Isolation
Fig. 14 -3 c Mechanical Isolation
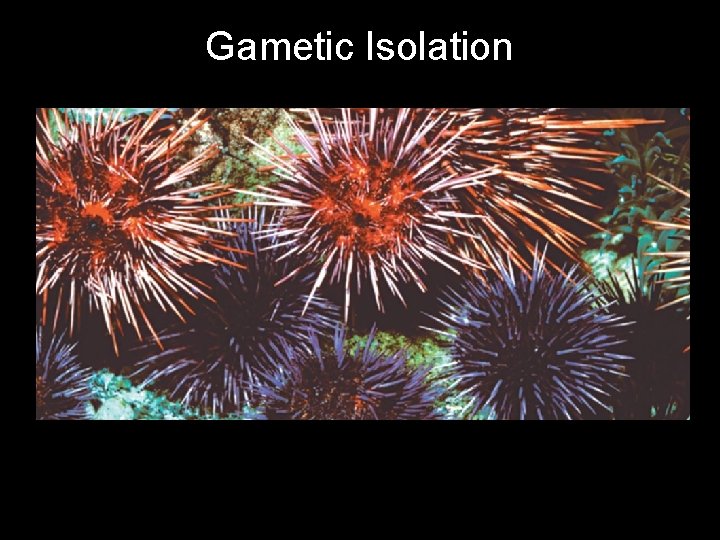
Fig. 14 -3 d Gametic Isolation
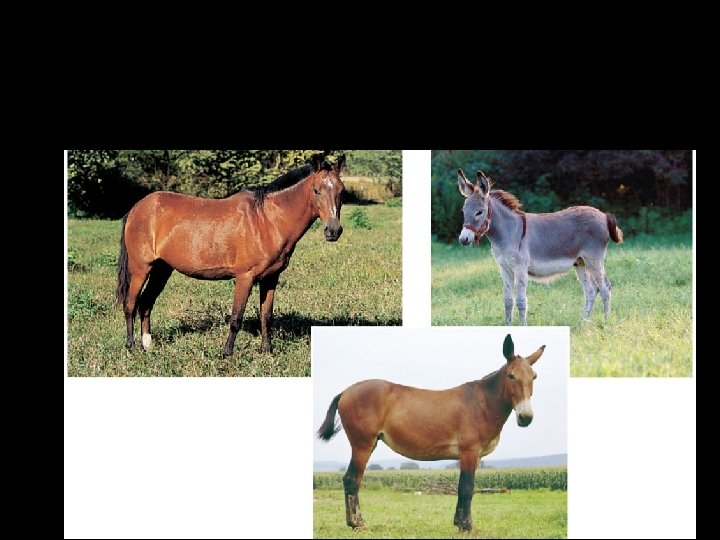
Fig. 14 -3 e
National Geographic http: //www. youtube. com/watch? v=1 z. OWYj 59 BXI
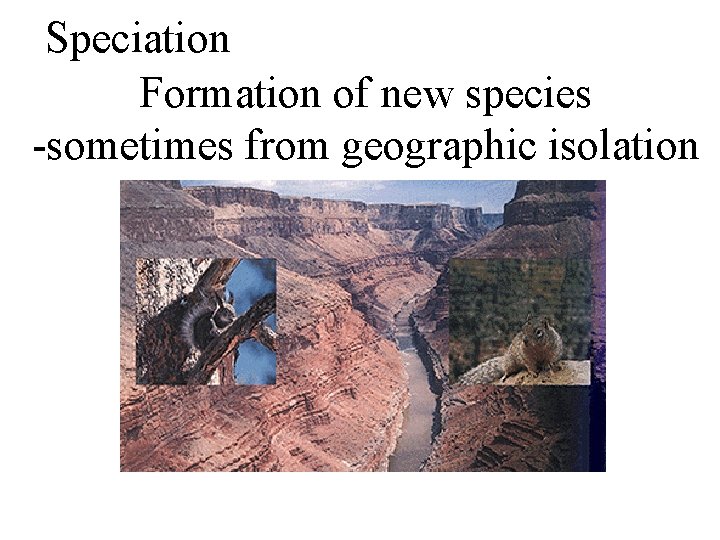
Speciation Formation of new species -sometimes from geographic isolation
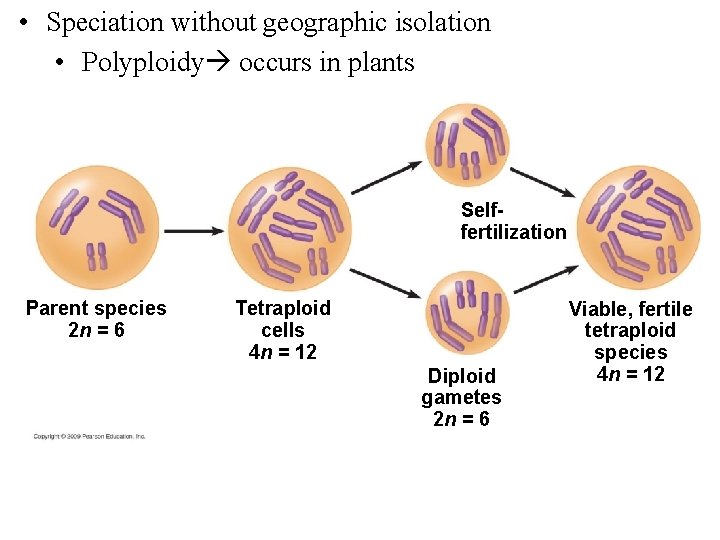
• Speciation without geographic isolation • Polyploidy occurs in plants 3 2 Selffertilization Parent species 2 n = 6 Tetraploid cells 4 n = 12 Diploid gametes 2 n = 6 Viable, fertile tetraploid species 4 n = 12
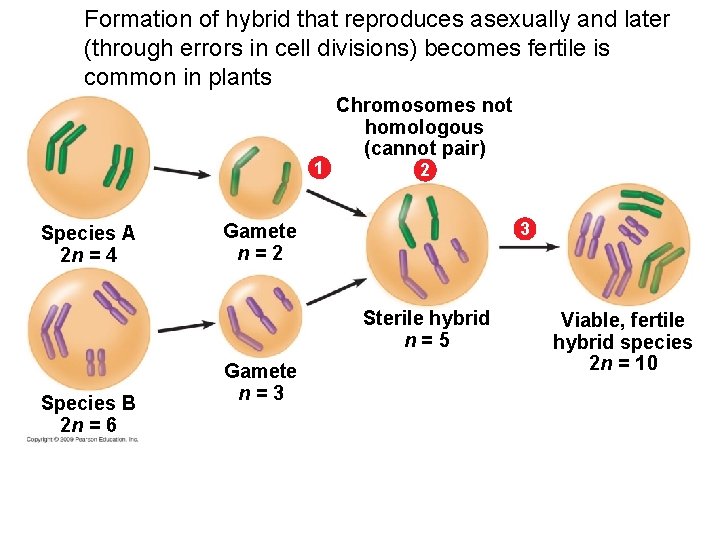
Formation of hybrid that reproduces asexually and later (through errors in cell divisions) becomes fertile is common in plants 1 Species A 2 n = 4 Chromosomes not homologous (cannot pair) 2 3 Gamete n=2 Sterile hybrid n=5 Species B 2 n = 6 Gamete n=3 Viable, fertile hybrid species 2 n = 10
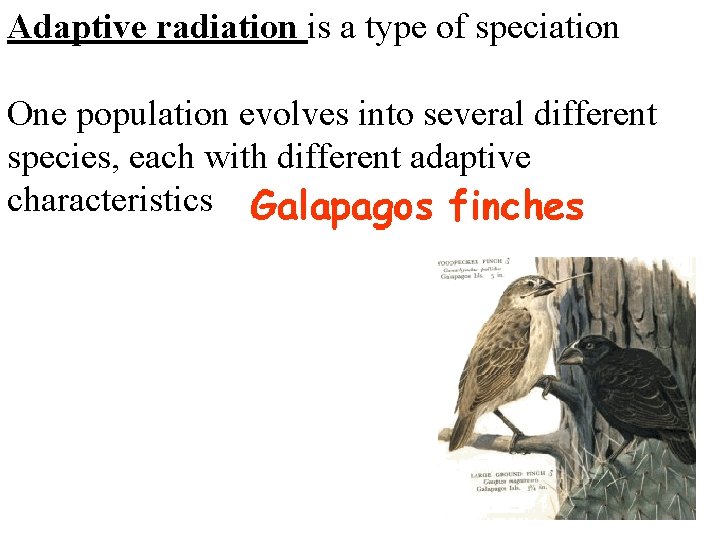
Adaptive radiation is a type of speciation One population evolves into several different species, each with different adaptive characteristics
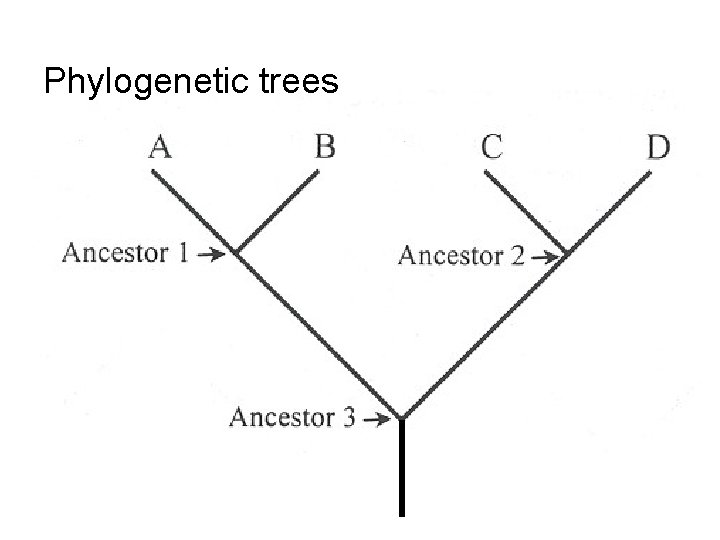
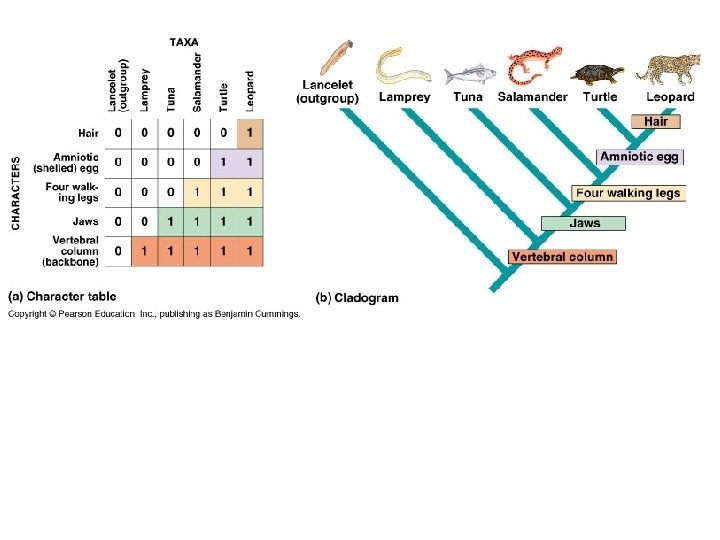
Phylogenetic trees
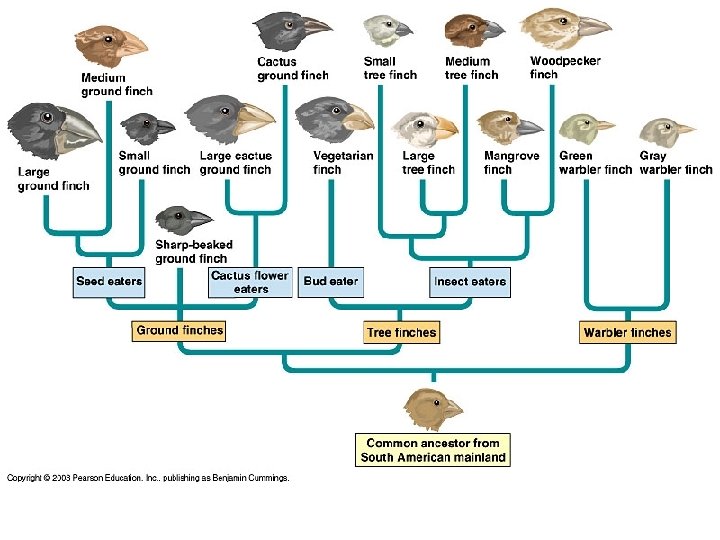
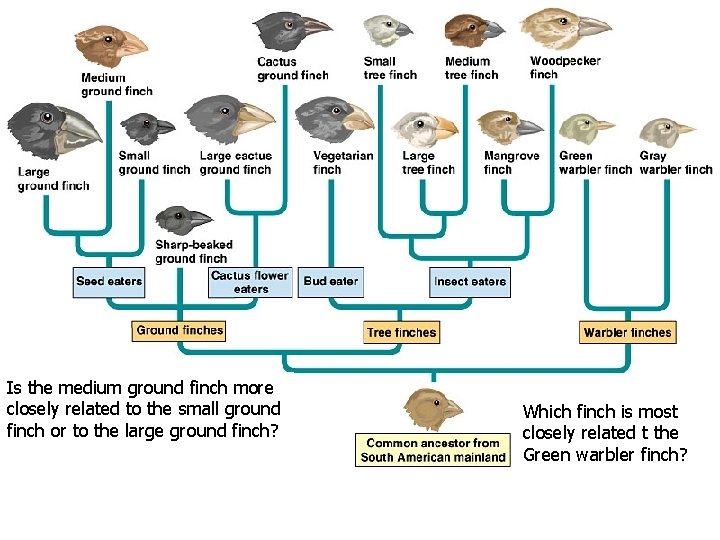
Cactus ground finch Medium ground finch Large ground finch Small Large cactus ground finch Sharp-beaked ground finch Seed eaters Cactus flower eaters Ground finches Is the medium ground finch more closely related to the small ground finch or to the large ground finch? Small tree finch Vegetarian finch Medium tree finch Large tree finch Bud eaters Woodpecker finch Mangrove finch Green warbler finch Insect eaters Tree finches Warbler finches Which finch is most closely related t the Green warbler finch?
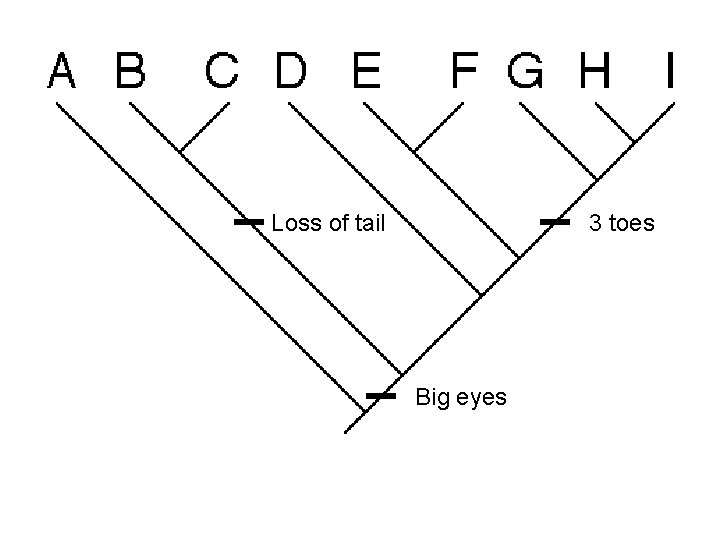
Loss of tail 3 toes Big eyes
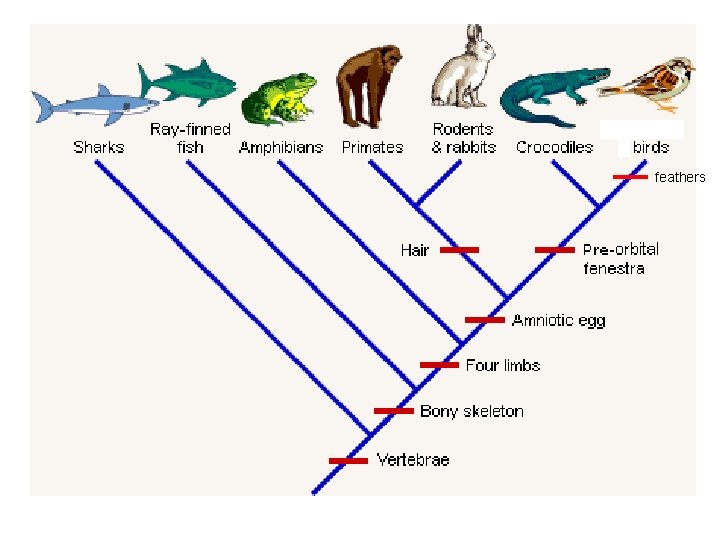
feathers
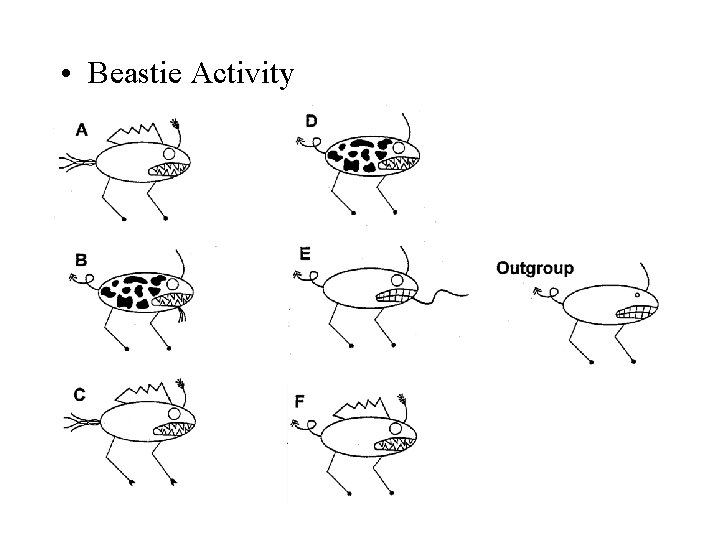
• Beastie Activity
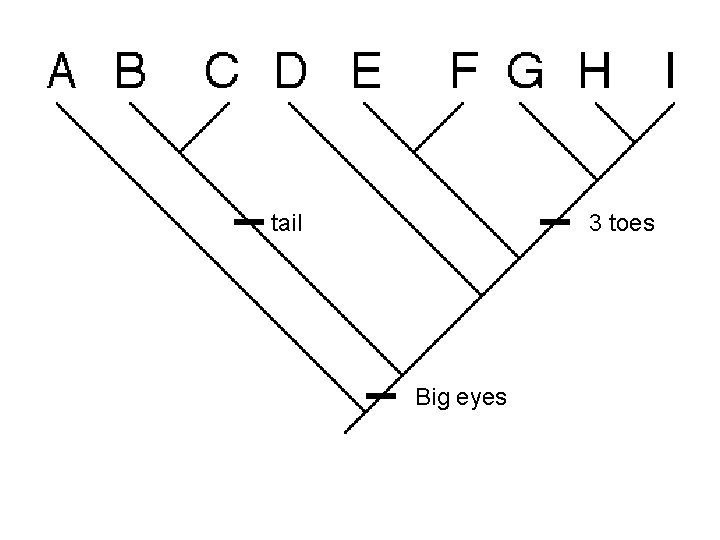
tail 3 toes Big eyes
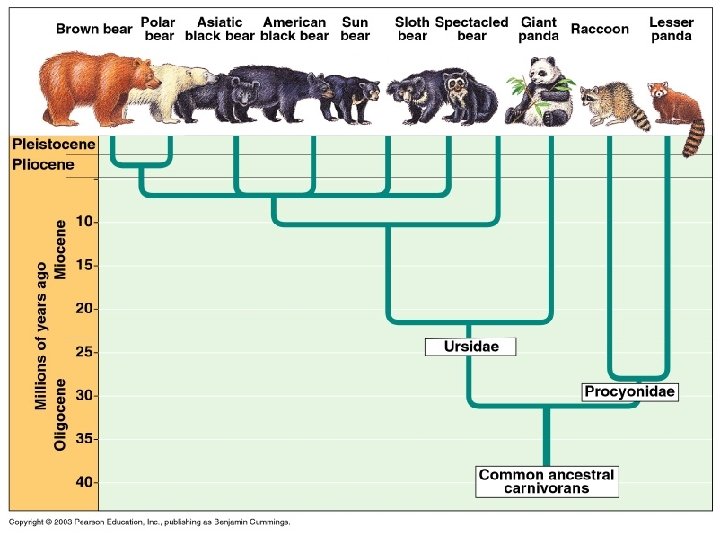
Brown bear Polar bear Asiatic black bear American black bear Sun bear Sloth bear Spectacled Giant panda bear Lesser Raccoon panda Miocene Pleistocene Pliocene Oligocene Ursidae Procyonidae Common ancestral carnivorans Figure 15. 12 A
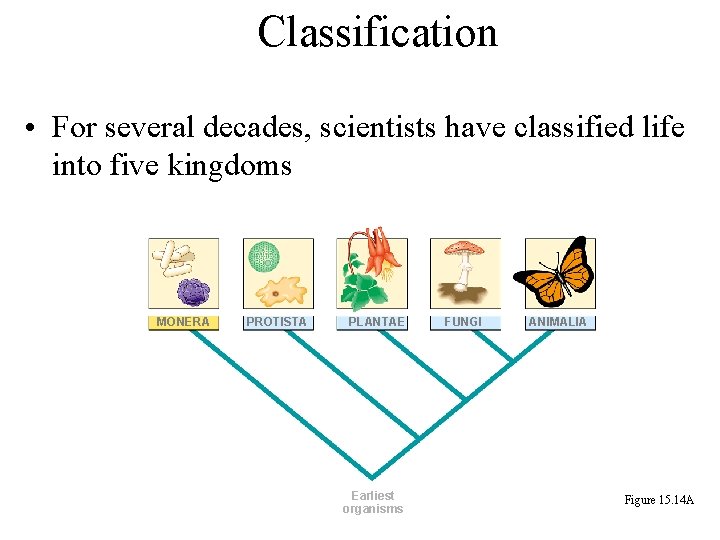
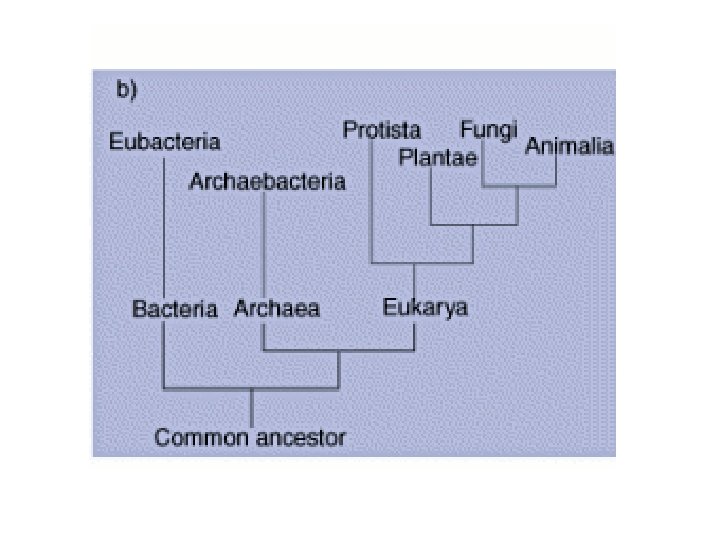
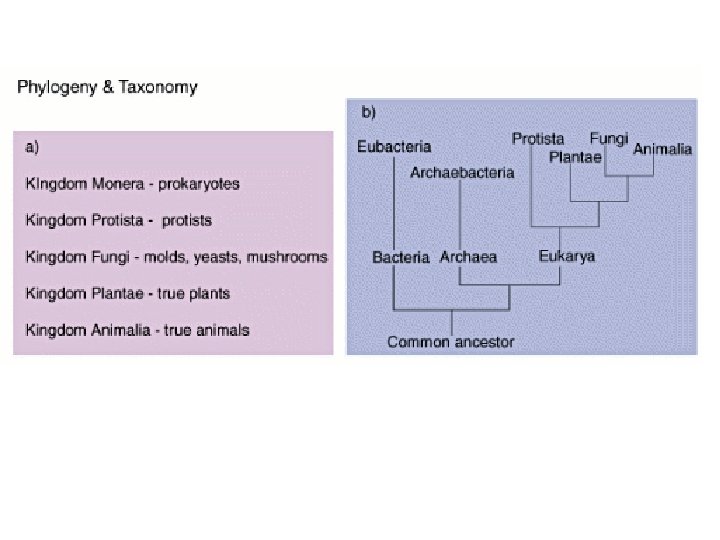
Classification • For several decades, scientists have classified life into five kingdoms MONERA PROTISTA PLANTAE Earliest organisms FUNGI ANIMALIA Figure 15. 14 A
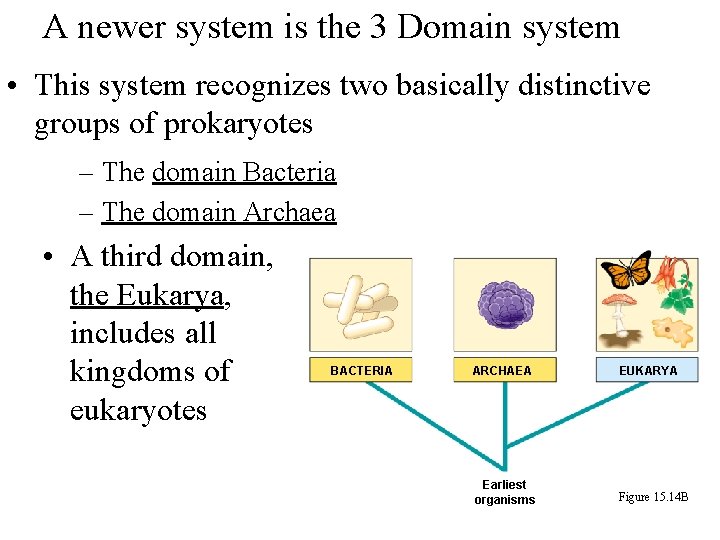
A newer system is the 3 Domain system • This system recognizes two basically distinctive groups of prokaryotes – The domain Bacteria – The domain Archaea • A third domain, the Eukarya, includes all kingdoms of eukaryotes BACTERIA ARCHAEA EUKARYA Earliest organisms Figure 15. 14 B
• Organisms are grouped into progressively larger categories (taxons) Table 15. 10
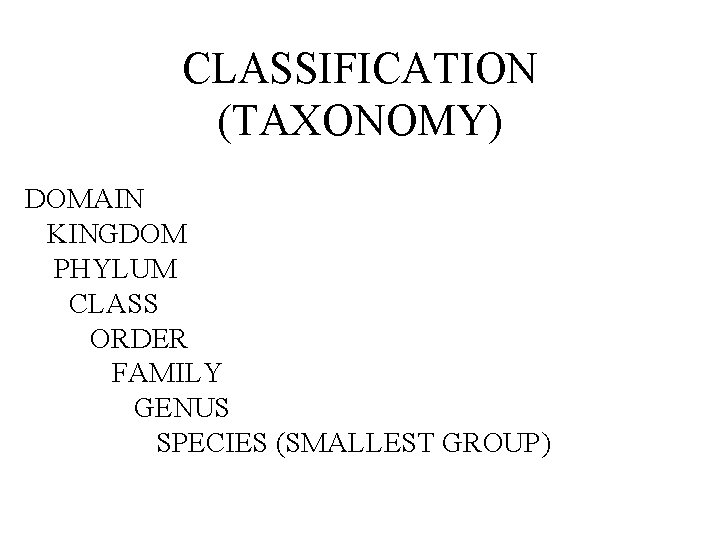
CLASSIFICATION (TAXONOMY) DOMAIN KINGDOM PHYLUM CLASS ORDER FAMILY GENUS SPECIES (SMALLEST GROUP)
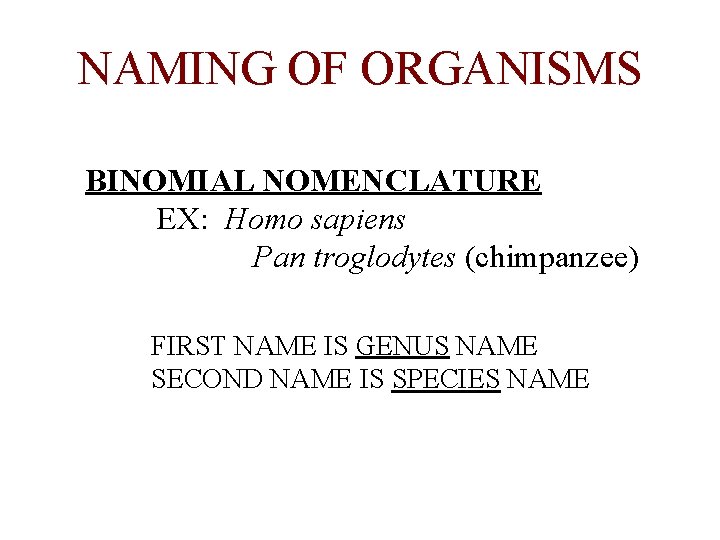
NAMING OF ORGANISMS BINOMIAL NOMENCLATURE EX: Homo sapiens Pan troglodytes (chimpanzee) FIRST NAME IS GENUS NAME SECOND NAME IS SPECIES NAME
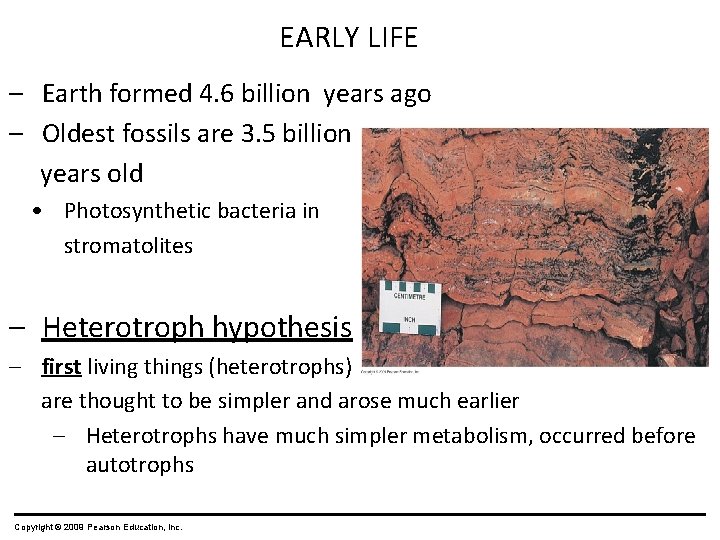
EARLY LIFE – Earth formed 4. 6 billion years ago – Oldest fossils are 3. 5 billion years old • Photosynthetic bacteria in stromatolites – Heterotroph hypothesis – first living things (heterotrophs) are thought to be simpler and arose much earlier – Heterotrophs have much simpler metabolism, occurred before autotrophs Copyright © 2009 Pearson Education, Inc.
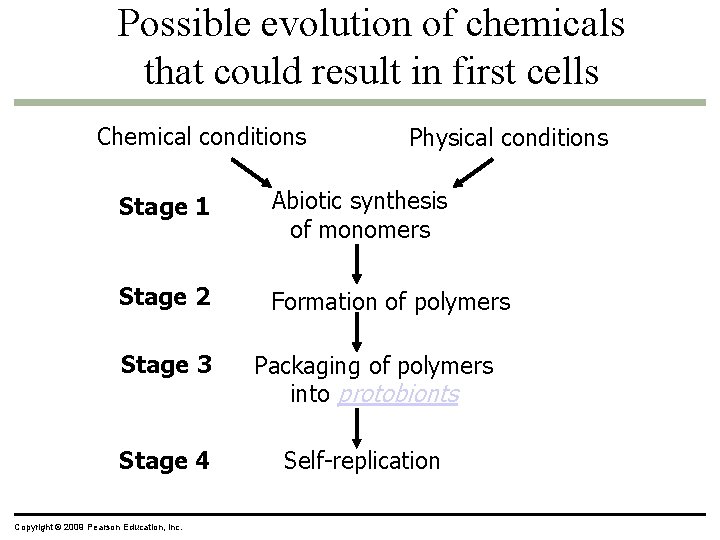
Possible evolution of chemicals that could result in first cells Chemical conditions Physical conditions Stage 1 Abiotic synthesis of monomers Stage 2 Formation of polymers Stage 3 Stage 4 Copyright © 2009 Pearson Education, Inc. Packaging of polymers into protobionts Self-replication
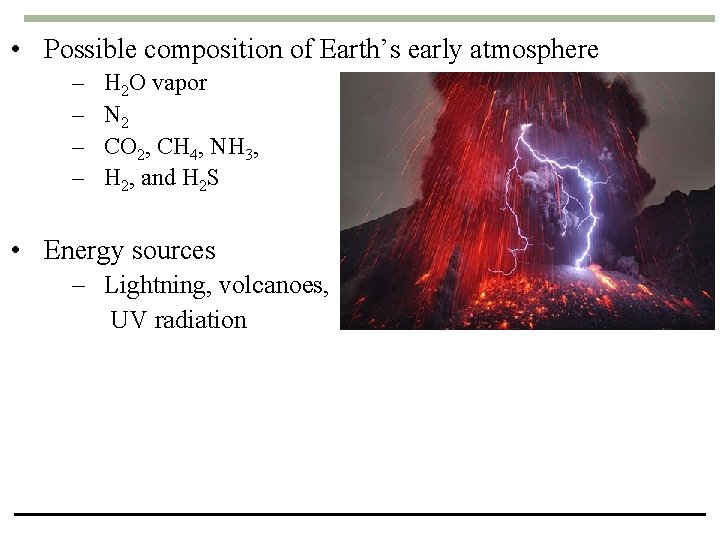
• Possible composition of Earth’s early atmosphere – – H 2 O vapor N 2 CO 2, CH 4, NH 3, H 2, and H 2 S • Energy sources – Lightning, volcanoes, UV radiation
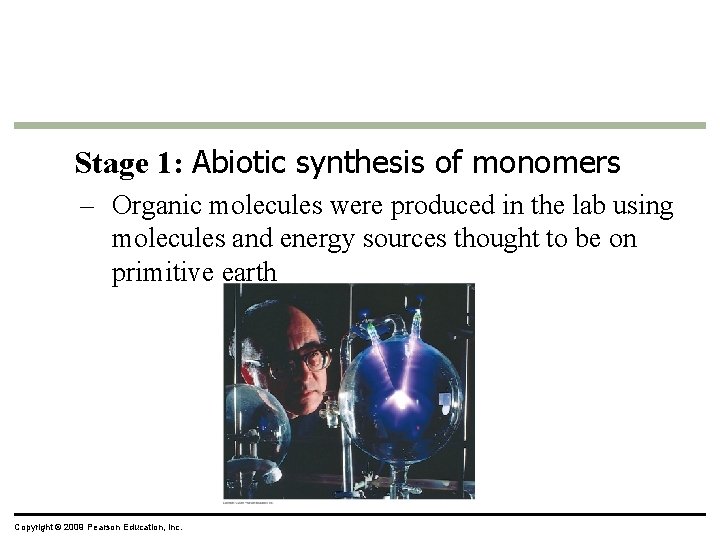
Stage 1: Abiotic synthesis of monomers – Organic molecules were produced in the lab using molecules and energy sources thought to be on primitive earth Copyright © 2009 Pearson Education, Inc.
• Stage 2: The formation of polymers – Monomers could have combined to form organic polymers – Same energy sources Copyright © 2009 Pearson Education, Inc.
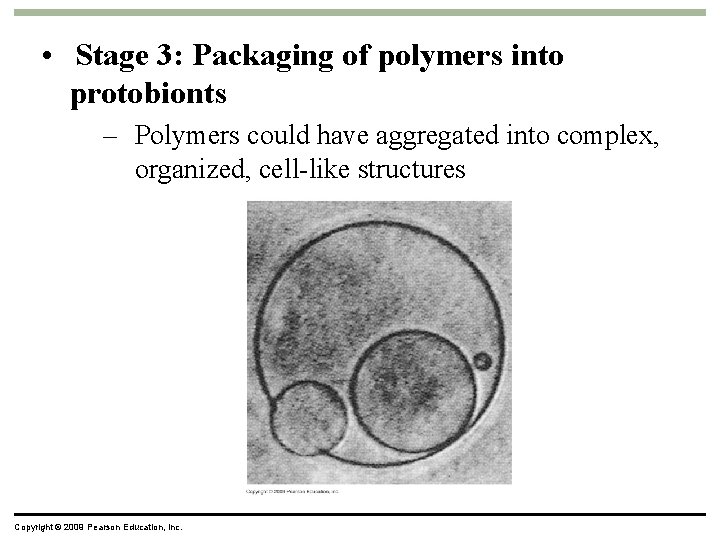
• Stage 3: Packaging of polymers into protobionts – Polymers could have aggregated into complex, organized, cell-like structures Copyright © 2009 Pearson Education, Inc.
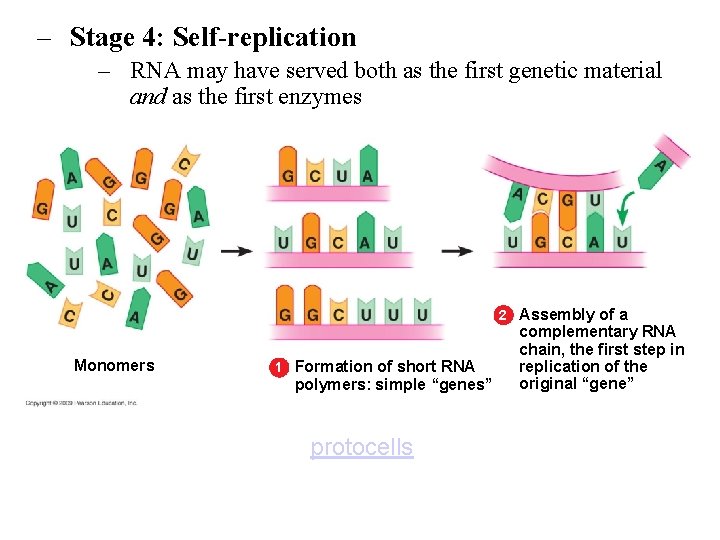
– Stage 4: Self-replication – RNA may have served both as the first genetic material and as the first enzymes 2 Assembly of a Monomers 1 Formation of short RNA polymers: simple “genes” protocells complementary RNA chain, the first step in replication of the original “gene”
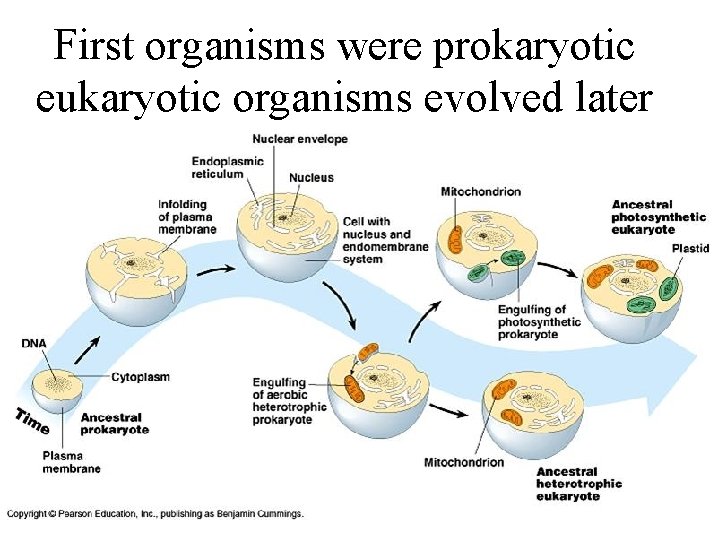
First organisms were prokaryotic eukaryotic organisms evolved later
5 KINGDOMS 1) MONERA 2) PROTISTA 3) FUNGI 4) PLANTAE 5) ANIMALIA
Wiley. CDA/Cliffs. Review. Topic/Classification-Plants-Other-Organisms. to