
Chapter 15 The Chromosomal Basis of Inheritance Overview

Chapter 15 The Chromosomal Basis of Inheritance

• Overview: Locating Genes on Chromosomes • Genes – Are located on chromosomes – Can be visualized using certain techniques Figure 15. 1

• Concept 15. 1: Mendelian inheritance has its physical basis in the behavior of chromosomes • Several researchers proposed in the early 1900 s that genes are located on chromosomes • The behavior of chromosomes during meiosis was said to account for Mendel’s laws of segregation and independent assortment
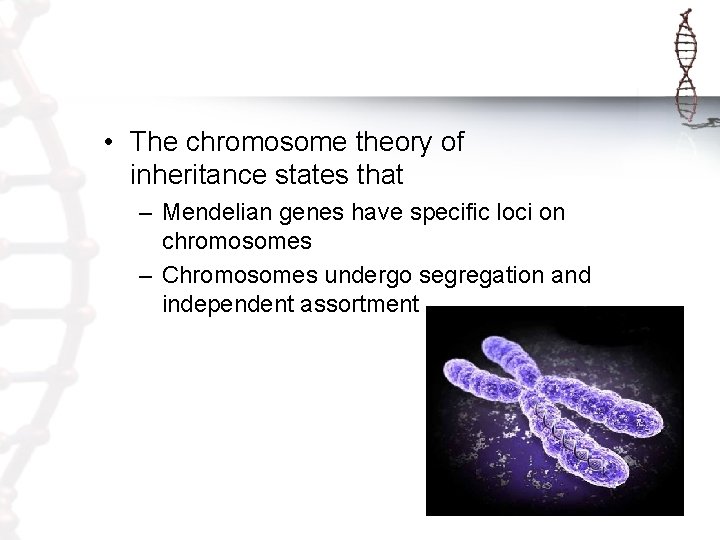
• The chromosome theory of inheritance states that – Mendelian genes have specific loci on chromosomes – Chromosomes undergo segregation and independent assortment

• The chromosomal basis of Mendel’s laws P Generation Starting with two true-breeding pea plants, we follow two genes through the F 1 and F 2 generations. The two genes specify seed color (allele Y for yellow and allele y for Y green) and seed shape (allele R for round allele r for wrinkled). These two genes are on different chromosomes. (Peas have seven chromosome pairs, but only two pairs are illustrated here. ) Yellow-round seeds (YYRR) Y R r R y r y Meiosis Fertilization y R Y Gametes Green-wrinkled seeds (yyrr) r All F 1 plants produce yellow-round seeds (Yy. Rr) R F 1 Generation R y r Y Y Meiosis LAW OF SEGREGATION r R Y 1 The R and r alleles segregate R at anaphase I, yielding Two equally probable arrangements of chromosomes at metaphase I y y r y Y r R 1 Alleles at both loci segregate in anaphase I, yielding four types of daughter cells R depending on the chromosome arrangement at metaphase I. Compare the arrangement of y the R and r alleles in the cells on the left and right r R y y Metaphase II Y y Y Y Y R R r Y r r 1 yr 4 F 2 Generation 3 Fertilization recombines the R and r alleles at random. Y Y r 1 YR 4 Figure 15. 2 Y LAW OF INDEPENDENT ASSORTMENT Anaphase I Y Gametes R r two types of daughter cells for this locus. 2 Each gamete gets one long chromosome with either the R or r allele. r 1 yr 4 2 Each gamete gets a long and a short chromosome in one of four allele combinations. y y R R 1 y. R 4 Fertilization among the F 1 plants 9 : 3 : 1 3 Fertilization results in the 9: 3: 3: 1 phenotypic ratio in the F 2 generation.

Morgan’s Experimental Evidence: Scientific Inquiry • Thomas Hunt Morgan – Provided convincing evidence that chromosomes are the location of Mendel’s heritable factors

Morgan’s Choice of Experimental Organism • Morgan worked with fruit flies – Because they breed at a high rate – A new generation can be bred every two weeks – They have only four pairs of chromosomes
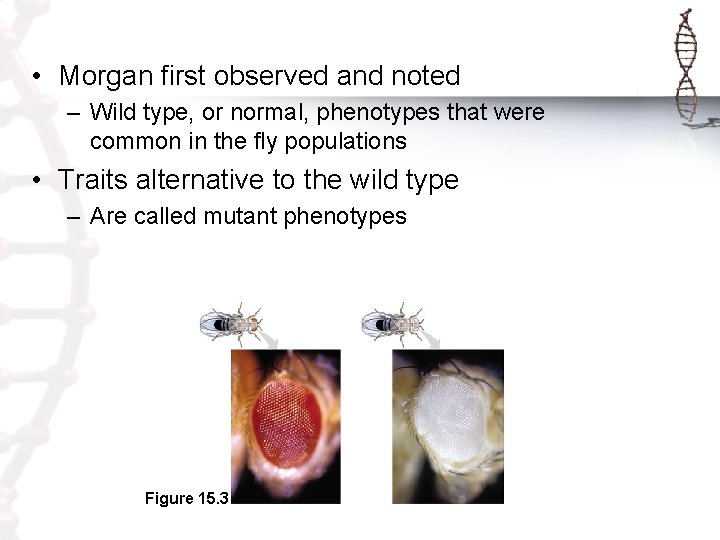
• Morgan first observed and noted – Wild type, or normal, phenotypes that were common in the fly populations • Traits alternative to the wild type – Are called mutant phenotypes Figure 15. 3

Correlating Behavior of a Gene’s Alleles with Behavior of a Chromosome Pair • In one experiment Morgan mated male flies with white eyes (mutant) with female flies with red eyes (wild type) – The F 1 generation all had red eyes – The F 2 generation showed the 3: 1 red: white eye ratio, but only males had white eyes Copyright © 2005 Pearson Education, Inc. publishing as Benjamin Cummings
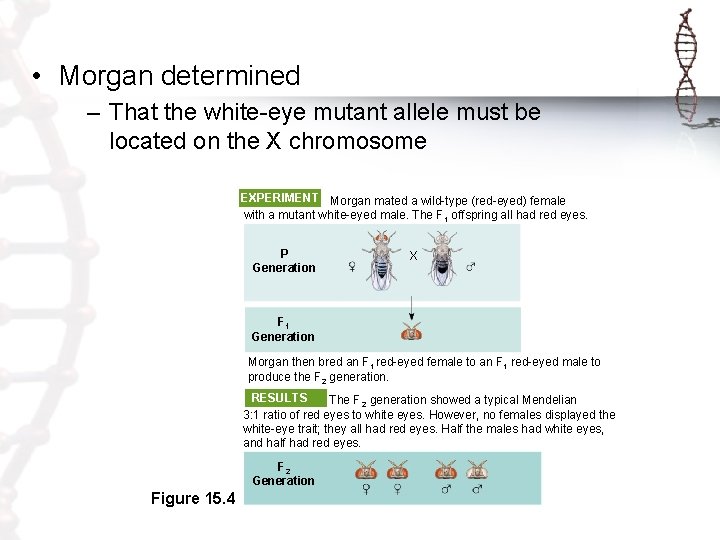
• Morgan determined – That the white-eye mutant allele must be located on the X chromosome EXPERIMENT Morgan mated a wild-type (red-eyed) female with a mutant white-eyed male. The F 1 offspring all had red eyes. P Generation X F 1 Generation Morgan then bred an F 1 red-eyed female to an F 1 red-eyed male to produce the F 2 generation. RESULTS The F 2 generation showed a typical Mendelian 3: 1 ratio of red eyes to white eyes. However, no females displayed the white-eye trait; they all had red eyes. Half the males had white eyes, and half had red eyes. F 2 Generation Figure 15. 4
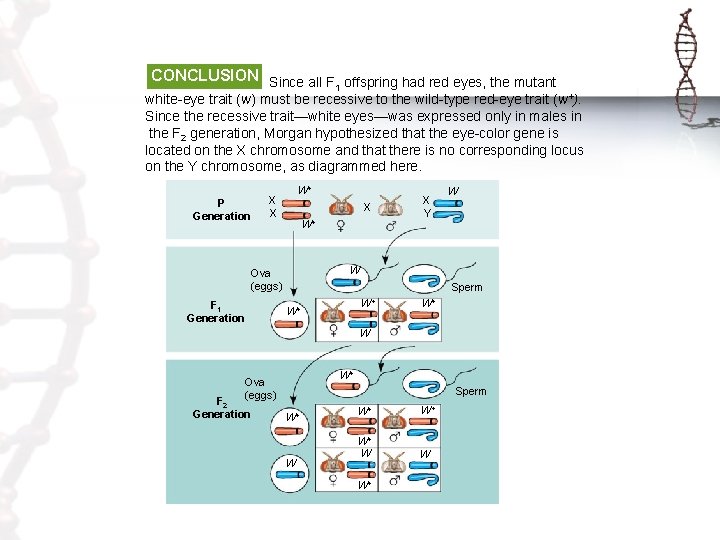
CONCLUSION Since all F 1 offspring had red eyes, the mutant white-eye trait (w) must be recessive to the wild-type red-eye trait (w+). Since the recessive trait—white eyes—was expressed only in males in the F 2 generation, Morgan hypothesized that the eye-color gene is located on the X chromosome and that there is no corresponding locus on the Y chromosome, as diagrammed here. P Generation X X W+ W+ W W Ova (eggs) F 1 Generation X X Y Sperm W+ W W+ Ova (eggs) F 2 Generation Sperm W+ W+ W+ W W W+

• Morgan’s discovery that transmission of the X chromosome in fruit flies correlates with inheritance of the eye-color trait – Was the first solid evidence indicating that a specific gene is associated with a specific chromosome
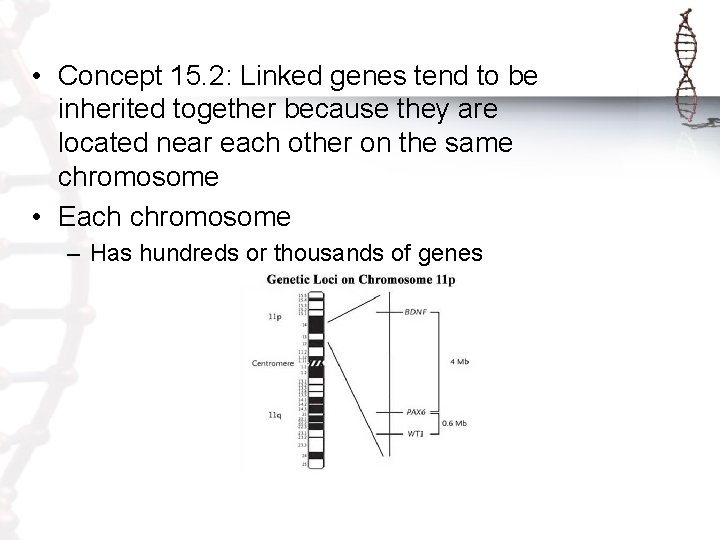
• Concept 15. 2: Linked genes tend to be inherited together because they are located near each other on the same chromosome • Each chromosome – Has hundreds or thousands of genes

How Linkage Affects Inheritance: Scientific Inquiry • Morgan did other experiments with fruit flies – To see how linkage affects the inheritance of two different characters

• Morgan crossed flies – That differed in traits of two different characters P Generation (homozygous) EXPERIMENT Morgan first mated true-breeding x Wild type wild-type flies with black, vestigial-winged flies to produce Double mutant (gray body, heterozygous F 1 dihybrids, all of which are wild-type in (black body, normal wings) appearance. He then mated wild-type F 1 dihybrid females with vestigial wings) black, vestigial-winged males, producing 2, 300 F 2 offspring, b+ b+ vg+ which he “scored” (classified according to phenotype). Double mutant (black body, vestigial wings) b b vg vg F 1 dihybrid Double mutant TESTCROSS (wild type) (black body, x (gray body, vestigial wings) normal wings) CONCLUSION If these two genes were on different chromosomes, the alleles from the F 1 dihybrid would sort into gametes independently, and we would expect to see equal numbers of the four types of offspring. If these two genes were on the same chromosome, we would expect each allele combination, B+ vg+ and b vg, to stay together as gametes formed. In this case, only offspring with parental phenotypes would be produced. Since most offspring had a parental phenotype, Morgan concluded that the genes for body color and wing size are located on the same chromosome. However, the production of a small number of offspring with nonparental phenotypes indicated that some mechanism occasionally breaks the linkage between genes on the same chromosome. Figure 15. 5 Double mutant (black body, vestigial wings) b b vg vg b+ b vg+ vg RESULTS b vg b+vg+ b vg 965 944 Wild type Black(gray-normal) vestigial b+ vg b vg+ 206 Grayvestigial 185 Blacknormal Sperm b+ b vg+ vg b b vg vg b+ b vg vgb b vg+ vg Parental-type offspring Recombinant (nonparental-type) offspring
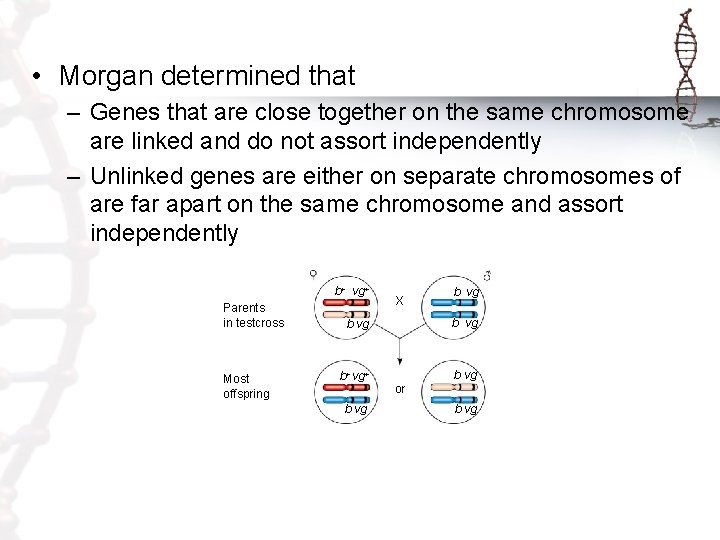
• Morgan determined that – Genes that are close together on the same chromosome are linked and do not assort independently – Unlinked genes are either on separate chromosomes of are far apart on the same chromosome and assort independently b+ vg+ Parents in testcross Most offspring X b vg b+ vg+ b vg or b vg
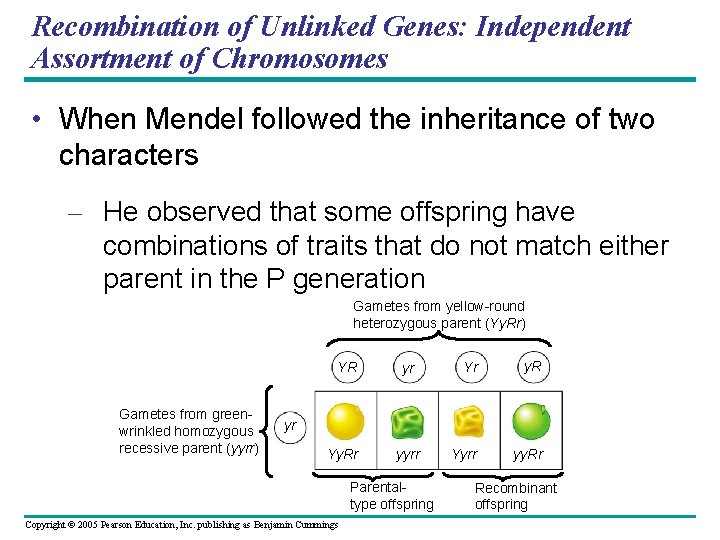
Recombination of Unlinked Genes: Independent Assortment of Chromosomes • When Mendel followed the inheritance of two characters – He observed that some offspring have combinations of traits that do not match either parent in the P generation Gametes from yellow-round heterozygous parent (Yy. Rr) YR Gametes from greenwrinkled homozygous recessive parent (yyrr) yr Yr y. R Yyrr yy. Rr yr Yy. Rr yyrr Parentaltype offspring Copyright © 2005 Pearson Education, Inc. publishing as Benjamin Cummings Recombinant offspring
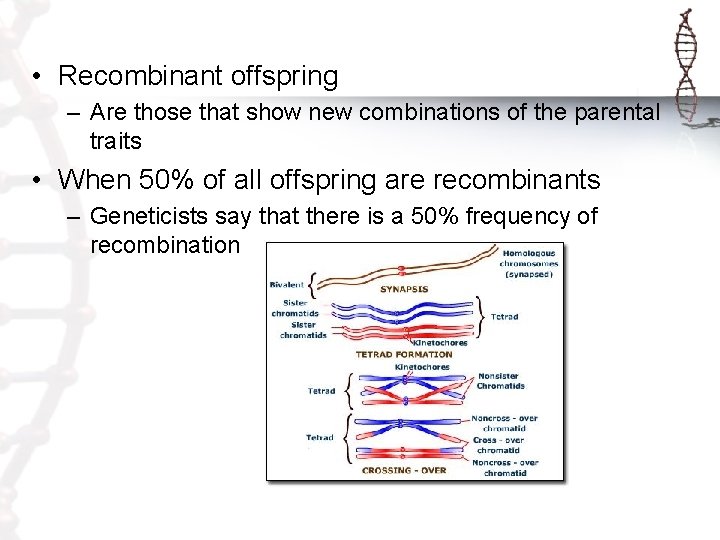
• Recombinant offspring – Are those that show new combinations of the parental traits • When 50% of all offspring are recombinants – Geneticists say that there is a 50% frequency of recombination
Recombination of Linked Genes: Crossing Over • Morgan discovered that genes can be linked – But due to the appearance of recombinant phenotypes, the linkage appeared incomplete
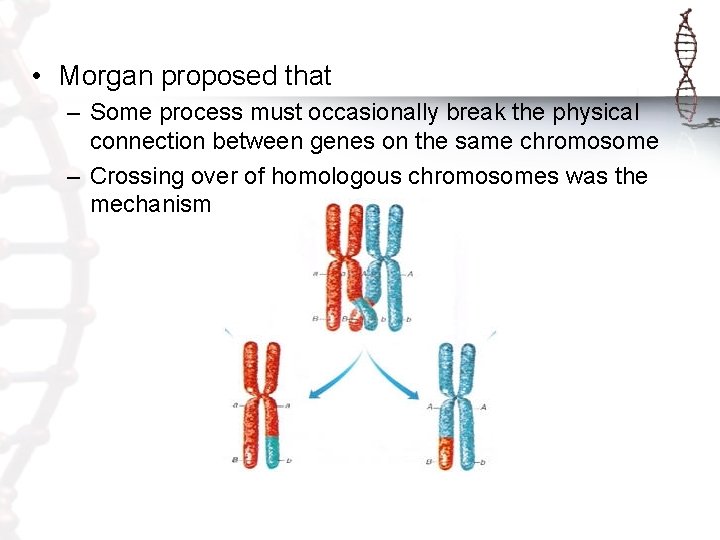
• Morgan proposed that – Some process must occasionally break the physical connection between genes on the same chromosome – Crossing over of homologous chromosomes was the mechanism
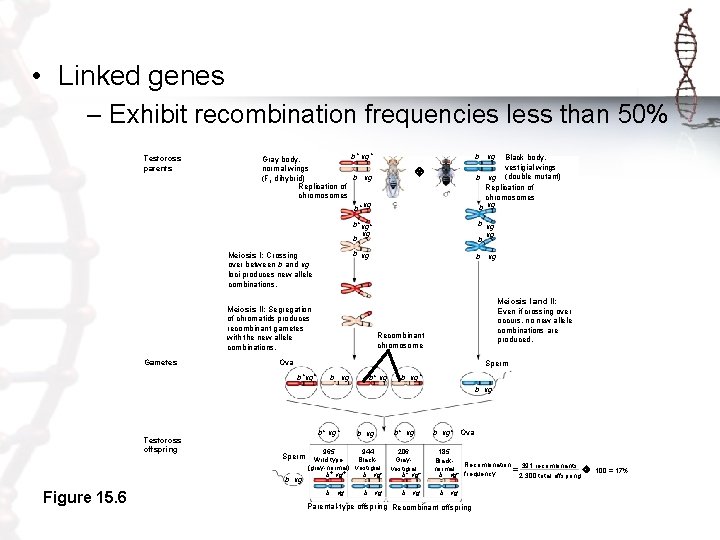
• Linked genes – Exhibit recombination frequencies less than 50% Testcross parents b+ vg+ Gray body, normal wings b vg (F 1 dihybrid) Replication of chromosomes b+ vg Meiosis I: Crossing over between b and vg loci produces new allele combinations. Black body, vestigial wings b vg (double mutant) Replication of chromosomes b vg b+vg+ vg b b vg b vg Meiosis II: Segregation of chromatids produces recombinant gametes with the new allele combinations. Gametes b vg Meiosis I and II: Even if crossing over occurs, no new allele combinations are produced. Recombinant chromosome Ova Sperm b+vg+ b vg b+ vg b vg+ b vg Testcross offspring b+ vg+ Sperm b vg Figure 15. 6 b vg 944 965 Black. Wild type (gray-normal) vestigial b+ vg+ b vg b+ vg 206 Grayvestigial b+ vg+ b vg+ Ova 185 Black. Recombination 391 recombinants normal =2, 300 total offspring 100 = 17% b vg+ frequency b vg Parental-type offspring Recombinant offspring
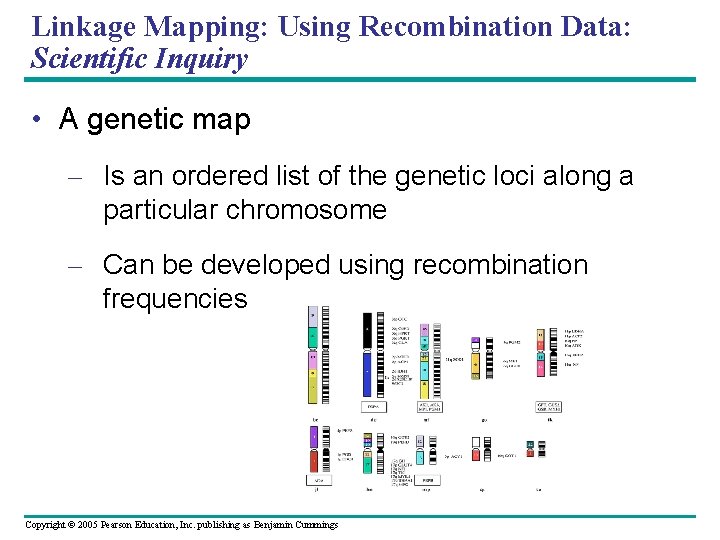
Linkage Mapping: Using Recombination Data: Scientific Inquiry • A genetic map – Is an ordered list of the genetic loci along a particular chromosome – Can be developed using recombination frequencies Copyright © 2005 Pearson Education, Inc. publishing as Benjamin Cummings
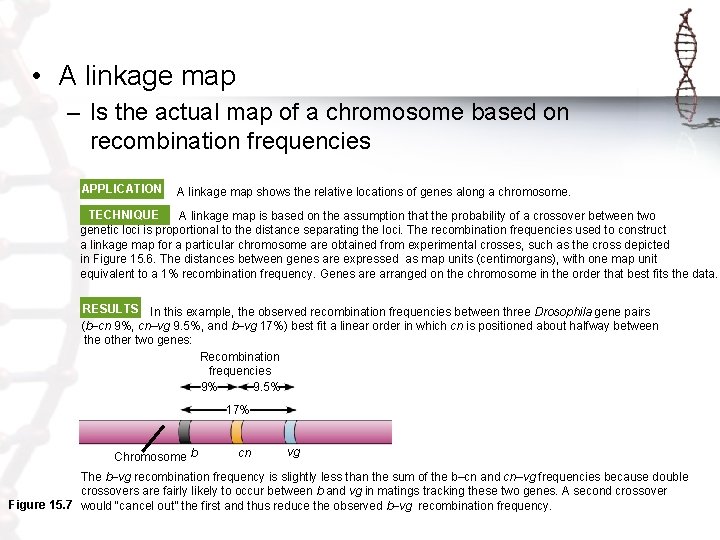
• A linkage map – Is the actual map of a chromosome based on recombination frequencies APPLICATION A linkage map shows the relative locations of genes along a chromosome. TECHNIQUE A linkage map is based on the assumption that the probability of a crossover between two genetic loci is proportional to the distance separating the loci. The recombination frequencies used to construct a linkage map for a particular chromosome are obtained from experimental crosses, such as the cross depicted in Figure 15. 6. The distances between genes are expressed as map units (centimorgans), with one map unit equivalent to a 1% recombination frequency. Genes are arranged on the chromosome in the order that best fits the data. RESULTS In this example, the observed recombination frequencies between three Drosophila gene pairs (b–cn 9%, cn–vg 9. 5%, and b–vg 17%) best fit a linear order in which cn is positioned about halfway between the other two genes: Recombination frequencies 9. 5% 9% 17% Chromosome b cn vg The b–vg recombination frequency is slightly less than the sum of the b–cn and cn–vg frequencies because double crossovers are fairly likely to occur between b and vg in matings tracking these two genes. A second crossover Figure 15. 7 would “cancel out” the first and thus reduce the observed b–vg recombination frequency.
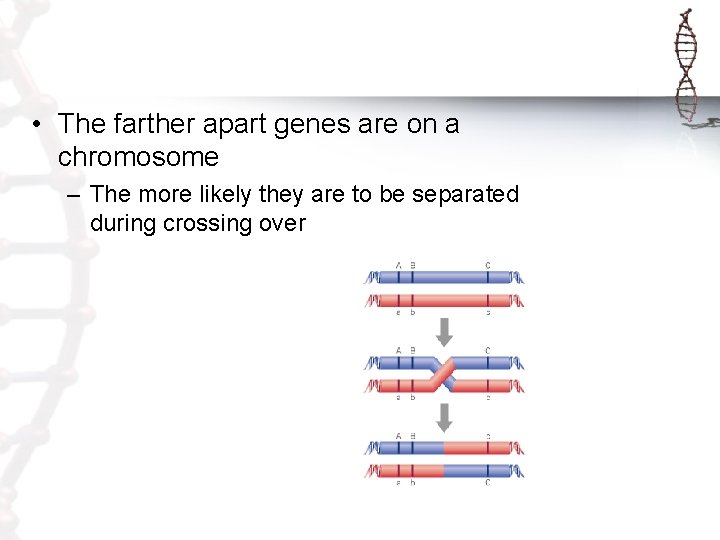
• The farther apart genes are on a chromosome – The more likely they are to be separated during crossing over
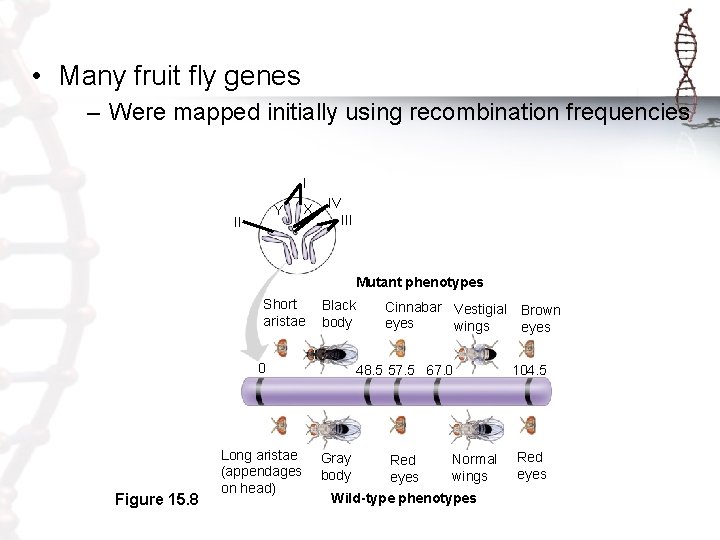
• Many fruit fly genes – Were mapped initially using recombination frequencies I Y II X IV III Mutant phenotypes Short aristae Black body 0 Figure 15. 8 Long aristae (appendages on head) Cinnabar Vestigial Brown eyes wings eyes 48. 5 57. 5 67. 0 Gray body Red eyes Normal wings Wild-type phenotypes 104. 5 Red eyes
• Concept 15. 5: Some inheritance patterns are exceptions to the standard chromosome theory • Two normal exceptions to Mendelian genetics include – Genes located in the nucleus – Genes located outside the nucleus
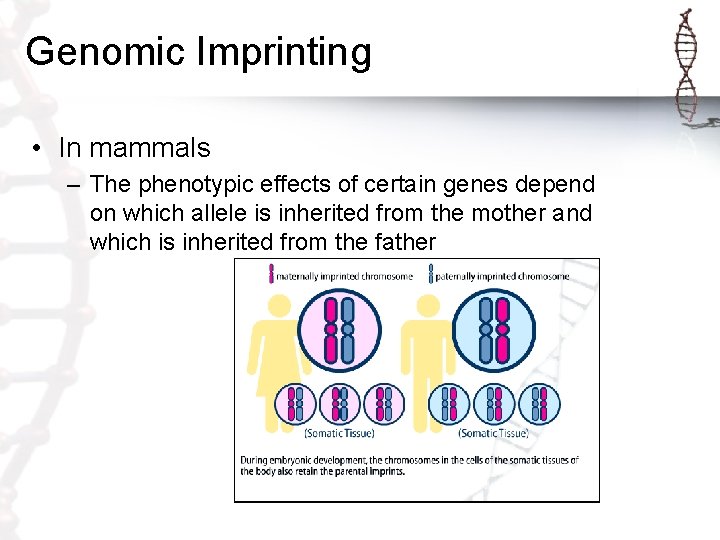
Genomic Imprinting • In mammals – The phenotypic effects of certain genes depend on which allele is inherited from the mother and which is inherited from the father
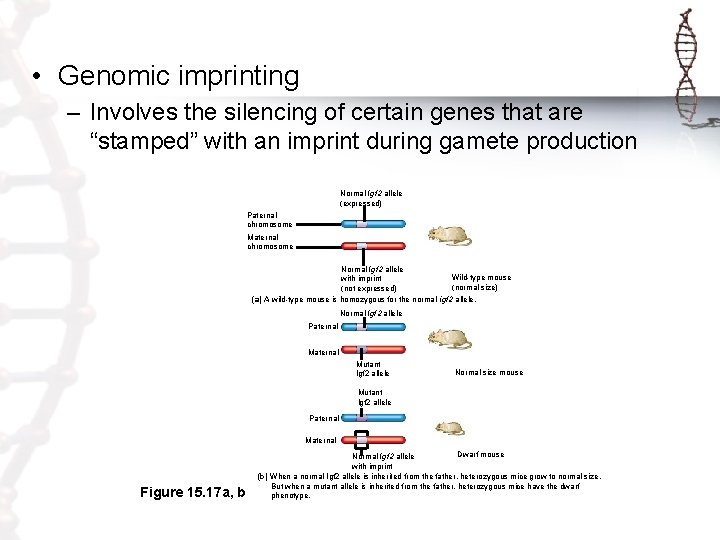
• Genomic imprinting – Involves the silencing of certain genes that are “stamped” with an imprint during gamete production Normal Igf 2 allele (expressed) Paternal chromosome Maternal chromosome Normal Igf 2 allele Wild-type mouse with imprint (normal size) (not expressed) (a) A wild-type mouse is homozygous for the normal igf 2 allele. Normal Igf 2 allele Paternal Mutant lgf 2 allele Normal size mouse Mutant lgf 2 allele Paternal Maternal Figure 15. 17 a, b Dwarf mouse Normal Igf 2 allele with imprint (b) When a normal Igf 2 allele is inherited from the father, heterozygous mice grow to normal size. But when a mutant allele is inherited from the father, heterozygous mice have the dwarf phenotype.
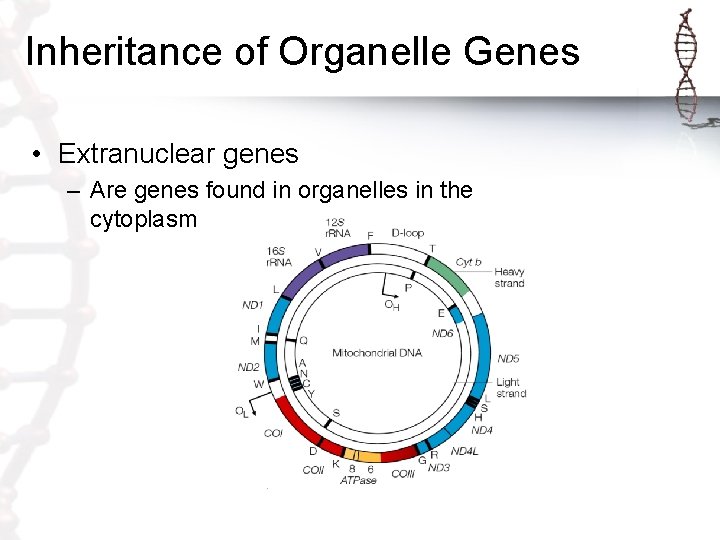
Inheritance of Organelle Genes • Extranuclear genes – Are genes found in organelles in the cytoplasm
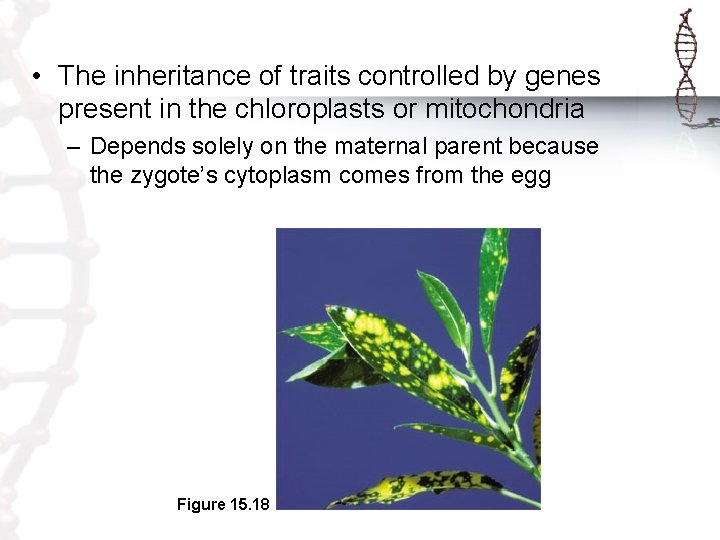
• The inheritance of traits controlled by genes present in the chloroplasts or mitochondria – Depends solely on the maternal parent because the zygote’s cytoplasm comes from the egg Figure 15. 18
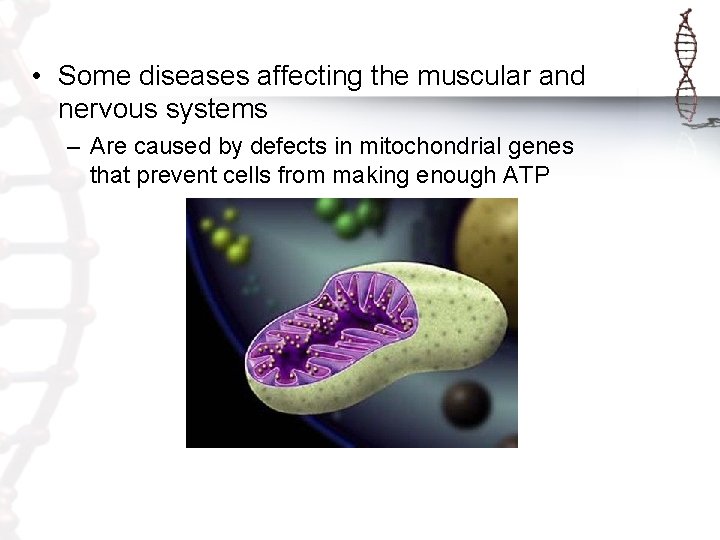
• Some diseases affecting the muscular and nervous systems – Are caused by defects in mitochondrial genes that prevent cells from making enough ATP
- Slides: 31