Elevated levels of Tc 17 and NK 17



- Slides: 33
Elevated levels of Tc 17 and NK 17 cells in early pregnancy are associated with spontaneous abortion in women with a history of infertility or miscarriages Nadera Mansouri-Attia, Ph. D 13 th Congress of ISIR-ESRI 2016 June 22 – 25 2016, Erfurt, Germany
Disclosure statement No conflict of interest
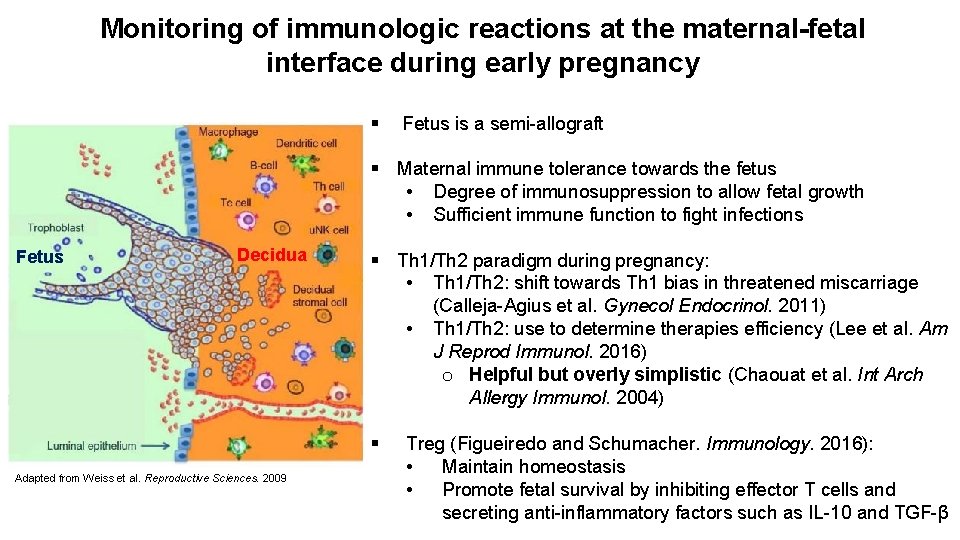
Monitoring of immunologic reactions at the maternal-fetal interface during early pregnancy § Fetus is a semi-allograft § Maternal immune tolerance towards the fetus • Degree of immunosuppression to allow fetal growth • Sufficient immune function to fight infections Fetus Decidua § Th 1/Th 2 paradigm during pregnancy: • Th 1/Th 2: shift towards Th 1 bias in threatened miscarriage (Calleja-Agius et al. Gynecol Endocrinol. 2011) • Th 1/Th 2: use to determine therapies efficiency (Lee et al. Am J Reprod Immunol. 2016) o Helpful but overly simplistic (Chaouat et al. Int Arch Allergy Immunol. 2004) § Adapted from Weiss et al. Reproductive Sciences. 2009 Treg (Figueiredo and Schumacher. Immunology. 2016): • Maintain homeostasis • Promote fetal survival by inhibiting effector T cells and secreting anti-inflammatory factors such as IL-10 and TGF-β
Aims of the Study § Retrospective cross-sectional study to determine association of peripheral blood levels of various immune cell types in relation to pregnancy outcome § Does Th 1/Th 2 balance correlate with pregnancy outcome in our study? § Use these parameters to monitor pregnancy and detect women “at risk” § Study the effects of immunomodulatory agents such as Neupogen: - on intracellular cytokine levels - to counteract these deleterious effects - to improve the pregnancy outcome
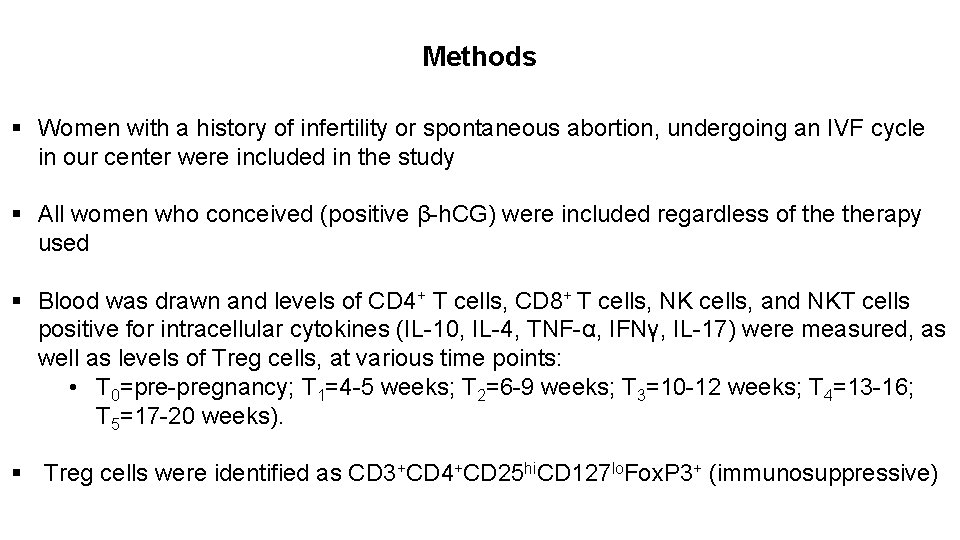
Methods § Women with a history of infertility or spontaneous abortion, undergoing an IVF cycle in our center were included in the study § All women who conceived (positive β-h. CG) were included regardless of therapy used § Blood was drawn and levels of CD 4+ T cells, CD 8+ T cells, NK cells, and NKT cells positive for intracellular cytokines (IL-10, IL-4, TNF-α, IFNγ, IL-17) were measured, as well as levels of Treg cells, at various time points: • T 0=pre-pregnancy; T 1=4 -5 weeks; T 2=6 -9 weeks; T 3=10 -12 weeks; T 4=13 -16; T 5=17 -20 weeks). § Treg cells were identified as CD 3+CD 4+CD 25 hi. CD 127 lo. Fox. P 3+ (immunosuppressive)
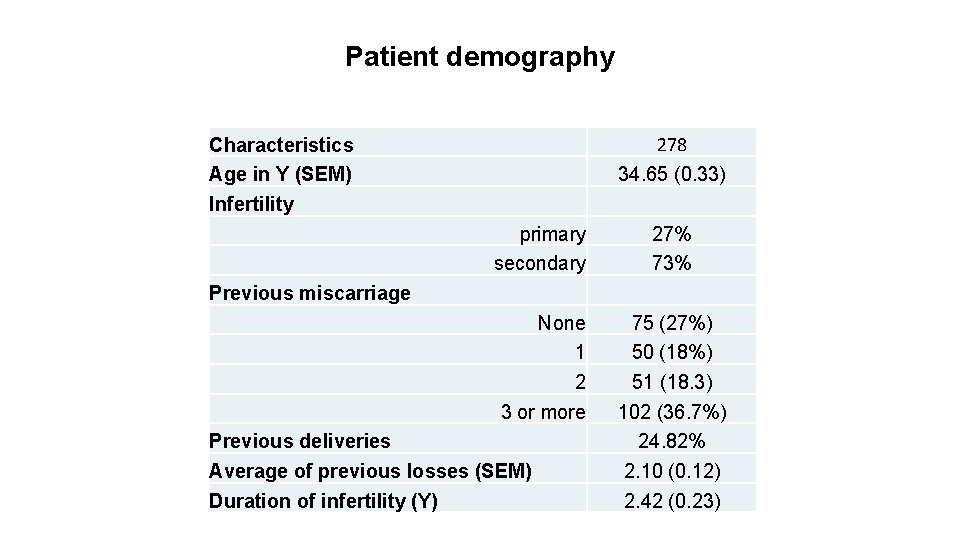
Patient demography 278 Characteristics Age in Y (SEM) Infertility primary secondary Previous miscarriage None 1 2 3 or more Previous deliveries Average of previous losses (SEM) Duration of infertility (Y) 34. 65 (0. 33) 27% 73% 75 (27%) 50 (18%) 51 (18. 3) 102 (36. 7%) 24. 82% 2. 10 (0. 12) 2. 42 (0. 23)
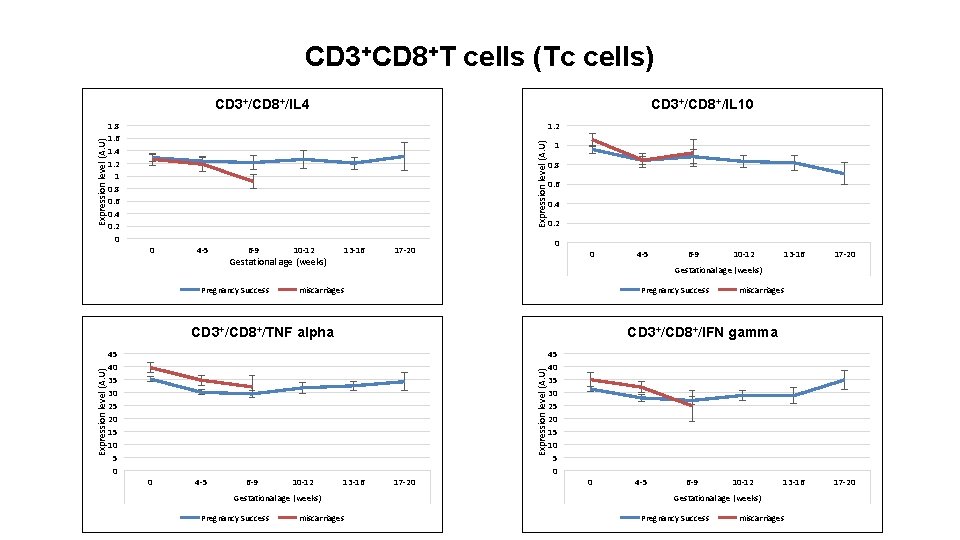
CD 3+CD 8+T cells (Tc cells) 1. 8 1. 6 1. 4 1. 2 1 0. 8 0. 6 0. 4 0. 2 0 CD 3+/CD 8+/IL 10 1. 2 Expression level (A. U) CD 3+/CD 8+/IL 4 0 4 -5 6 -9 10 -12 Gestational age (weeks) Pregnancy Success 13 -16 1 0. 8 0. 6 0. 4 0. 2 0 17 -20 0 6 -9 10 -12 13 -16 17 -20 Gestational age (weeks) miscarriages Pregnancy Success CD 3+/CD 8+/TNF alpha miscarriages CD 3+/CD 8+/IFN gamma 45 40 35 30 25 20 15 10 5 0 Expression level (A. U) 45 40 35 30 25 20 15 10 5 0 4 -5 6 -9 10 -12 13 -16 Gestational age (weeks) Pregnancy Success miscarriages 17 -20
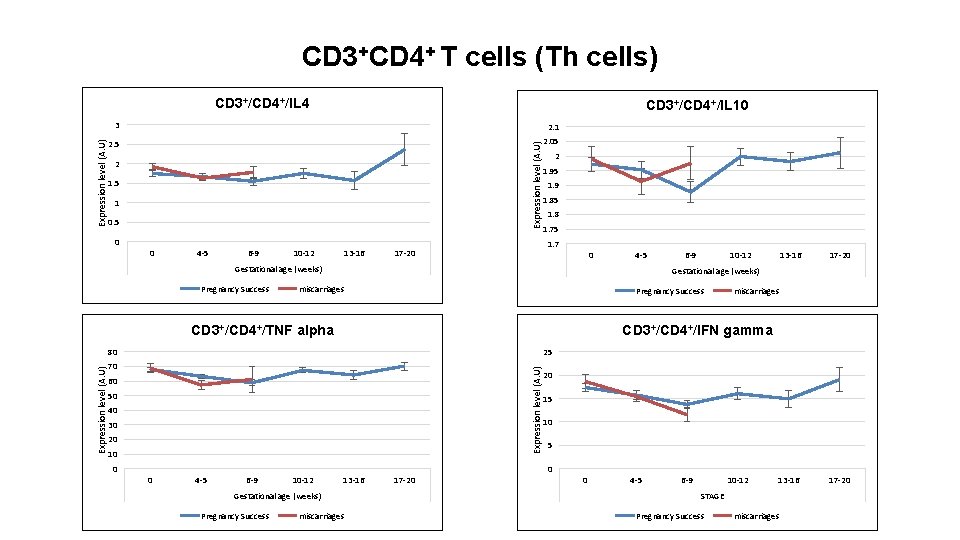
CD 3+CD 4+ T cells (Th cells) CD 3+/CD 4+/IL 10 3 2. 1 2. 5 2. 05 Expression level (A. U) CD 3+/CD 4+/IL 4 2 1. 5 1 0. 5 0 0 4 -5 6 -9 10 -12 13 -16 2 1. 95 1. 9 1. 85 1. 8 1. 75 1. 7 17 -20 0 4 -5 Gestational age (weeks) Pregnancy Success 10 -12 13 -16 17 -20 Gestational age (weeks) miscarriages Pregnancy Success CD 3+/CD 4+/TNF alpha miscarriages CD 3+/CD 4+/IFN gamma 80 25 Expression level (A. U) 70 20 60 50 15 40 10 30 20 10 0 6 -9 0 4 -5 6 -9 10 -12 13 -16 Gestational age (weeks) Pregnancy Success miscarriages 17 -20 5 0 0 4 -5 6 -9 10 -12 STAGE Pregnancy Success miscarriages
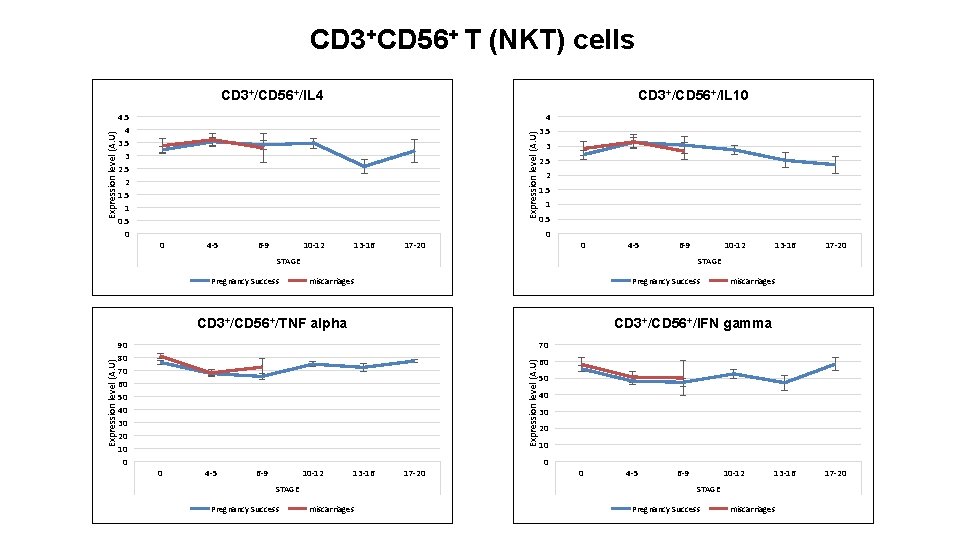
CD 3+CD 56+ T (NKT) cells 4. 5 4 3. 5 3 2. 5 2 1. 5 1 0. 5 0 CD 3+/CD 56+/IL 10 4 Expression level (A. U) CD 3+/CD 56+/IL 4 0 4 -5 6 -9 10 -12 13 -16 3. 5 3 2. 5 2 1. 5 1 0. 5 0 17 -20 0 4 -5 6 -9 STAGE Pregnancy Success 13 -16 17 -20 STAGE miscarriages Pregnancy Success CD 3+/CD 56+/TNF alpha miscarriages CD 3+/CD 56+/IFN gamma 70 Expression level (A. U) 60 Expression level (A. U) 90 80 70 60 50 40 30 20 10 -12 50 40 30 20 10 0 4 -5 6 -9 10 -12 13 -16 STAGE Pregnancy Success 17 -20 0 0 4 -5 6 -9 10 -12 13 -16 STAGE miscarriages Pregnancy Success miscarriages 17 -20
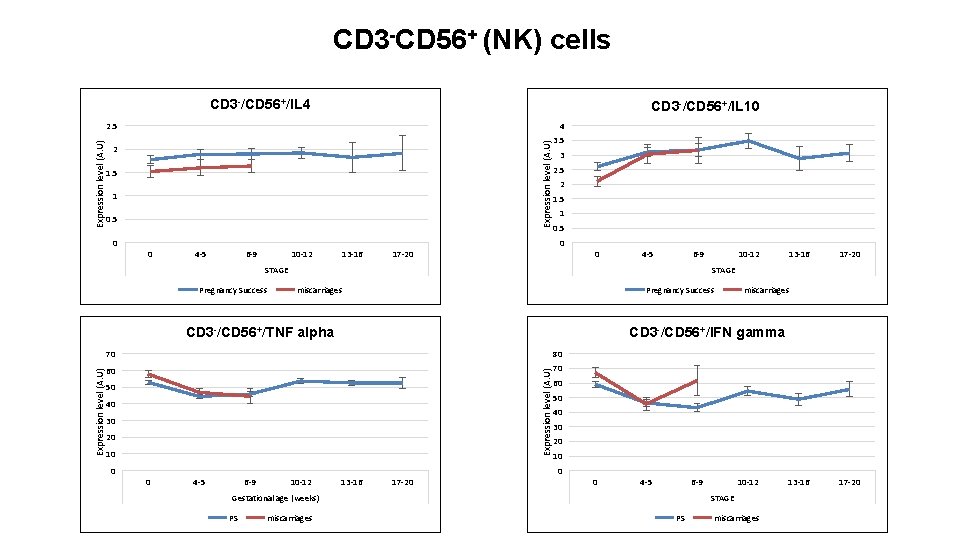
CD 3 -CD 56+ (NK) cells CD 3 -/CD 56+/IL 4 CD 3 -/CD 56+/IL 10 4 Expression level (A. U) 2. 5 2 1. 5 1 0. 5 0 0 4 -5 6 -9 10 -12 13 -16 3. 5 3 2. 5 2 1. 5 1 0. 5 0 17 -20 0 4 -5 6 -9 STAGE Pregnancy Success 13 -16 17 -20 STAGE miscarriages Pregnancy Success CD 3 -/CD 56+/TNF alpha miscarriages CD 3 -/CD 56+/IFN gamma 60 70 Expression level (A. U) 80 Expression level (A. U) 70 60 50 50 40 40 30 30 20 20 10 -12 10 0 4 -5 6 -9 10 -12 13 -16 17 -20 0 0 4 -5 6 -9 Gestational age (weeks) PS miscarriages 10 -12 STAGE PS miscarriages 13 -16 17 -20
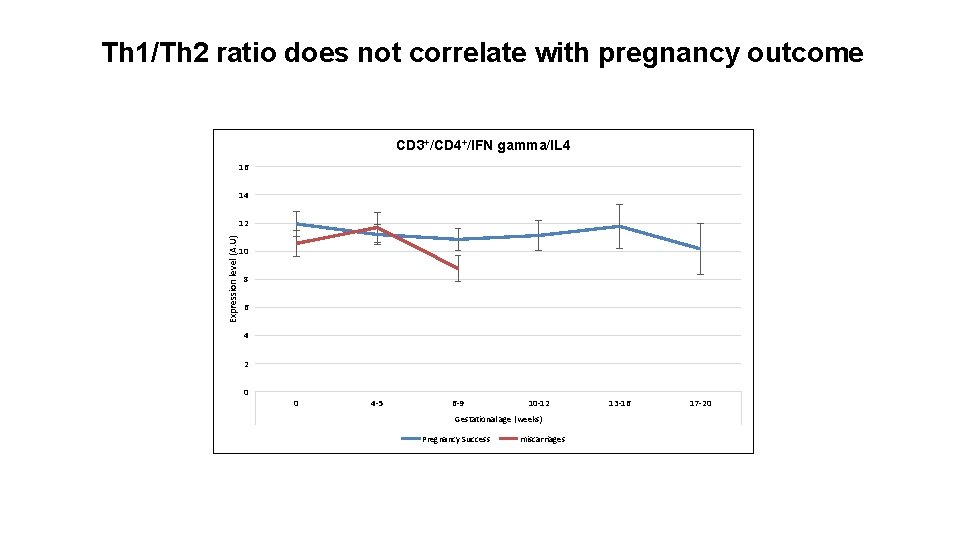
Th 1/Th 2 ratio does not correlate with pregnancy outcome CD 3+/CD 4+/IFN gamma/IL 4 16 14 Expression level (A. U) 12 10 8 6 4 2 0 0 4 -5 6 -9 10 -12 Gestational age (weeks) Pregnancy Success miscarriages 13 -16 17 -20
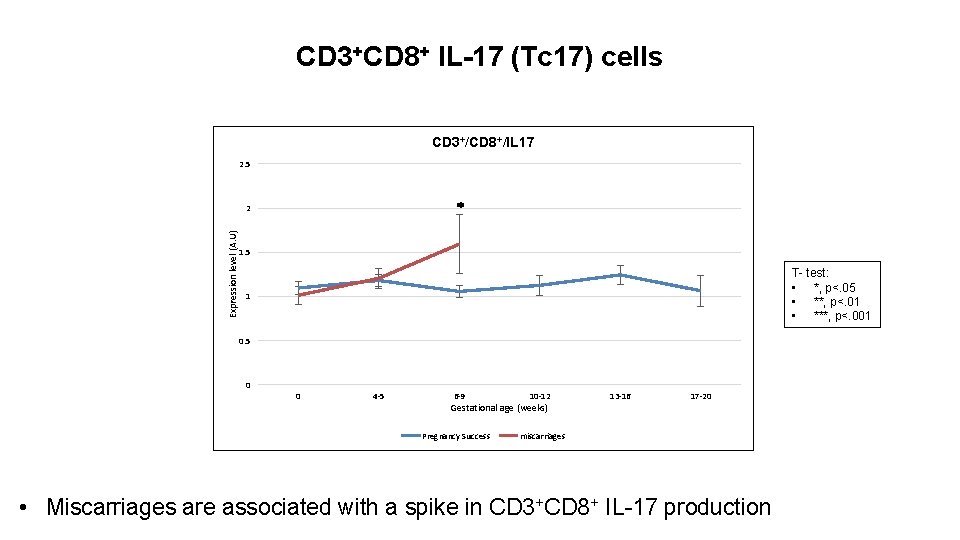
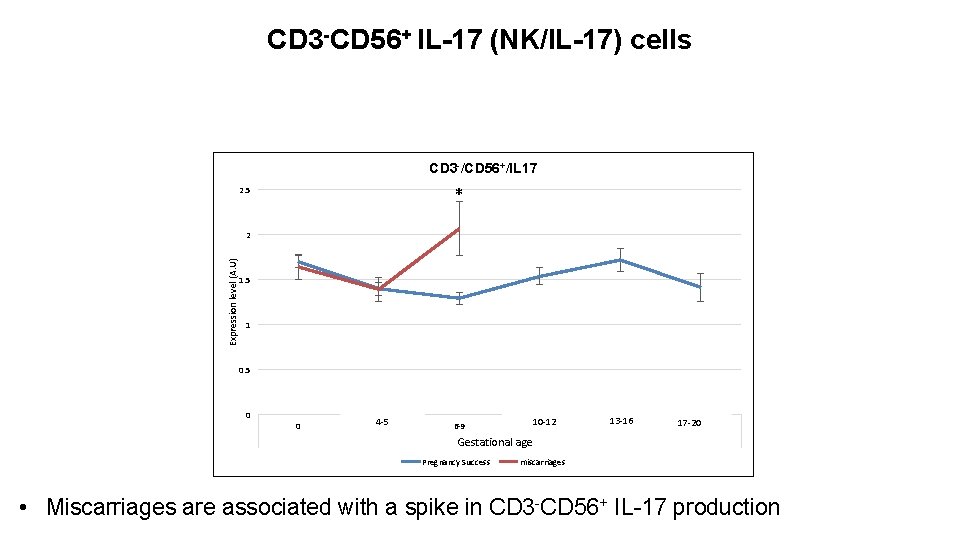
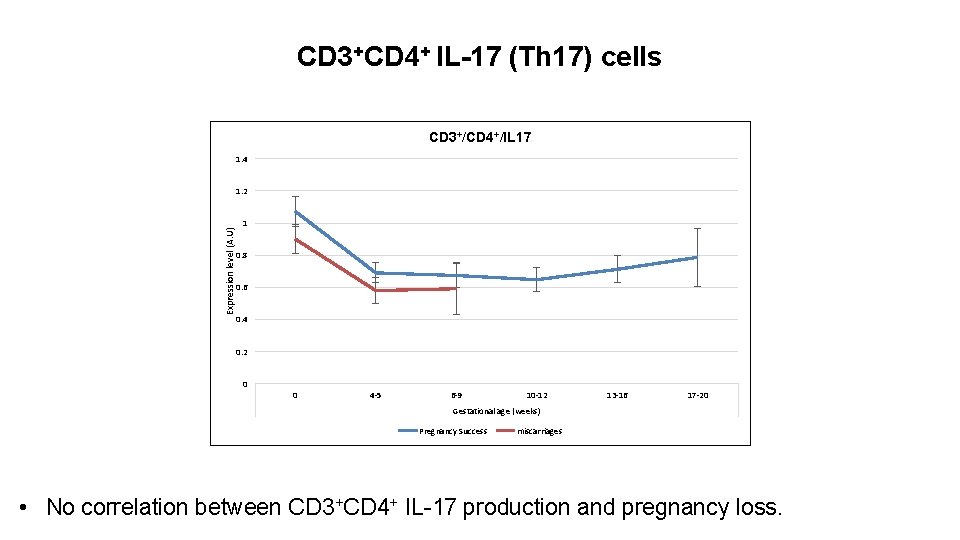
IL-17 -producing cells during early pregnancy § IL-17 is a proinflammatory cytokine that plays a role in host defense against bacteria and fungi but also in the pathogenesis of autoimmune diseases § There are many IL-17 producing cells including CD 4+ T cells (Th 17), CD 8+ T cells (Tc 17), NK cells (NK 17), and NKT cells (NKT 17) • IL-17 producing CD 8+ T cells may also be γδ T cells or MAIT cells (Kim and Jordan. Cell Mol Life Sci. 2013) § Tc 17 cells are key mediators of graft-versus-host disease (GVHD) after allogeneic stem cell transplantation (Gartlan et al. Transplantation. 2015) § While Th 17 were previously associated with a negative pregnancy outcome (Figueiredo and Schumacher. Immunology. 2016), nothing is known so far on Tc 17 or NK 17 in relation to pregnancy outcome
CD 3+CD 8+ IL-17 (Tc 17) cells CD 3+/CD 8+/IL 17 2. 5 * Expression level (A. U) 2 1. 5 T- test: • *, p<. 05 • **, p<. 01 • ***, p<. 001 1 0. 5 0 0 4 -5 6 -9 10 -12 Gestational age (weeks) Pregnancy Success 13 -16 17 -20 miscarriages • Miscarriages are associated with a spike in CD 3+CD 8+ IL-17 production
CD 3 -CD 56+ IL-17 (NK/IL-17) cells CD 3 -/CD 56+/IL 17 * 2. 5 Expression level (A. U) 2 1. 5 1 0. 5 0 0 4 -5 1 -5 6 -9 10 -12 10 -13 13 -16 14 -17 17 -20 18 -20 STAGE age Gestational Pregnancy Success miscarriages • Miscarriages are associated with a spike in CD 3 -CD 56+ IL-17 production
CD 3+CD 4+ IL-17 (Th 17) cells CD 3+/CD 4+/IL 17 1. 4 Expression level (A. U) 1. 2 1 0. 8 0. 6 0. 4 0. 2 0 0 4 -5 6 -9 10 -12 13 -16 17 -20 Gestational age (weeks) Pregnancy Success miscarriages • No correlation between CD 3+CD 4+ IL-17 production and pregnancy loss.
Treg cell trafficking during early pregnancy § Treg cells are enriched in the fetal-maternal interface during early pregnancy (Mjosberg et al. Biol Reprod 2010) § Treg cells were shown to migrate from the peripheral blood to the decidua in pregnant subjects (Tilburgs et al. Immunol 2008): • This correlates with decreasing Treg cell levels in peripheral blood of pregnant women (Wegienka et al. J Reprod Immunol 2011) § Treg cells might be recruited and expanded by the recognition to fetal antigens (Aluvihare et al. Nat Immunol 2004) § Lower proportion of decidual Treg cells was found in the POC of spontaneous abortion cases vs terminated early pregnancy (Sasaki et al. Mol Hum Reprod 2004) RM patients have a lower ability to induce and maintain immune tolerance towards fetal alloantigens
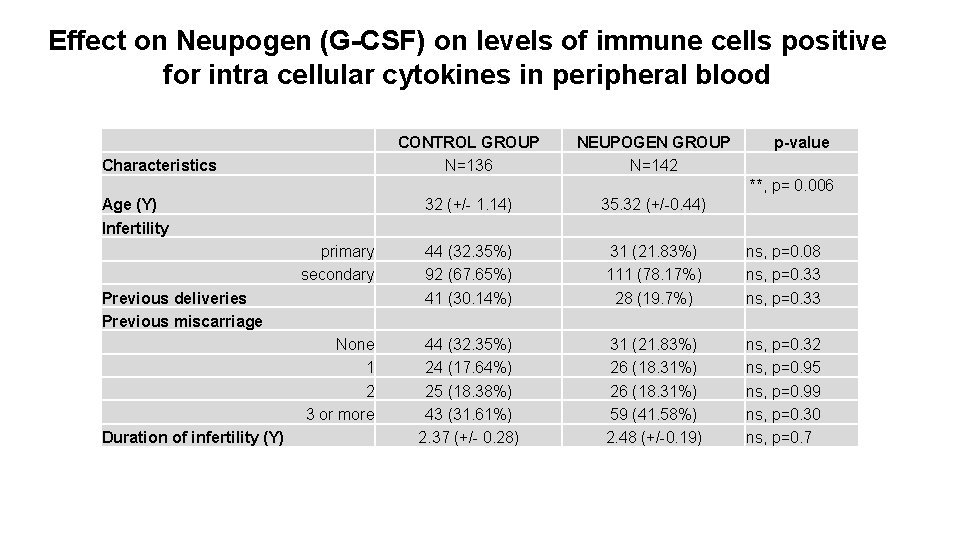
Effect on Neupogen (G-CSF) on levels of immune cells positive for intra cellular cytokines in peripheral blood CONTROL GROUP N=136 Characteristics NEUPOGEN GROUP N=142 p-value **, p= 0. 006 Age (Y) Infertility primary secondary Previous deliveries Previous miscarriage None 1 2 3 or more Duration of infertility (Y) 32 (+/- 1. 14) 44 (32. 35%) 92 (67. 65%) 41 (30. 14%) 44 (32. 35%) 24 (17. 64%) 25 (18. 38%) 43 (31. 61%) 2. 37 (+/- 0. 28) 35. 32 (+/-0. 44) 31 (21. 83%) 111 (78. 17%) 28 (19. 7%) 31 (21. 83%) 26 (18. 31%) 59 (41. 58%) 2. 48 (+/-0. 19) ns, p=0. 08 ns, p=0. 33 ns, p=0. 32 ns, p=0. 95 ns, p=0. 99 ns, p=0. 30 ns, p=0. 7
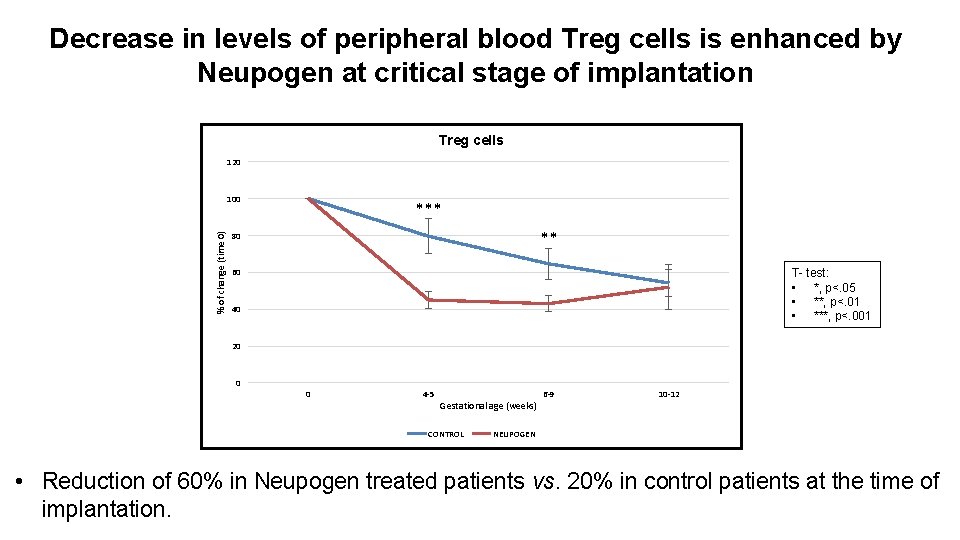
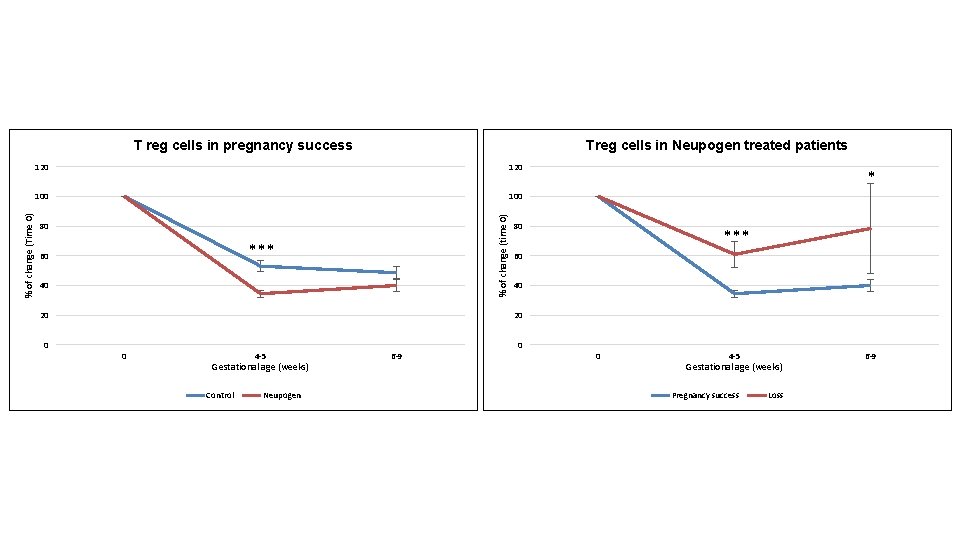
Decrease in levels of peripheral blood Treg cells is enhanced by Neupogen at critical stage of implantation Treg cells 120 % of change (time 0) 100 *** ** 80 T- test: • *, p<. 05 • **, p<. 01 • ***, p<. 001 60 40 20 0 0 4 -5 Gestational age (weeks) CONTROL 6 -9 10 -12 NEUPOGEN • Reduction of 60% in Neupogen treated patients vs. 20% in control patients at the time of implantation.
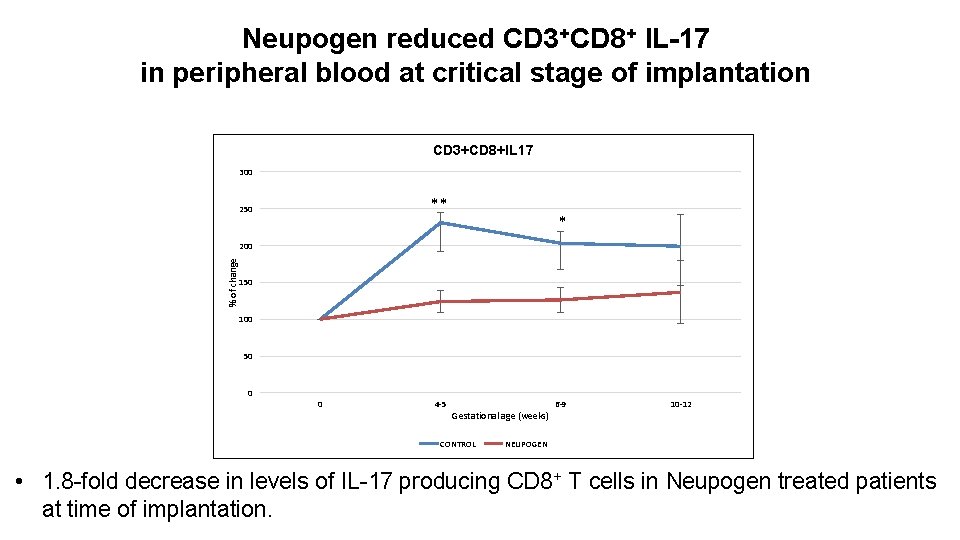
Neupogen reduced CD 3+CD 8+ IL-17 in peripheral blood at critical stage of implantation CD 3+CD 8+IL 17 300 ** 250 * % of change 200 150 100 50 0 0 4 -5 Gestational age (weeks) CONTROL 6 -9 10 -12 NEUPOGEN • 1. 8 -fold decrease in levels of IL-17 producing CD 8+ T cells in Neupogen treated patients at time of implantation.
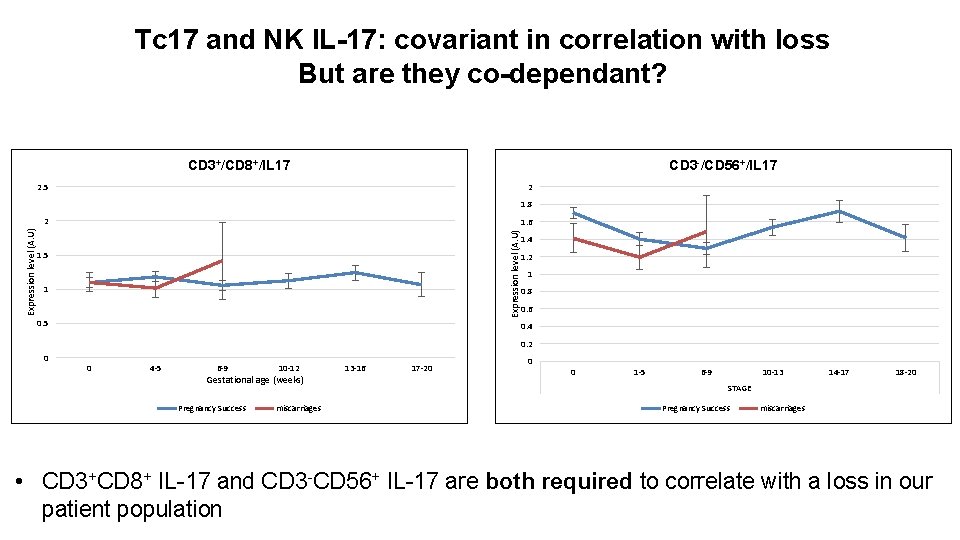
Tc 17 and NK IL-17: covariant in correlation with loss But are they co-dependant? CD 3+/CD 8+/IL 17 CD 3 -/CD 56+/IL 17 2. 5 2 1. 8 1. 6 Expression level (A. U) 2 1. 5 1 0. 5 1. 4 1. 2 1 0. 8 0. 6 0. 4 0. 2 0 0 4 -5 6 -9 10 -12 Gestational age (weeks) Pregnancy Success miscarriages 13 -16 17 -20 0 0 1 -5 6 -9 10 -13 14 -17 18 -20 STAGE Pregnancy Success miscarriages • CD 3+CD 8+ IL-17 and CD 3 -CD 56+ IL-17 are both required to correlate with a loss in our patient population
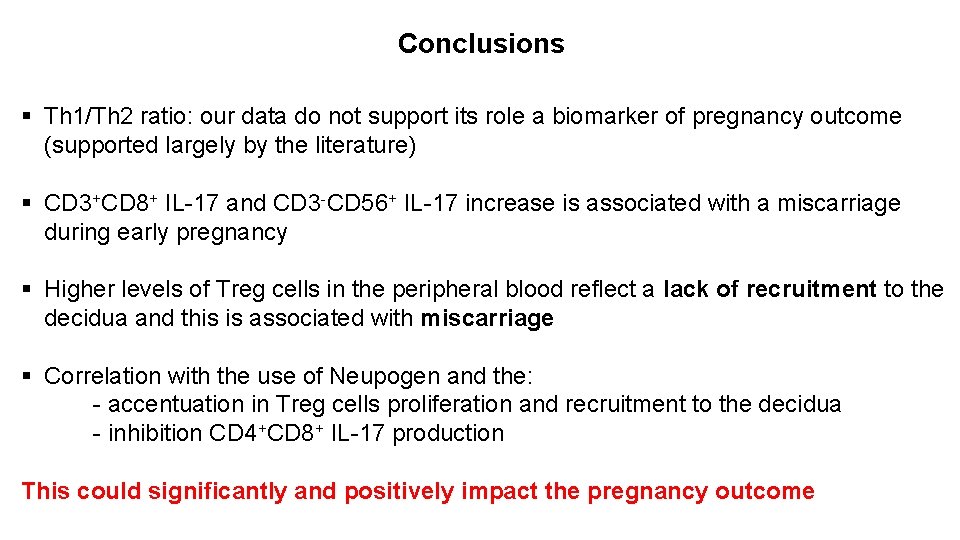
Conclusions § Th 1/Th 2 ratio: our data do not support its role a biomarker of pregnancy outcome (supported largely by the literature) § CD 3+CD 8+ IL-17 and CD 3 -CD 56+ IL-17 increase is associated with a miscarriage during early pregnancy § Higher levels of Treg cells in the peripheral blood reflect a lack of recruitment to the decidua and this is associated with miscarriage § Correlation with the use of Neupogen and the: - accentuation in Treg cells proliferation and recruitment to the decidua - inhibition CD 4+CD 8+ IL-17 production This could significantly and positively impact the pregnancy outcome
Acknowledgements Braverman Reproductive Immunology - Jeffrey Braverman, MD, FACOG Darren Ritsick, Ph. D Andrea Vidali, MD Meredith Campbell Katie Carlson Medical staff Reprosource - Benjamin Leader, MD, Ph. D - Kevin Arnold, Ph. D - Meenakshi Khare, Ph. D Thanks to all our patients!
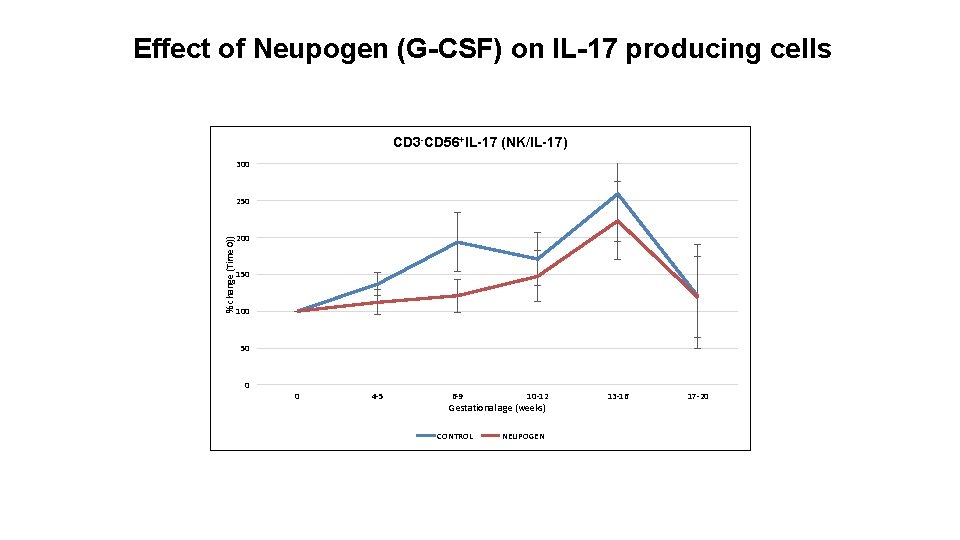
Effect of Neupogen (G-CSF) on IL-17 producing cells CD 3 -CD 56+IL-17 (NK/IL-17) 300 % change (Time 0)) 250 200 150 100 50 0 0 4 -5 6 -9 10 -12 Gestational age (weeks) CONTROL NEUPOGEN 13 -16 17 -20
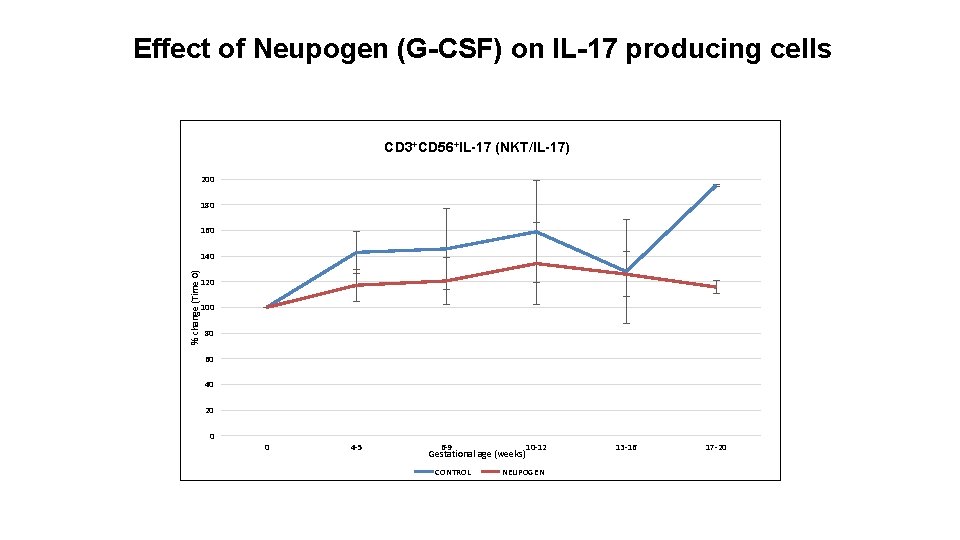
Effect of Neupogen (G-CSF) on IL-17 producing cells CD 3+CD 56+IL-17 (NKT/IL-17) 200 180 160 % change (Time 0) 140 120 100 80 60 40 20 0 0 4 -5 6 -9 Gestational age (weeks) CONTROL 10 -12 NEUPOGEN 13 -16 17 -20
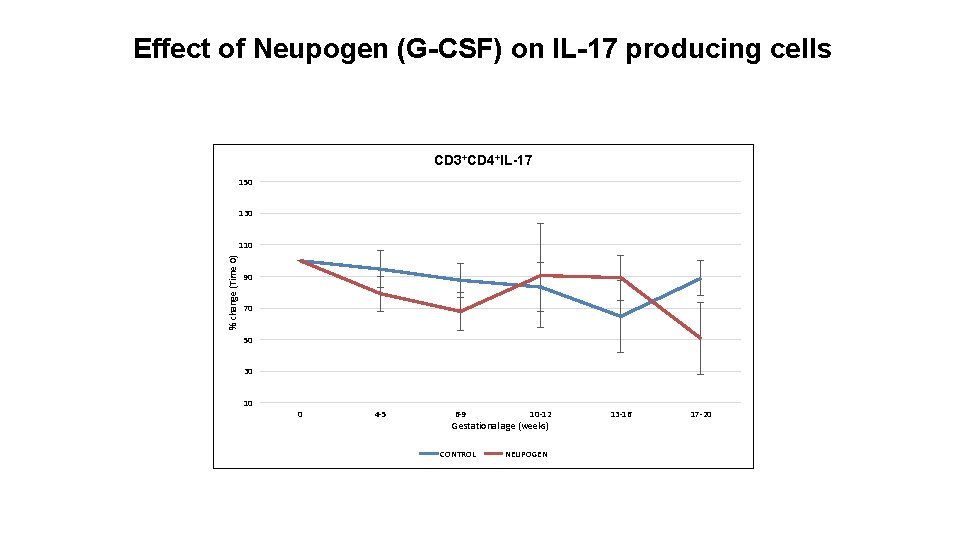
Effect of Neupogen (G-CSF) on IL-17 producing cells CD 3+CD 4+IL-17 150 130 % change (Time 0) 110 90 70 50 30 10 0 4 -5 6 -9 10 -12 Gestational age (weeks) CONTROL NEUPOGEN 13 -16 17 -20
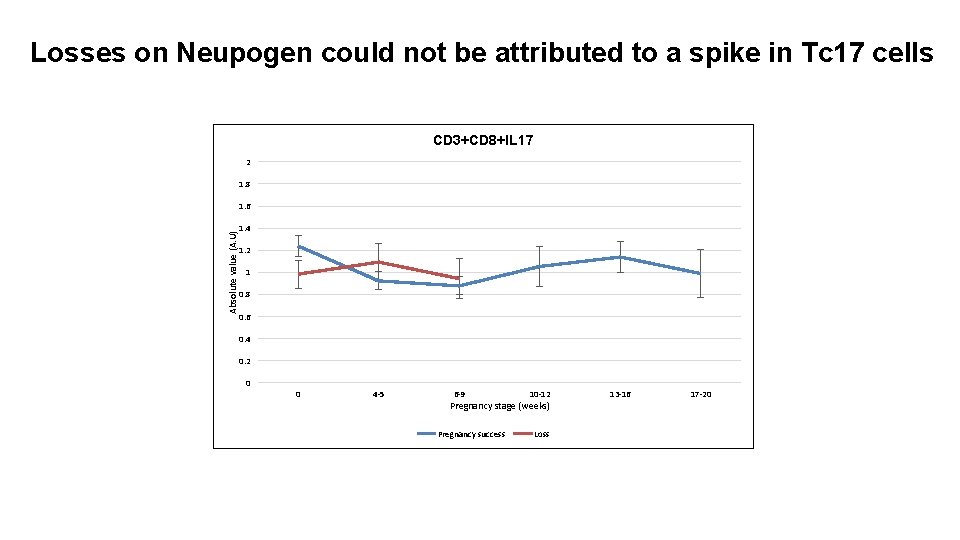
Losses on Neupogen could not be attributed to a spike in Tc 17 cells CD 3+CD 8+IL 17 2 1. 8 Absolute value (A. U) 1. 6 1. 4 1. 2 1 0. 8 0. 6 0. 4 0. 2 0 0 4 -5 6 -9 10 -12 Pregnancy stage (weeks) Pregnancy success Loss 13 -16 17 -20
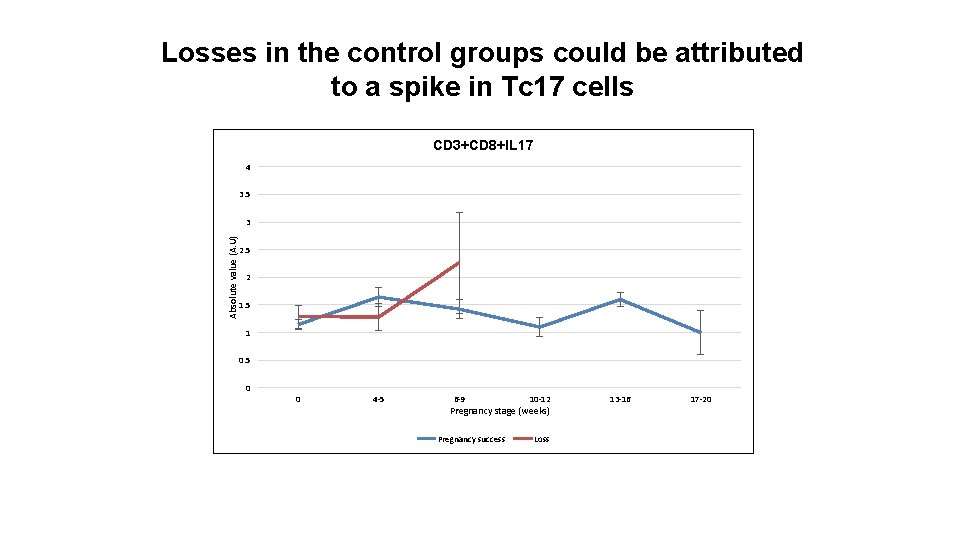
Losses in the control groups could be attributed to a spike in Tc 17 cells CD 3+CD 8+IL 17 4 3. 5 Absolute value (A. U) 3 2. 5 2 1. 5 1 0. 5 0 0 4 -5 6 -9 10 -12 Pregnancy stage (weeks) Pregnancy success Loss 13 -16 17 -20
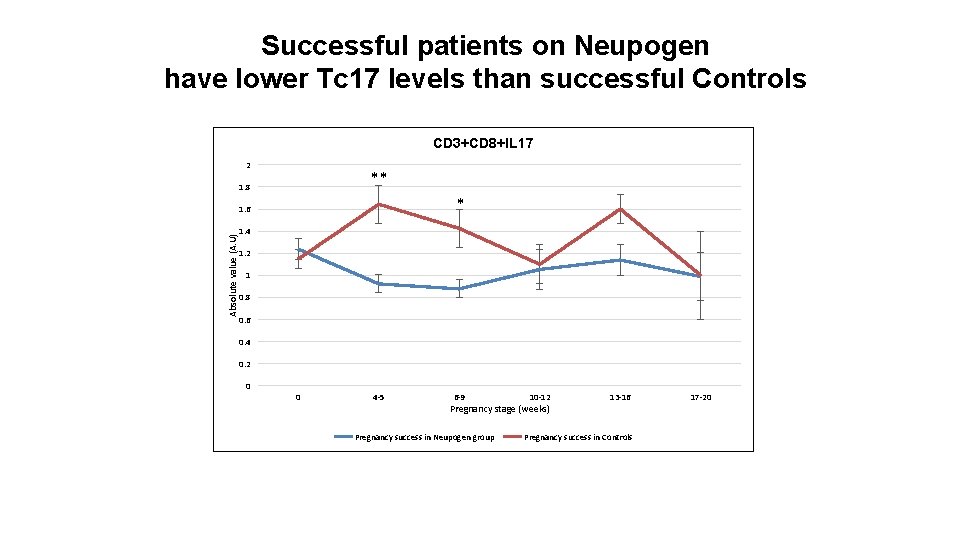
Successful patients on Neupogen have lower Tc 17 levels than successful Controls CD 3+CD 8+IL 17 2 ** 1. 8 * Absolute value (A. U) 1. 6 1. 4 1. 2 1 0. 8 0. 6 0. 4 0. 2 0 0 4 -5 6 -9 10 -12 Pregnancy stage (weeks) Pregnancy success in Neupogen group 13 -16 Pregnancy success in Controls 17 -20
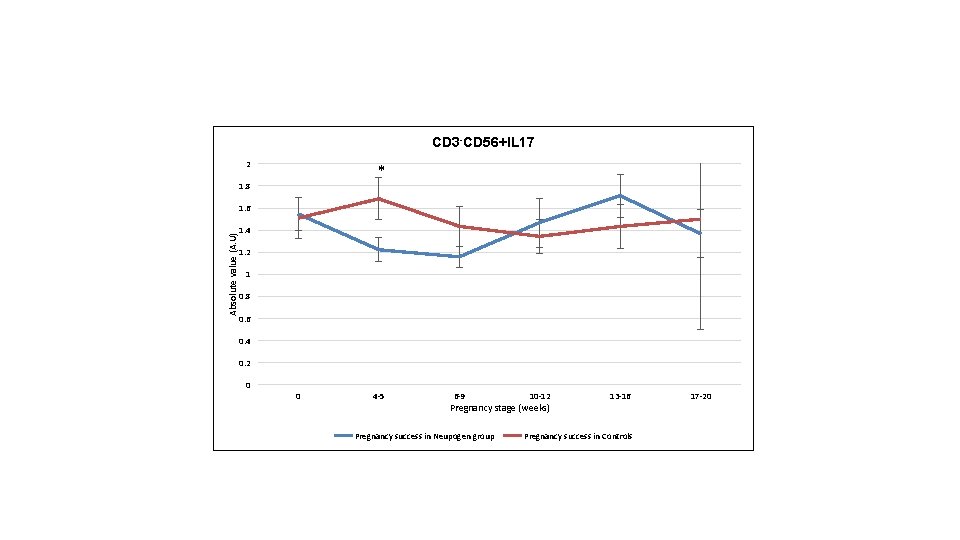
CD 3 -CD 56+IL 17 2 * 1. 8 Absolute value (A. U) 1. 6 1. 4 1. 2 1 0. 8 0. 6 0. 4 0. 2 0 0 4 -5 6 -9 10 -12 Pregnancy stage (weeks) Pregnancy success in Neupogen group 13 -16 Pregnancy success in Controls 17 -20
Treg cells in Neupogen treated patients 120 100 % of change (time 0) % of change (Time 0) T reg cells in pregnancy success 80 *** 60 40 20 0 * 80 *** 60 40 20 0 4 -5 Gestational age (weeks) Control Neupogen 6 -9 0 0 4 -5 Gestational age (weeks) Pregnancy success Loss 6 -9