Understanding My Renal Patients Lab Values Connie Gilet

Understanding My Renal Patients’ Lab Values Connie Gilet, ANP UNC Kidney Center/ UNC Healthcare September 2011

Objectives �Discuss lab values related to anemia management >Interpret CBC results, including H/H, RDW (red cell distribution width), MCV (mean corpuscular volume) and MCHC (mean corpuscular hemoglobin concentration) >Examine iron study results, focusing on iron saturation and ferritin

Objectives �Discuss the complex relationship between calcium, phosphorus, vitamin D and PTH >Review bone and mineral pathophysiology >Discuss why interventions involve thinking about all four of the above lab values >Outline when lab values are “only” abnormal vs when they are alarming >Discuss treatment of bone and mineral abnormalities with medications and surgery

Objectives �Discuss how dialysis adequacy is determined and used in a clinical setting >Discuss URR, Kt/V and PET, how to calculate these measures and how to interpret the results >Discuss the advantages and disadvantages of URR (Urea Reduction Ratio) vs Kt/V >Examine when, why and how the dialysis prescription should be adjusted

Plan �Briefly present basic information for each topic �Hopefully, present new information for each topic �Case studies will help to enhance understanding of information presented
")
Anemia �Anemia is defined as a decrease in red blood cells (RBC’s)

Anemia �Decrease in RBC’s can be due to a variety of factors…. . >Abnormal destruction of red blood cells (e. g. hemolytic anemia, sickle cell disease) >Lack/decreased cell production from bone marrow (e. g. aplastic anemia, myeloproliferative disorders) >Blood loss (e. g. GI Bleed) >Lack of substances needed to produced RBC’s >All of the above seen in people with CKD
 Stimulates bone marrow")
Substances Needed for RBC Formation NECESSARY SUBSTANCE/STRUCTURE RELATED INFORMATION Erythropoietin (hormone) Stimulates bone marrow to produce RBC’s Need adequate nutrients—e. g. Iron, Vitamin B 12, Folic acid To produce hemoglobin DNA Chronic inflammation 2/2 infection and/or autoimmune disorders (e. g. Lupus) impairs DNA synthesis => anemia Bone marrow Reticulocyte count reflects ability of bone marrow to produce RBC’s. Retic ulocyte = immature RBC’s Anemia in ESRD, can see decreased RBC production (lack of substances to make cells) and increased retic count. A very elevated retic count points to increase RBC destruction or hemolysis as a potential cause of anemia. Images from www. google. com/bonemarrow

Anemia Management � Current practice >If Hgb less than 10 g/dl x 2, start Epogen/Aranesp >Hgb levels checked at least monthly (KDOQI) >Goal: maintain Hgb between 10 and 12 g/dl >CREATE and CHOIR study >Do not know optimal Hgb for people with CKD >If Hgb exceeds upper limit (12 g/dl) or increases more than 1 g/dl in 2 wks: >Hold the dose (per FDA) >No benefits to hemoglobin > 13 g/dl. In fact, increases the risk of clots, vascular events (heart attack and stroke) and death

Anemia Management �“New? ” >TREAT--Trial to Reduce Cardiovascular Events with Aranesp Therapy (people not on dialysis) >Study completed in 2009 >Recommends Hgb >10 and <11 g/dl >Reduce risk of clots, heart attacks, stroke and death >Several other studies currently underway >Will guidelines for people on dialysis also change?

Anemia �Let’s define lab values reported in a CBC results: >Red blood cells >Hemoglobin >Hematocrit >Reticulocyte count >MCV (mean corpuscular volume) >MCHC (mean corpuscular hemoglobin concentration) >RDW (red cell distribution width)
 >Normal life span 120 days/80")
Red Blood Cells and Hemoglobin �Red blood cells (RBC) >Normal life span 120 days/80 -90 days if on dialysis >Decreased life span due to toxic, uremic environment* >Composed of mostly water and hemoglobin �Hemoglobin >Hgb molecule made of iron and protein >The predominant protein in RBC >Carries oxygen *Ly, et al (200$)

Hemoglobin �CKD abnormal H/H; what are critical Hgb values? �Hgb values below 5 g/dl can cause heart failure �Hgb values above 13 g/dl can cause CV events/death* KDOQI Anemia Guidelines: 2007 Update
 >Increase/decrease of")
Hematocrit �Hematocrit >% of RBC in plasma (liquid part of the blood) >Increase/decrease of plasma volume affects the hematocrit values >Decrease occurs with over hydration (diluted) >Increase occurs with under hydration (concentrated blood volume) >How would Hct change before/after dialysis? >What lab value used to dose epo? Why? >If RBC and Hgb are normal, estimate Hct by multiplying the Hgb times 3. (10 x 3 = 36)
 >Up to 1.")
Reticulocyte Count �Reticulocytes are immature forms of erythrocytes (also called RBC’s) >Up to 1. 5% “normal” in men >Up to 2. 5% “normal” in women >Low retic count seen with folic acid deficiency >High retic count seen when the bone marrow is responding to an increase need for RBC’s. Bone marrow can’t produce enough mature RBC’s fast enough, so it does the next best “thing”, increases the production of immature RBC’s >What would you expect a retic count to be in a person with ESRD on dialysis?
 �RDW >Indicator of variation in the size of red blood")
RDW (RBC Distribution Width) �RDW >Indicator of variation in the size of red blood cells >Values > 14. 5% = RBC vary a lot in size >Immature red cells usually larger >RDW increased in those with ESRD Why? Bone marrow working hard to produce enough red blood cells but can’t produce enough mature cells to keep up with demand.
 >Measures average size of RBC �MCHC")
MCV and MCHC Results �MCV (mean corpuscular volume) >Measures average size of RBC �MCHC (mean corpuscular hemoglobin concentration) >Measures % of hemoglobin in the RBC >Hgb/Hct x 100 �Why should I care about the MCV and MCHC values?
")
What the MCV and MCHC Tells You Test Normal Range MCV (mean corpuscular volume) (size of RBC) MCHC (mean corpuscular hemoglobin concentration) (% RBC in fluid) Value Below Range (Microcytic = small than normal) Value Above Range (Macrocytic = larger than normal) Value Within Range 80 -100 femoliters < 80 = Iron deficiency anemia, congenital anemias > 100 = Folic acid deficiency, B 12 deficiency, myelodysplastic, leukemias 80 -100 = Anemia due to blood loss or a chronic disease 32 -35% > 35% = same as 32 -35% = above Anemia due to blood loss or a chronic disease < 32% = Iron deficiency anemia

Anemia �Case study >E. R. is a 39 y/o Hispanic female. Separated with 3 children, ages 12, 13 and 19 years old. >ESRD of unknown etiology; transplant in 2003. Kidney was from her sister. >Rejection (per renal biopsy) August 2010; restarted dialysis in August 2010. >Receives dialysis via ED every 4 -5 days. >Receives Aranesp every 2 -3 weeks with dialysis.

Putting It All Together � Before looking at lab values, you should be asking…. >What are normal vs. abnormal values? >What information does the abnormal lab values “tell” you? >Are there any alarming/critical lab values?
 4. 00")
CBC Results Test Range Patient = E. R. RBC (red cell count) 4. 00 -5. 20 2. 99 million HGB (hemoglobin) 12 -16 g/dl 9. 2 g/dl HCT (hematocrit) 36 -46 % 26. 9 % Retic count (reticulocyte count) 0. 5% - 1. 5%/2. 5% 3. 0% MCV (mean corpuscular volume) 80 -100 90. 0 -------75% MCHC (mean corpuscular hemoglobin concentration) 31 -37 34. 0%------28% RDW 12 -15 % 18. 0% B 12 193 -900 pg/ml 843 pg/ml Folic Acid 2. 7 – 20. 0 ng/ml > 20 ng/ml

Anemia �Case Study >32 year old male, T. A. , mentally challenge >Lives with his mother >ESRD on hemodialysis 2/2 neurogenic bladder and >Gout >HTN >Sickle cell trait
 4. 00")
CBC Results Test Range Patient = T. A. RBC (red cell count) 4. 00 -5. 20 3. 52 HGB (hemoglobin) 12 -16 g/dl 10. 8 g/dl HCT (hematocrit) 36 -46 % 32. 2 % Retic count (reticulocyte count) 0. 5% - 1. 5%/2. 5% Not reported MCV (mean corpuscular volume) 80 -100 FL 91 FL MCHC (mean corpuscular hemoglobin concentration) 31 -37 g/dl 34 g/dl RDW 12 -15 % 16. 4%

Measuring Iron � Where iron is found � Two tests used to estimate iron stores: Ferritin and Saturation >Ferritin >Is a protein that binds to iron; helps to transport iron in the body >Most ferritin is found in the liver, spleen, muscle and bone marrow with a small amount found in the blood >Normally, 1 ng of ferritin (in blood) = 10 ng of iron stores (in liver, spleen, muscle and bone marrow) >Ferritin is a proxy measure for iron stores and has it ‘s limitations. Image retrieved August 11, 2011 from http: //www. google. com/imgres? q=diagram+iron+stores+body&um. . .

Ferritin � Low ferritin levels usually indicates iron deficiency � High ferritin levels, however…. . >Does not necessarily indicate adequate iron stores >Many factors can increase ferritin levels, e. g. recent iron infusion, infection, inflammation, e. g. autoimmune disorders, malignancy, blood transfusions (250 mg of iron/1 unit packed red cells) >Wait two weeks before measuring iron stores after giving iron load (more than 125 mg/week) >Can become iron toxic (ferritin greater than 1000) >High levels can be due to inherited disorders or too much iron administration >Toxic levels of iron cause organ failure and death
 >Provided")
DRIVE STUDY �Dialysis Patients’ Response to IV iron with elevated ferritin Study (DRIVE) >Provided some clarification for safe upper limits of ferritin levels in hemodialysis patients. >Ferric gluconate (ferrlecit) administration is superior to no iron therapy in anemic dialysis patients receiving epogen and ferritin levels of 500 to 1200 ng/ml and Tsats of <or=25%. Retrieved August 11, 2011 from http: //www. ncbi. nlm. nih. gov/pubmed/17267740? dopt=Abstract

Iron Saturation �Complete name = transferrin iron saturation or Tsat >Estimates ability to bind iron and transport it to various sites in the body >Serum iron / total iron binding capacity X 100 �More sensitive than ferritin; not affected by inflammation/infection

Goal for Iron Stores* HD-CKD ND-CKD/PD-CKD* Ferritin > 200 ng/ml Sats > 20% Ferritin > 100 ng/ml Sats > 20% From KDOQI Anemia Guidelines *No RCT to support recommendation
 >Hemolysis (RBC")
Iron Deficiency �Many causes… >Blood loss >Celiac disease (decreases absorption of iron) >Hemolysis (RBC breaks apart) >Gastric bypass (decreases absorption) >Epogen administration, etc. �Must identify cause of iron deficiency before treating

Look at Entire Picture �Decreasing ferritin/stable sats/decreasing Hgb = iron deficit >? external iron loss >Need more iron �Decreasing ferritin and increasing Hgb = iron moving from storage to hemoglobin (e. g. in response to epogen administration) �Increasing ferritin and decreasing sats and decreasing Hgb = inflammation >Increase ESA dose

Case Study �Case Study >F. L. 86 yo female who attends the anemia/CKD clinic. History significant for…. >HTN >CKD IV >Anemia >Unable to tolerate po iron supplements due to GI upset

Case Study TEST/ INTERVENTION DATE = 11/8/2010 DATE = 12/22/2010 DATE = 1/17/2011 Hemoglobin 8. 8 (decreasing) 7. 7 9. 5 Hematocrit 28. 4 25. 3 30. 9 Saturation none 10% none Ferritin none 33 none BUN 54 (increasing) 55 39 Creatinine 2. 4 (increasing) 2. 35 2. 04 GFR 23 ml/min 24 ml/min 28 ml/min Aranesp dose Increased to 200 mcg

Take Home Points for Anemia and Iron Administration Look at hemoglobin trends >If Hgb is decreasing >Don’t miss other causes of anemia >Increase epogen Look at iron sats and ferritin >If iron sats and ferritin both low, give iron >Remember iron is stored in places we don’t measure, so look at the entire clinical picture

Bone and Mineral Balance Briefly discuss the four primary “players”: >Vitamin D >Calcium >Phosphorus >PTH Discuss the complex interdependence amongst calcium, phosphorus, vitamin D and PTH

Vitamin D 2 -3 �Vitamin D comes from sun, food and our body � 25 -hydroxyvitamin D 2 produced in the liver �Normally kidneys produce an enyzme that converts D 2 to D 3 (1, 25 dihydroxyvitamin = calcitriol)
 >D 2")
Vitamin D �A complex group of fat-soluble substances (D 1 -D 5) >D 2 = ergocalfciferol >Sources >Food—only found in seafood, mushrooms, egg yolks and fortified foods >OTC: Generic Vitamin D >Prescription: Drisdoll >Changed in the liver to 25 -hydroxycholecalciferol (25 -OH) >Measured in those with CKD Stages 3 -5 >25 -OH changed in normal kidneys to 1, 25 dihydroxycholecalciferol >Measured in those with CKD Stage 3 -6

Vitamin D 3 = cholecalciferol >D 3 = 1, 25 dihydroxycholecalciferol >Decreased amounts produced in CKD >Also referred to as active Vitamin D >Sources: Calcitriol (Rocaltrol) Hectoral (doxercalciferol) Zemplar (paricalcitrol) Sunlight (converted to Vitamin D 3 in the skin)

Vitamin D �Lab ranges >25 OH = < 30/32 >1, 25 = 18 -78 >Controversy on what level is normal & too high �What does Vitamin D do? >Helps maintain serum calcium and phosphorus levels/regulates release of calcium and phosphorus from the bone >Increases calcium absorption from the intestines >Suppresses PTH synthesis

Calcium �Functions >Maintains bone structure >Plays a major role in nerve conduction >Assists with muscle contraction/relaxation �Most calcium found in bone �Serum calcium binds to albumin >Serum calcium = 6. 5 Albumin = 2. 5 >0. 8 x (4. 0 -2. 5) + 6. 5 = 7. 7 >Corrected serum calcium more accurate >Corrected total calcium 8. 4 to 9. 5 mg/dl
")
Hypercalcemia �Long term consequences for those with CKD >Increased risk CV calcifications (larger arteries) >Calciphylaxis (soft tissue) �Serum calcium > 13. 0 �Causes >Medications (calcium acetate, zemplar) �S/S of hypercalcemia >Depression, anxiety, muscle weakness, cognitive dysfunction, fatigue, hypertension, constipation >ECG changes/arrhythmias

Hypocalcemia Serum calcium < 6. 5 >Numbness/tingling in perioral area, fingers, toes >Muscle cramps or tetany (muscle spasm or tremors) >Seizures http: //morningreporttgh. blogspot. com/2010/03/h ypocalcemia. html community. wegohealth. com
 >Medications (e. g. Cinacalcet, Hectoral)")
Hypocalcemia Causes >CKD (usually CKD Stages 5 & 6) >Medications (e. g. Cinacalcet, Hectoral) >Rapid correction of acidemia (CO 2 low) during hemodialysis can trigger tetany and seizures >”Hungry Bone Syndrome” after parathyroidectomy >Severe decrease in serum calcium due to abrupt decreased in PTH release; change upsets balance of calcium moving to and from the bones

Phosphorus 85% of phosphorus is found in bone and teeth Has many functions >Helps maintain health bone and teeth >Essential for storage of energy (ATP) >Helps maintain tissues, cells, DNA, and RNA Phosphate = 3. 5 to 5. 5 mg/dl

Hyperphosphatemia Serum levels greater than 12 May be asymptomatic Signs and symptoms, if present >Pruritus, rash, bone and joint pain

Elevated Phosphorus �What is the role of dietary restriction in decreasing serum phosphorus levels? >Much phosphorus is found in high quality protein foods >Need high protein intake to prevent muscle wasting but can limit dairy, some vegetables, processed foods and colas >Goal protein intake = 1 gm protein per kg of body weight per day

Phosphorus and Protein � 70 kg person = 70 gms prot �Breakfast >Two eggs >Two pieces toast �Lunch >Grilled chicken-4 oz >Garden salad-2 cups �Dinner >Steak-4 oz >Green beans-1 cup >Apple-medium, fresh *www. davita. com FOOD PHOS* PROTEIN* Eggs 170 mg 12 gms Bread 60 mg 4 gms Chicken 265 mg 36 gms Garden Salad 340 mg 2 gms Steak 265 mg 32 gms Gr. Beans 25 mg 1 gms Apple 40 mg 0 gms 1355 mg 88 gms

Calculating Phosphorus Balance Intake = 1000 mg per day X 7 days = 7000 mg per week GI tract absorbs 60% of what is consumed >7000 mg X 0. 6 = 4200 mg phosphorus/wk 800 mg eliminated/HD treatment = 2400 mg/wk 4200 – 2400 = 1800 mg Net + phosphorus balance 1800 mg per week >1 Renagel binds about 100 mg phosphorus 1 pill/meal X 100 = 300 x 7 days = 2100 mg/wk 1800 mg – 2100 mg = 300 mg negative balance/wk

Hypophosphatemia Serum levels less than 2. 5 May be asymptomatic Causes >Not eating =>> malnutrition Symptoms, when present >Muscle weakness (e. g. diplopia, dysphagia) >Ventricular arrhythmias >Neuro manifestions (e. g. confusion, coma, seizures) >Poor oxygenation (phosphorus and ATP)

Changes During Progression of CKD Kidneys’ excretion of phosphorus decreases, causing the serum phosphorus to increase Kidney does not reabsorb calcium and vitamin D is not activated, causing decreased serum calcium levels Vitamin D is not activated, causing parathyroid gland hypertrophy and hyperplasia >Decreased serum calcium and increased serum phosphorus levels caused increased secretion of PTH
 deficiency >Hyperphosphatemia")
Changes During Progression of CKD �Kidney dysfunction results in >Calcitriol (Vitamin D) deficiency >Hyperphosphatemia –kidneys no longer excrete phosphate >Decreased Vitamin D and increased phosphorus causes hypocalcemia �Major factors responsible for stimulating PTH are >Hypocalcemia (sensed by receptors on parathyroid gland => increased secretion of PTH) >Decreased vitamin D levels (1, 25 dihydroxyvitamin D = calcitriol) >Hyperphosphatemia

Bone and Mineral Balance

http: //www. medscape. com/viewarticle/518757_2

Treatment Goals – CKD VI � Values Per KDOQI for CKD VI � PTH = 150 to 300 pg/ml (PTH values vary with CKD stage) >Optimal PTH levels in advanced kidney disease not known � Phosphate = 3. 5 to 5. 5 mg/dl � Corrected total calcium 8. 4 to 9. 5 mg/dl � Calcium-phosphate product < 55 mg 2/dl 2 >Larger doses Vitamin D analogs associated with increased calcium and phosphorus � Outcomes >Manage secondary hyperparathyroidism >Manage calcium/phos/vitamin D abnormalities >Minimize vascular calcification

Case Study �S. M. , an 89 yo with HTN, DM, CVA (residual left sided weakness), MVR , CABG and CKD V >Very knowledge about dietary content for potassium and phosphorus >Medications >Coreg, Lotrel, Lasix, Mirtazapine, ASA, MVI, Vitamin D 1000 u/day, calcium acetate 667 mg/meal >Pleasant, alert and oriented >BUN 107, Creatinine 7. 48, GFR 6 ml/min, K 4. 8, CO 2 15 -----Decision made to start dialysis

Lab Values for S. M. LAB TEST/DATE RESULT LAB RANGE Calcium/7. 18. 2011 8. 7 Corrected total calcium 8. 4 to 9. 5 mg/dl Albumin 3. 5 Corrected = 9. 1 Phosphorus/7. 18. 2011 6. 2 3. 5 to 5. 5 mg/dl Vitamin D/4. 25. 2011 25 OH 43. 0 1, 25 OH 17. 0 25 OH >30/32 1, 23 = 18 -78 PTH/4. 25. 2011 327 150 to 300 pg/ml

Take Home Points for BMD Must look at all lab values-calcium, albumin, phosphorus, vitamin D and PTH-to decide if any actions are needed While can “shoot” for stated lab values, getting all labs values within stated goal range can be very difficult Must always consider how the person feels/looks when interpreting lab results

Dialysis Adequacy Used to determine if enough dialysis is being delivered or if blood being “cleaned” enough? Adequate dialysis treatments “replace” less than 15% of normal kidney function/”adequacy” is relative term >Intermittent dialysis (3 x per week) inefficient, only dialyzing out toxins about 7% of the time while the body produces toxins 100% of the time

More About Adequacy �Urea is not the only toxin, yet it is the one we measure >Urea = being water soluble, it is easily measured �However, there are 90 different compounds that are toxins that we don’t measure. Many of these compounds are more toxic than urea. >No current measure of adequacy for these different toxins �Conventional dialysis has its limitations: >It removes urea (small, water soluble molecules) >Weekly clearance of urea = about 1/6 th of normal physiologic clearance (what would be cleared by healthy kidneys) >28% of toxins are protein bound and not easily removed by dialysis Yavuz, et al (2005)
 loss")
Dialysis Adequacy is important since under-dialysis can cause: >Weakness and fatigue >Weight (muscle) loss > Nausea, decreased appetite > Sleep disturbances

How Is Adequacy Determine? Three methods used to calculate adequacy: >URR = Urea Reduction Ratio (HD) >Kt/V (HD and PD) >PET = Peritoneal Equilibration Test (PD)
 URR is one measure of how effectively a hemodialysis treatment")
URR (Urea Reduction Ratio) URR is one measure of how effectively a hemodialysis treatment has removed urea from the blood Formula: pre. BUN – post. BUN X 100 = pre. BUN 94 (pre) – 32 (post) / 94 (pre) x 100 = 65. 9% URR
 No one percentage (URR) represents adequate dialysis. However, people usually")
URR (Urea Reduction Ratio) No one percentage (URR) represents adequate dialysis. However, people usually live longer and have fewer hospitalizations if URR >= 60% >So, if no one number determines adequate dialysis, how does one choose a URR goal? Usually measured once per month

Kt/V �Also measures how much urea is removed during dialysis, but takes into account two additional factors: >Urea made by the body during dialysis >Urea removed during dialysis along with excess fluid �Goals* (many different values found in literature) >For CAPD, Kt/V = 2. 0 >Kt/V = 1. 7 is minimal dose >For HD (adults and peds), Kt/V = 1. 2 is minimal dose >As little as 3% residual renal function can increase the Kt/V calculation from 1. 2 to 1. 65 *KDOQI

Kt/V SYMBOL EXPLANATION K Rate at which blood passes through the dialyzer in ml/min t Time (expressed in minutes) Kt Volume of blood cleared of urea during one dialysis treatment V Volume of water in a person’s body

Calculating Kt/V* �Example >Dialyzer’s clearance = 400 ml/min >Treatment time = 210 min (3. 5 hours) >Kt = 400 ml/min x 210 min = 84, 000 ml (84 L) >V = volume >Weight = 70 kg. 60% body water (average) >70 kg. x. 60 = 42 >Kt/V = 84/42 = 2. 0 >Would you/could you make any dialysis changes? *http: //kidney. niddk. nih. gov/kudiseases/pubs/hemodialys is dose
/2. 0 (achieved)")
Changing the Kt/V of 2. 0 is too much >1. 2 (goal)/2. 0 (achieved) = 0. 6 >3. 5 -. 6 = 2. 9 hours (decrease from 3. 5 hours) Increasing the t (time) >if the Kt/V is 0. 9 but the goal is 1. 2: 1. 2/0. 9 = 1. 33 or 1. 33 times more Kt needed 3 hours (current) x 1. 33 = 4 hours

Difference Between URR and Kt/V is more accurate then URR >URR measures urea removed during dialysis >Kt/V adds the amount of urea removed with excess fluid More weight loss during dialysis will yield a higher Kt/V for the same URR may be lower than usual if large volume removed Kt/V of 1. 2 ~ URR 63%

How Can Clearance of Toxins Be Increased? For both Kt/V and URR…. >Increased the blood flow (Qb) >Increase treatment time >Use a larger dialyzer >Increased dialysis solution flow rate (Qd) >600 ml/min to 800 ml/min >Assess access &/or needle placement for problems

Nocturnal/Home Dialysis Nocturnal >3 x/week, decreased blood flows, longer treatment times Home Dialysis >5 -6 times per week, shorter treatment times Since both treatment modalities lead to feeling better/improved lab results; challenges current concepts of “adequacy”
 �Transport of substances is a function of peritoneal membrane area")
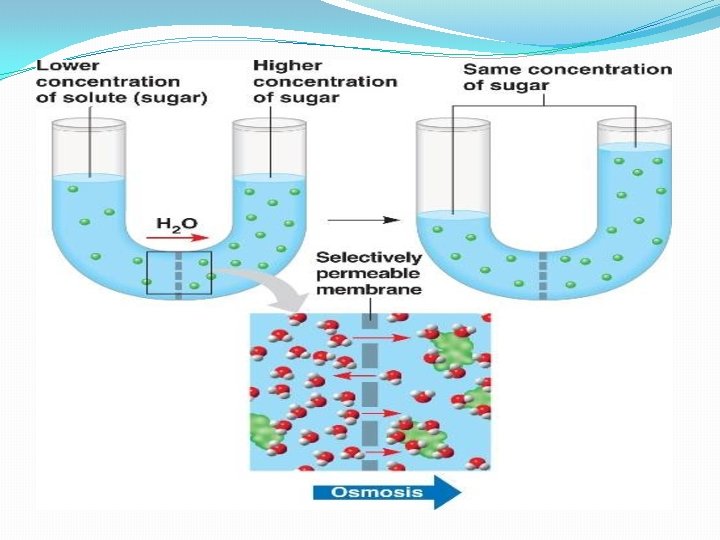
PET (Peritoneal Equilibrium Test) �Transport of substances is a function of peritoneal membrane area times permeability, so a test is useful to determine the function of the peritoneal membrane >Assesses rate at which solutes (substance dissolved in fluid) equilibrate between the peritoneal capillary blood and dialysate >Solutes = creatinine, urea, phosphate, proteins commonly measured >Dextrose concentration responsible for UF

Diffusion

PET �Standardized 4 -hour procedure >Measures dialysate creatinine and glucose levels at 0, 2 and 4 hours after dialysis solution is infused into the abdomen and serum creatinine and glucose levels at any time during the test. >Performed several weeks after PD initiated and when clinical problems arise, e. g. suspect altered membrane transport

PET �Transport rates assessed by calculating the rates when equilibrium is reached between the peritoneal blood and dialysate >D/P ratio = solute concentration in dialysate/ solute concentration in plasma (blood) >D/DO = Decrease in dialysate glucose concentration over time �Expressed as standard deviation (SD)—SD tells you how much variation from the average
 Dialysate Glucose 0 hour 1979 2 hour 1004 4 hour")
PET (Peritoneal Equilibration Test) Dialysate Glucose 0 hour 1979 2 hour 1004 4 hour 732 Glucose D/D 0 1. 000 0. 507 0. 370 Dialysate Creatinine 0 hour 0. 5 2 hour 4. 5 4 hour 6 Creat. D/P 0. 063 0. 563 0. 750 Serum Creatinine @ 2 hrs = 8 Serum Glucose 257
")
PET (Peritoneal Equilibration Test)

Rapid Transporters �Those with high rates of diffusion/osmosis >Transport small molecules (e. g. urea, creatinine, glucose) quickly >Leads to equilibration between dialysate and blood early in the dwell >If fluid left in peritoneum, it will be continuously absorbed by the lymphatics, potentially leading to poor UF and volume expansion >Do best with short dwell times >May benefit from icodextrin dialysate solution >Poorly absorbed so osmotic gradient maintained

Decreased Clearance? Increasing BUN and creatinine could be due to: >Poor compliance >High protein intake or metabolic acidosis >Decreased peritoneal permeability >Slow transporter >UF continues through out the dwell; clearance continues through out long dwell exchange >Increase inflow dialysate volumes to increase clearance

Interpreting PET Results If clearance unchanged but UF decreased >Could be due to increased lymph absorption or catheter malfunction If PET shows increased clearance >? Peritonitis >If UF inadequate ? membrane failure If PET shows decreased clearance and decreased UF >? membrane failure
")
PET �Test can be used to: >Predict dialysis dose (# cycles and dwell duration) >Help choose peritoneal dialysis regimen >Classify peritoneal dialysis transport (rapid and slow transporters) >Calculate creatinine clearance >CCL = (D/P) X V �Peritoneal characteristics change over time >Peritonitis—problems with UF common due to increase glucose absorption that occurs during infection

Take Home Points For Adequacy �While we can measure urea, it is one of the less toxic waste products. Currently there is no way to measure all the toxins that accumulate in the blood. �While Kt/V and URR help us to measure outcomes, they have limitations. �In the end, it is as important to look at the entire clinical picture as it is to calculate Kt/V and URR. >How does the person feel? >Is his/her weight stable? �PET results can help >Determine dwell times and # cycles needed to clear toxins. >Confirm impending membrane failure.


References � Coyne, D. W. , Kapoian, T. , Suki, W. , Singh, A. K. , Moran, J. E. , Dahl, N. V. , and Rizkala, A. R (2007). Ferric gluconate is highly efficacious in anemic hemodialysis patients with high serum and low transferrin saturation: results of the Dialysis Patients’ Response to IV Iron with Elevated Ferritin (DRIVE) Study. Journal of American Society of Nephrology, (3), 975 -984. �Http: //kidney. niddk. nih. gov, kudiseases/pubs/hemodialysisdose retrieved August 16, 2011. � KDOQI Clinical Practice Guidelines and Clinical Practice Recommendations for Anemia in Chronic Kidney Disease. Retrieved August 25, 2011 from http: //www. kidney. org/professional/kdoqi/guidelines_anemia/cpr 32. h tm

References �KDOQI Clinical Practice Guidelines and Clinical Practice Recommendations for Anemia in Chronic Kidney Disease: 2007 Update of Hemoglobin Target. Retrieved August 25, 2011 from http: //www. kidney. org/professional/kdoqi/guidelines_ane mia/cpr 21. htm �KDOQI Clinical Practice Guidelines and Clinical Practice Recommendations 2006 Updates for Hemodialysis Adequacy and Peritoneal Adequacy. Retrieved August 16, 2011 from http: /www. kidney. org/professional/kdoqi/guidelines/guid eline_update HD_PD/pd_guide 2. htm
. Red blood cell")
Referrences �Ly, J. , Marticorean, R. , Donnelly S. , (2004). Red blood cell survival in chronic renal failure. American Journal of Kidney Diseases, 44(4), 715 -719. �National Kidney Foundation (2001). KDOQI clinical practice guidelines for hemodialysis adequacy. American Journal of Kidney Diseases, 37, supp 1, S 7 -64.

References Yavuz, A. , Tetta, C. , Ersoy, F. , D’initin, V. , Ratanaret, R. , De Cal, M. , Borello, M. , Bordoni, V. , Savatori, G. , Andrikes, E. , Yakapoglu, E. , Levin, N. , & Ronco, C. , (2005) Uremic toxins: A new focus on an old subject. Seminars in Dialysis, 18 (3), 203 -212.
- Slides: 86