Elasticity measure of responsiveness that tells us how


 Supply curve")


")

- Slides: 22
Elasticity – measure of responsiveness that tells us how a dependent variable such as quantity responds to a change in an independent variable such as price. Can be applied to income, quantity of a product supplied by a firm or demand.
Demand Elasticity In case of demand, consider whether a given change in a price will cause a relatively larger, a relatively smaller, or a proportional change in quantity demanded. Consumers are very sensitive to prices. Demand elasticity is the extent to which a change in price causes a change in the quantity demanded.
Elasticity tells us How sensitive consumers are to these changes.
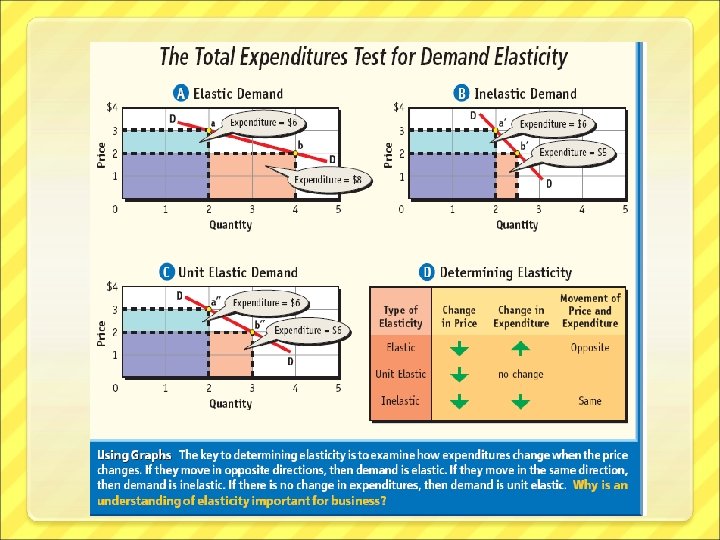
Demand is. . . Elastic when a given change in price causes a relative larger change in quantity demanded. (example: fresh vegetables. Because there are more in the summer, consumers increase the amount they purchase. When we have higher prices in winter, we buy fewer fresh vegetables & use canned products instead. ) Inelastic demand is when a given change in price causes a relatively smaller change in the quantity demanded. (example: sale)
Demand is. . . Unit elastic when a given change in price causes a proportional change in quantity demanded. In other words: the percent change in quantity roughly equals the percent change in price.
Elastic Demand
Inelastic demand
Perfectly In. Elastic
Perfectly Elastic
Determinants of Demand Elasticity Can the Purchase Be Delayed If purchase cannot be put off, demand is inelastic. If purchase can be delayed, demand is elastic. Examples: Insulin – inelastic; tobacco (addictive) – inelastic; corn, tomatoes – elastic; gas at a particular station – elastic. If you can delay purchase, demand is elastic.
Determinants of Demand Elasticity Are Adequate Substitutes Available? If yes, consumers can switch back & forth to take advantage of the best price. Substitutes – butter, margerine; substitutes for beef; substitutes for chicken; The fewer the substitutes, the more inelastic demand is.
Determinants of Demand Elasticity Does the purchase use a large portion of income? If yes, demand tends to be elastic. If no, demand tends to be inelastic. Medical services tends to be inelastic even though they take a large portion of income.
What is supply? Supply is: The amount of a product that would be offered for sale at all possible prices that could prevail in the market. Law of Supply says: Suppliers will normally offer more for sale at high prices and less at lower prices.
Suppliers have to decide: How much to offer for sale at various prices This is a decision that is best for the individual seller. What’s best depends on the cost of producing the goods or services. Concept of supply can be listed in a table or a graph – supply schedule or supply curve.
Supply What’s a supply schedule? Listing of various quantities of a particular product supplied at all possible prices in the market. Individual supply curve – a graph showing the various quantities supplied at each and every price that might prevail in the market. Market supply curve – shows the quantities offered at various prices by all firms that offer the product for sale in a given market.
Illustration of Supply Schedule & Supply Curve Individual and Market (page 114) Supply curve slopes from lower left-hand corner of the graph to the upper right hand corner. It’s a positive slope & shows that if one of the values goes up, the other will go up too. We could be suppliers too – supplying labor – doesn’t have to be products.
Change in Quantity Supplied Quantity supplied is amount that producers bring to market at any given price. Change in quantity supplies is the change in amount offered for sale in response to a change in price.
Good morning! There are 6 factors that can cause a change in supply. List them on your sheet of paper.
Change in Supply Change in Cost of inputs (labor prices increase/decrease – workers’ salaries) Increase/decrease in productivity Technology (new machine, tool that can get the job done more efficiently) Taxes/Subsidies Firms view taxes as a cost – could be a fee like a license Subsidy is a government payment to an individual, business or other group.
Changes in Supply Change in Supplier Expectations Change in expectation of future price of a product Government Regulations Tarif/excise tax; EPA Number of Sellers