Efficiently Clustering Transactional data with Weighted Coverage Density
- Slides: 24
Efficiently Clustering Transactional data with Weighted Coverage Density M. Hua Yan , Keke Chen, and Ling Liu Proceedings of the 15 th International Conference on Information and Knowledge Management, ACM CIKM, 2006 2020/9/24 報告人: 吳建良 1
Outline n n n Motivation SCALE Framework BKPlot Method WCD Clustering Algorithm Cluster Validity Evaluation Experimental Results 2
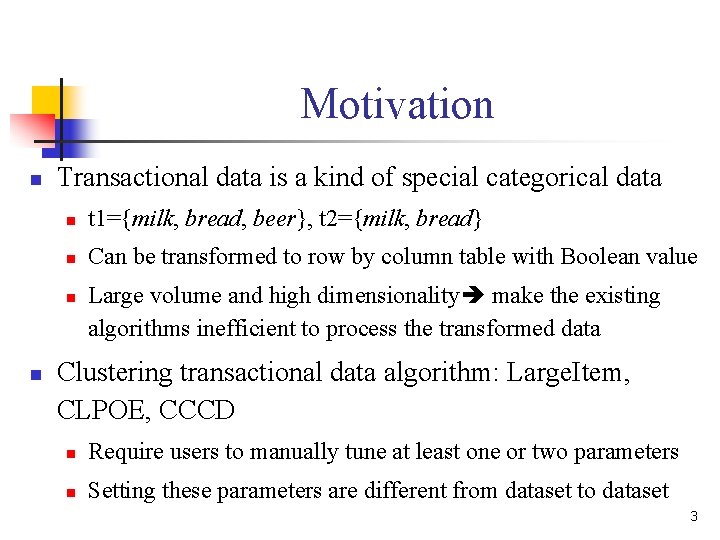
Motivation n Transactional data is a kind of special categorical data n t 1={milk, bread, beer}, t 2={milk, bread} n Can be transformed to row by column table with Boolean value n n Large volume and high dimensionality make the existing algorithms inefficient to process the transformed data Clustering transactional data algorithm: Large. Item, CLPOE, CCCD n Require users to manually tune at least one or two parameters n Setting these parameters are different from dataset to dataset 3
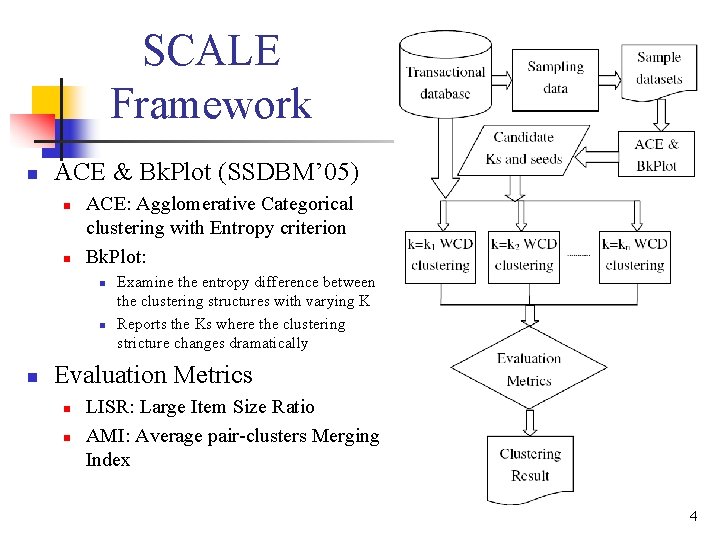
SCALE Framework n ACE & Bk. Plot (SSDBM’ 05) n n ACE: Agglomerative Categorical clustering with Entropy criterion Bk. Plot: n n n Examine the entropy difference between the clustering structures with varying K Reports the Ks where the clustering stricture changes dramatically Evaluation Metrics n n LISR: Large Item Size Ratio AMI: Average pair-clusters Merging Index 4
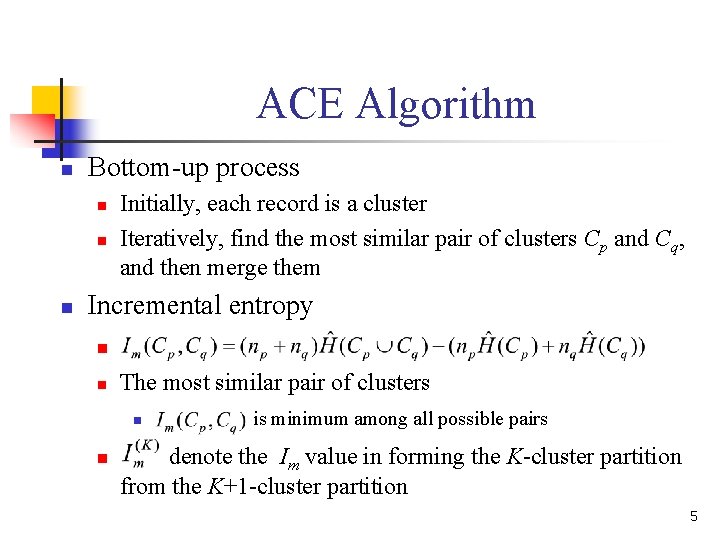
ACE Algorithm n Bottom-up process n n n Initially, each record is a cluster Iteratively, find the most similar pair of clusters Cp and Cq, and then merge them Incremental entropy n n The most similar pair of clusters n n is minimum among all possible pairs denote the Im value in forming the K-cluster partition from the K+1 -cluster partition 5
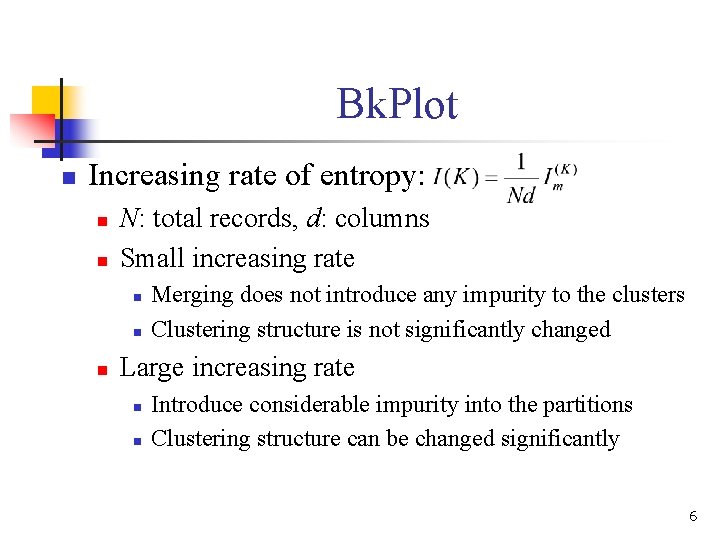
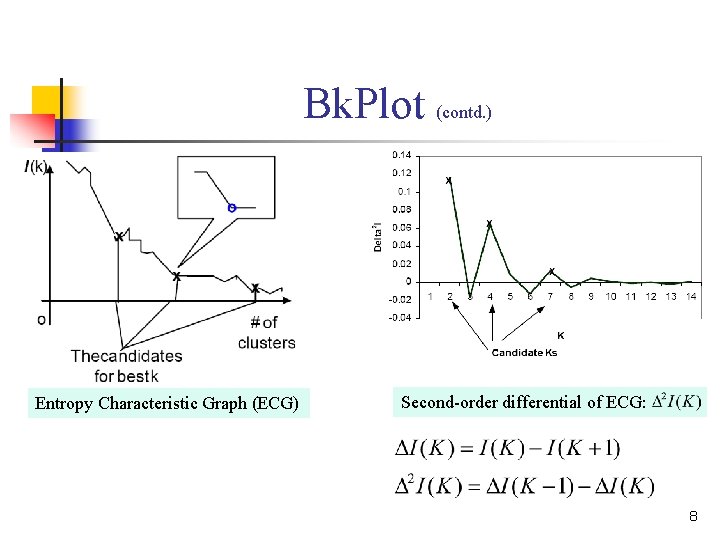
Bk. Plot n Increasing rate of entropy: n n N: total records, d: columns Small increasing rate n n n Merging does not introduce any impurity to the clusters Clustering structure is not significantly changed Large increasing rate n n Introduce considerable impurity into the partitions Clustering structure can be changed significantly 6
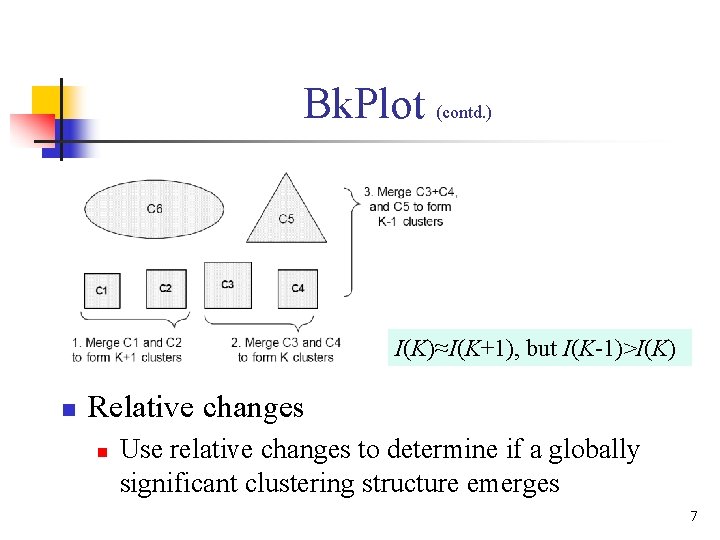
Bk. Plot (contd. ) I(K)≈I(K+1), but I(K-1)>I(K) n Relative changes n Use relative changes to determine if a globally significant clustering structure emerges 7
Bk. Plot (contd. ) Entropy Characteristic Graph (ECG) Second-order differential of ECG: 8
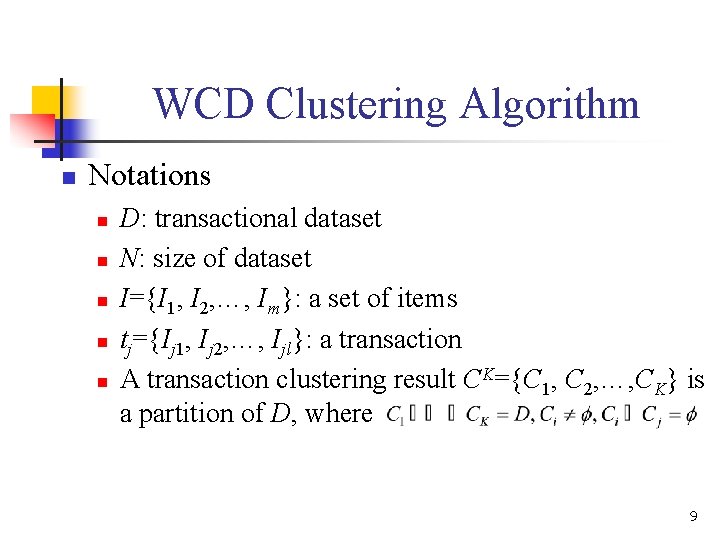
WCD Clustering Algorithm n Notations n n n D: transactional dataset N: size of dataset I={I 1, I 2, …, Im}: a set of items tj={Ij 1, Ij 2, …, Ijl}: a transaction A transaction clustering result CK={C 1, C 2, …, CK} is a partition of D, where 9
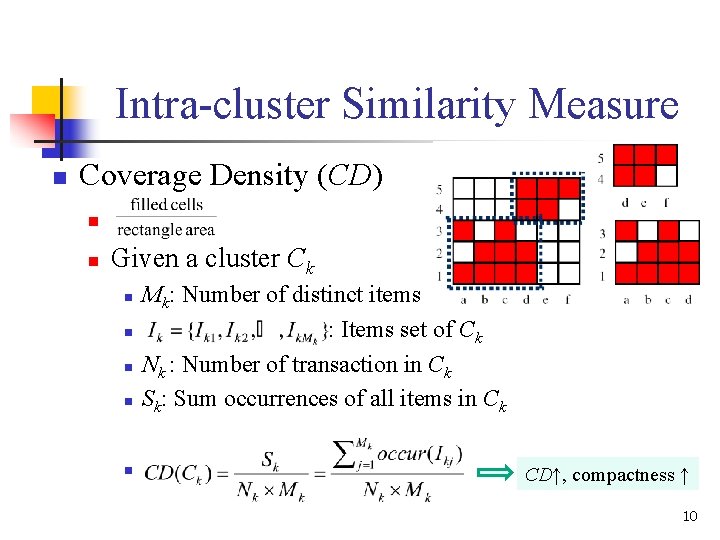
Intra-cluster Similarity Measure n Coverage Density (CD) n n Given a cluster Ck n n n Mk: Number of distinct items : Items set of Ck Nk : Number of transaction in Ck Sk: Sum occurrences of all items in Ck CD↑, compactness ↑ 10
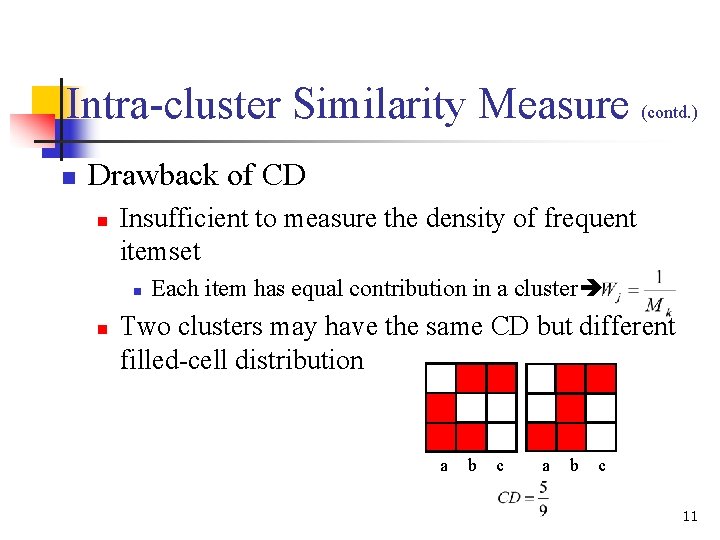
Intra-cluster Similarity Measure (contd. ) n Drawback of CD n Insufficient to measure the density of frequent itemset n n Each item has equal contribution in a cluster Two clusters may have the same CD but different filled-cell distribution a b c 11
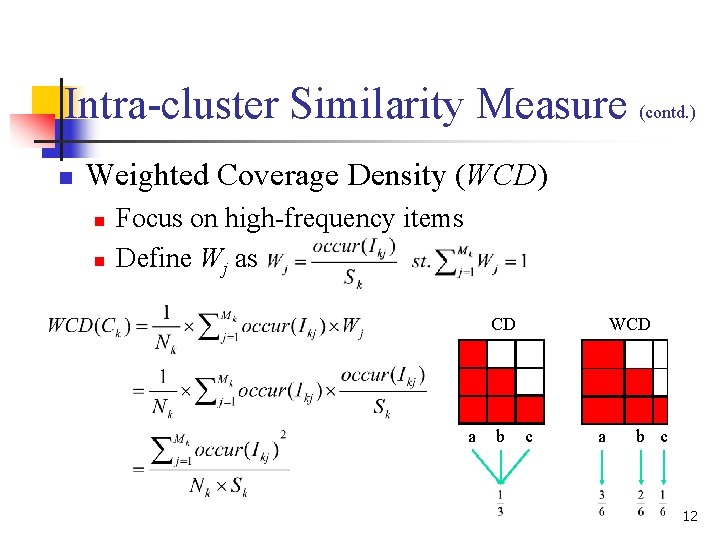
Intra-cluster Similarity Measure (contd. ) n Weighted Coverage Density (WCD) n n Focus on high-frequency items Define Wj as CD a b WCD c a b c 12
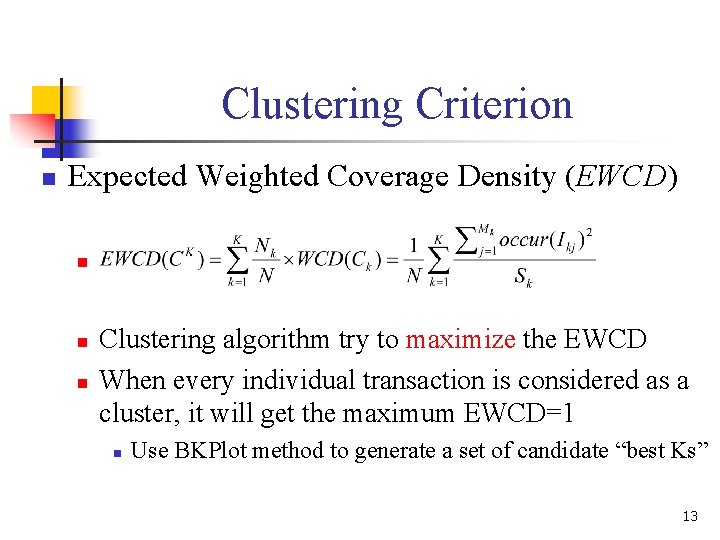
Clustering Criterion n Expected Weighted Coverage Density (EWCD) n n n Clustering algorithm try to maximize the EWCD When every individual transaction is considered as a cluster, it will get the maximum EWCD=1 n Use BKPlot method to generate a set of candidate “best Ks” 13
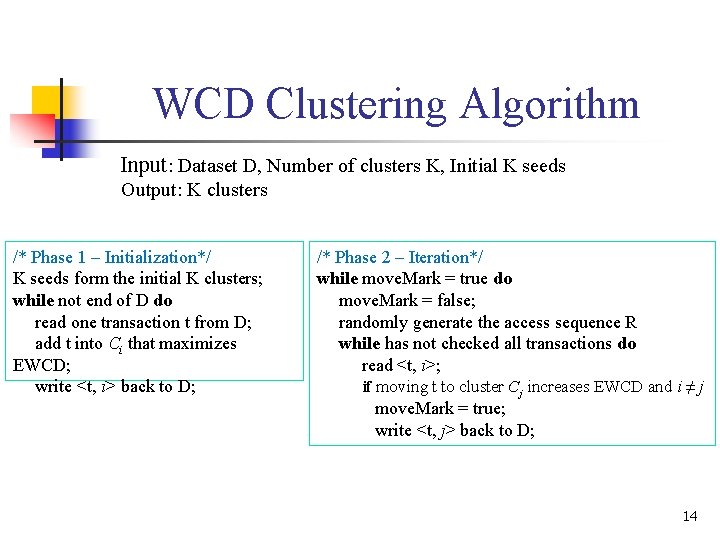
WCD Clustering Algorithm Input: Dataset D, Number of clusters K, Initial K seeds Output: K clusters /* Phase 1 – Initialization*/ K seeds form the initial K clusters; while not end of D do read one transaction t from D; add t into Ci that maximizes EWCD; write <t, i> back to D; /* Phase 2 – Iteration*/ while move. Mark = true do move. Mark = false; randomly generate the access sequence R while has not checked all transactions do read <t, i>; if moving t to cluster Cj increases EWCD and i ≠ j move. Mark = true; write <t, j> back to D; 14
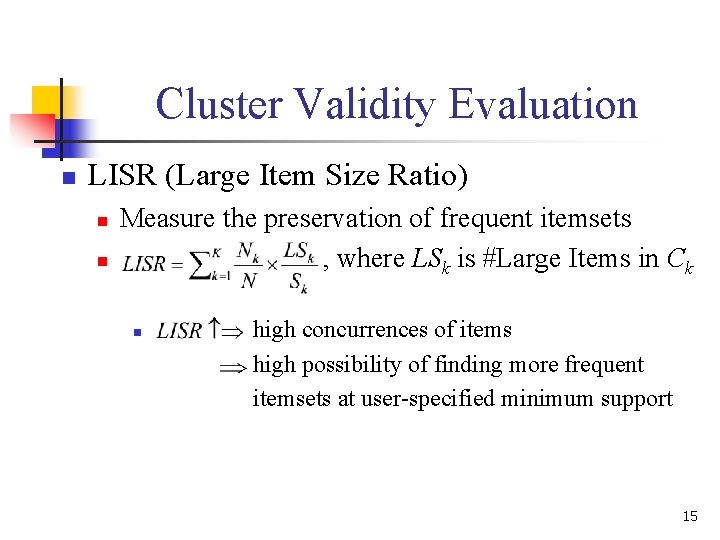
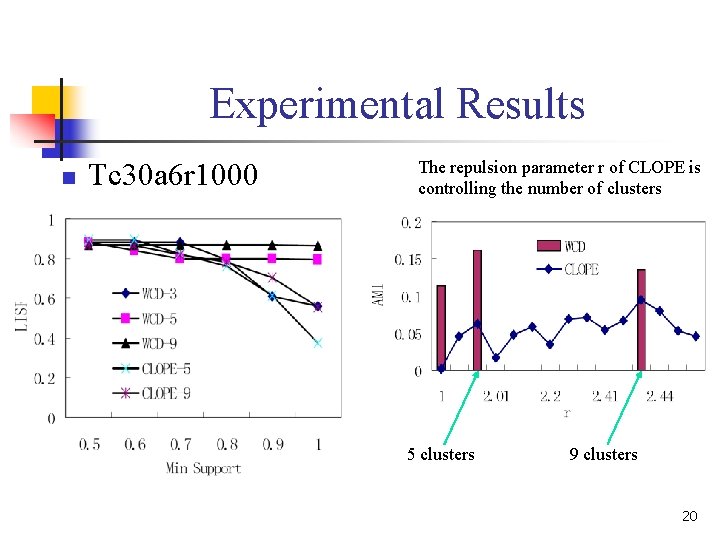
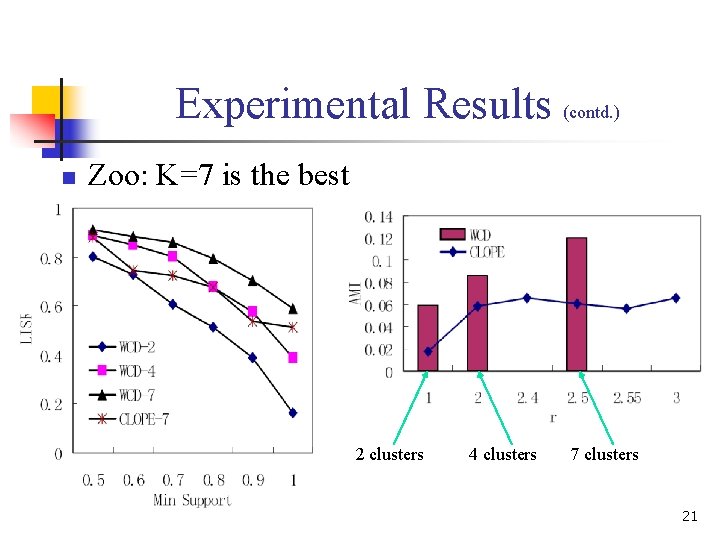
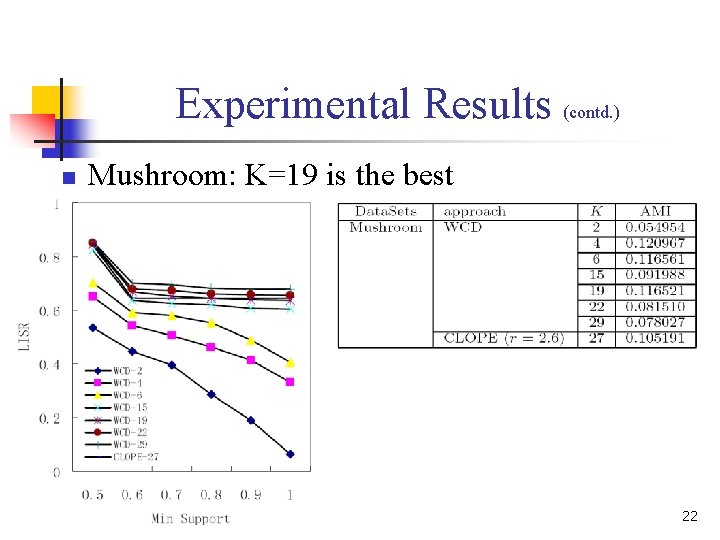
Cluster Validity Evaluation n LISR (Large Item Size Ratio) n n Measure the preservation of frequent itemsets , where LSk is #Large Items in Ck n high concurrences of items high possibility of finding more frequent itemsets at user-specified minimum support 15
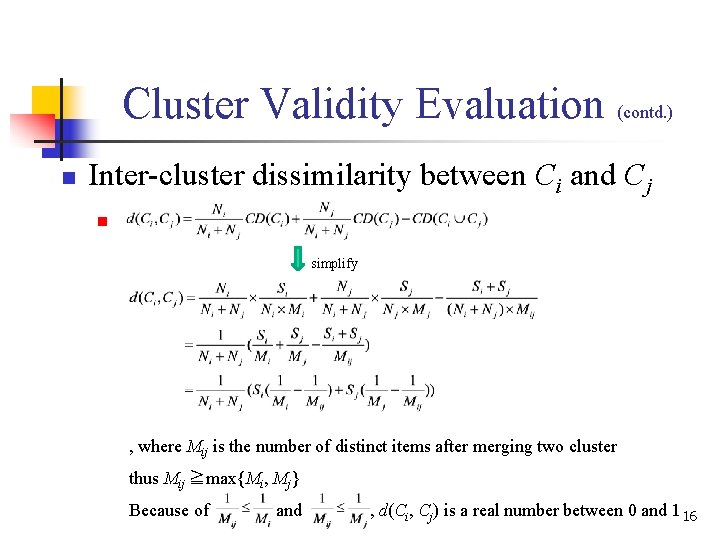
Cluster Validity Evaluation (contd. ) n Inter-cluster dissimilarity between Ci and Cj n simplify , where Mij is the number of distinct items after merging two cluster thus Mij ≧max{Mi, Mj} Because of and , d(Ci, Cj) is a real number between 0 and 1 16
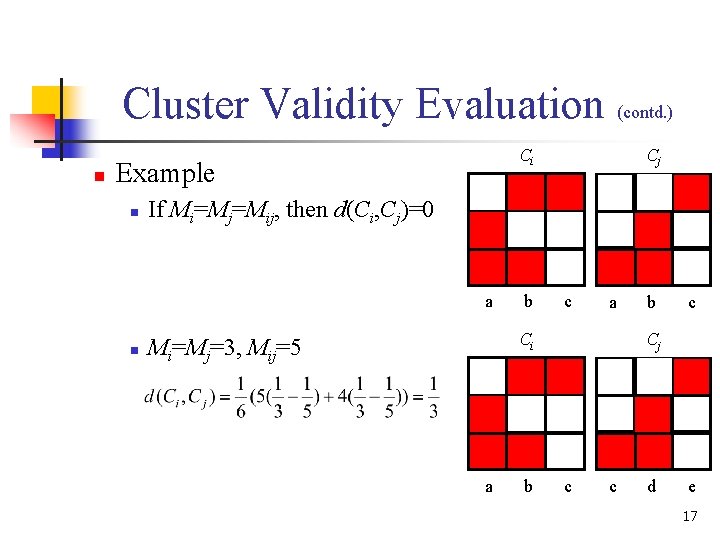
Cluster Validity Evaluation (contd. ) n Ci Example n If Mi=Mj=Mij, then d(Ci, Cj)=0 a n Cj b c a Ci Mi=Mj=3, Mij=5 a b b c Cj c c d e 17
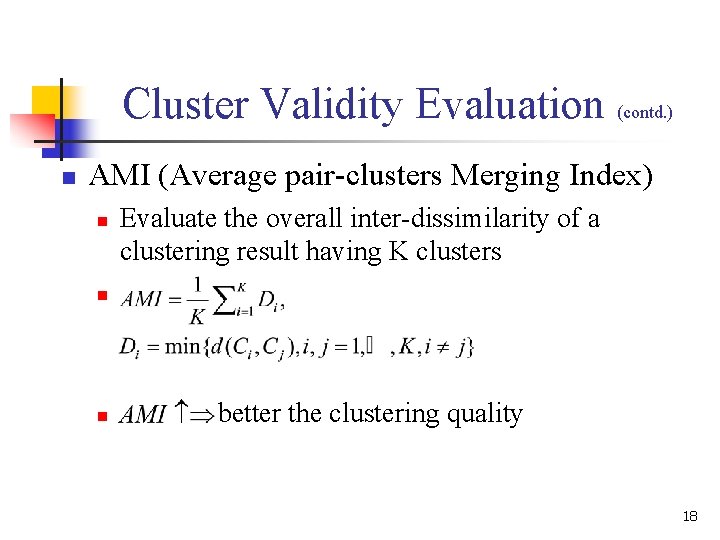
Cluster Validity Evaluation (contd. ) n AMI (Average pair-clusters Merging Index) n Evaluate the overall inter-dissimilarity of a clustering result having K clusters n n better the clustering quality 18
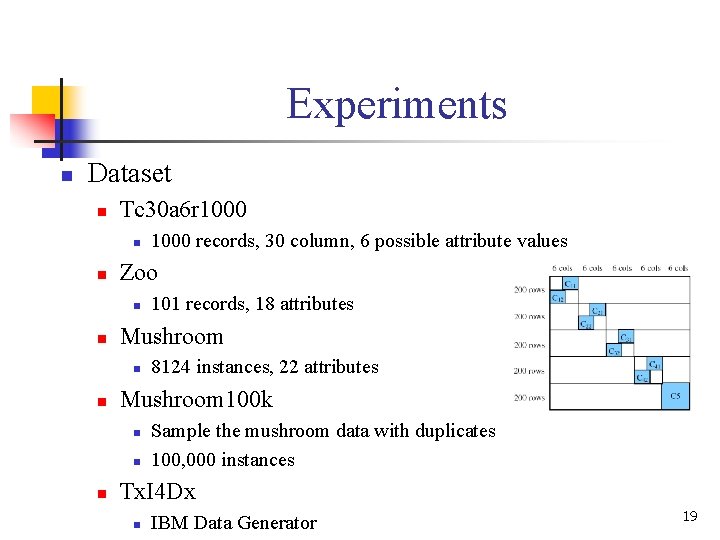
Experiments n Dataset n Tc 30 a 6 r 1000 n n Zoo n n 8124 instances, 22 attributes Mushroom 100 k n n n 101 records, 18 attributes Mushroom n n 1000 records, 30 column, 6 possible attribute values Sample the mushroom data with duplicates 100, 000 instances Tx. I 4 Dx n IBM Data Generator 19
Experimental Results n Tc 30 a 6 r 1000 The repulsion parameter r of CLOPE is controlling the number of clusters 5 clusters 9 clusters 20
Experimental Results (contd. ) n Zoo: K=7 is the best 2 clusters 4 clusters 7 clusters 21
Experimental Results (contd. ) n Mushroom: K=19 is the best 22
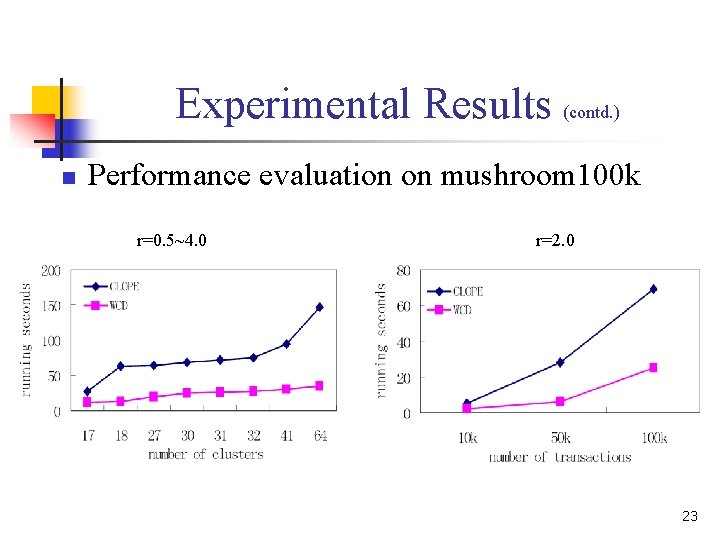
Experimental Results (contd. ) n Performance evaluation on mushroom 100 k r=0. 5~4. 0 r=2. 0 23
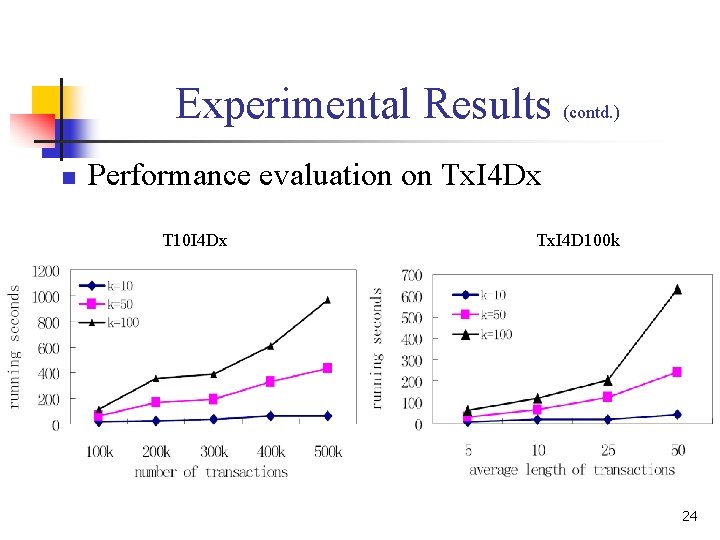
Experimental Results (contd. ) n Performance evaluation on Tx. I 4 Dx T 10 I 4 Dx Tx. I 4 D 100 k 24