EE 313 Linear Systems and Signals Fall 2018
- Slides: 16
EE 313 Linear Systems and Signals Fall 2018 Sampling and Aliasing Prof. Brian L. Evans Dept. of Electrical and Computer Engineering The University of Texas at Austin Textbook: Mc. Clellan, Schafer & Yoder, Signal Processing First, 2003 Lecture 5 http: //www. ece. utexas. edu/~bevans/courses/signals
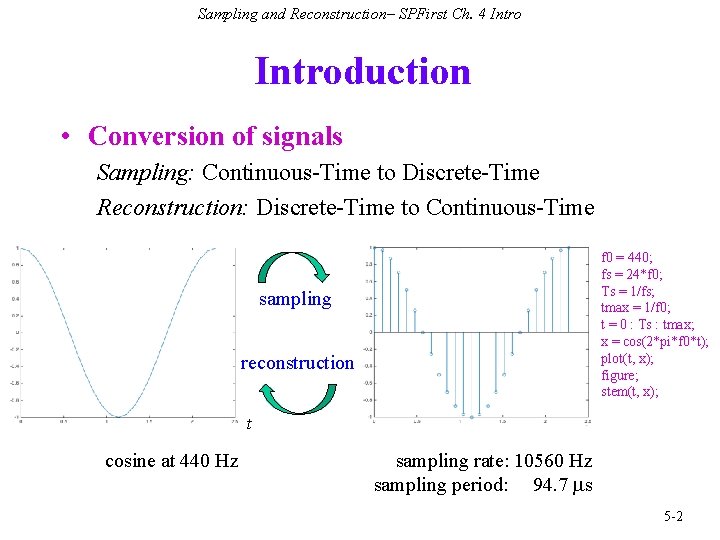
Sampling and Reconstruction– SPFirst Ch. 4 Introduction • Conversion of signals Sampling: Continuous-Time to Discrete-Time Reconstruction: Discrete-Time to Continuous-Time f 0 = 440; fs = 24*f 0; Ts = 1/fs; tmax = 1/f 0; t = 0 : Ts : tmax; x = cos(2*pi*f 0*t); plot(t, x); figure; stem(t, x); sampling reconstruction t cosine at 440 Hz sampling rate: 10560 Hz sampling period: 94. 7 ms 5 -2
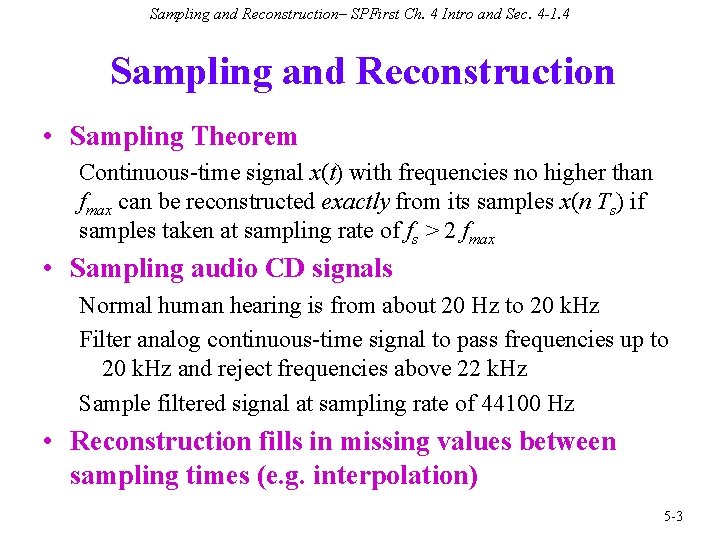
Sampling and Reconstruction– SPFirst Ch. 4 Intro and Sec. 4 -1. 4 Sampling and Reconstruction • Sampling Theorem Continuous-time signal x(t) with frequencies no higher than fmax can be reconstructed exactly from its samples x(n Ts) if samples taken at sampling rate of fs > 2 fmax • Sampling audio CD signals Normal human hearing is from about 20 Hz to 20 k. Hz Filter analog continuous-time signal to pass frequencies up to 20 k. Hz and reject frequencies above 22 k. Hz Sample filtered signal at sampling rate of 44100 Hz • Reconstruction fills in missing values between sampling times (e. g. interpolation) 5 -3
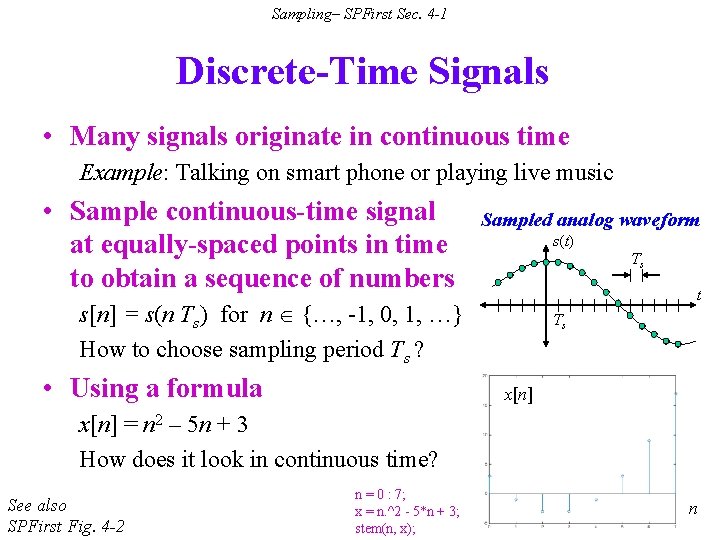
Sampling– SPFirst Sec. 4 -1 Discrete-Time Signals • Many signals originate in continuous time Example: Talking on smart phone or playing live music • Sample continuous-time signal at equally-spaced points in time to obtain a sequence of numbers Sampled analog waveform s(t) Ts t s[n] = s(n Ts) for n {…, -1, 0, 1, …} How to choose sampling period Ts ? • Using a formula Ts x[n] = n 2 – 5 n + 3 How does it look in continuous time? See also SPFirst Fig. 4 -2 n = 0 : 7; x = n. ^2 - 5*n + 3; stem(n, x); 5 -4 n
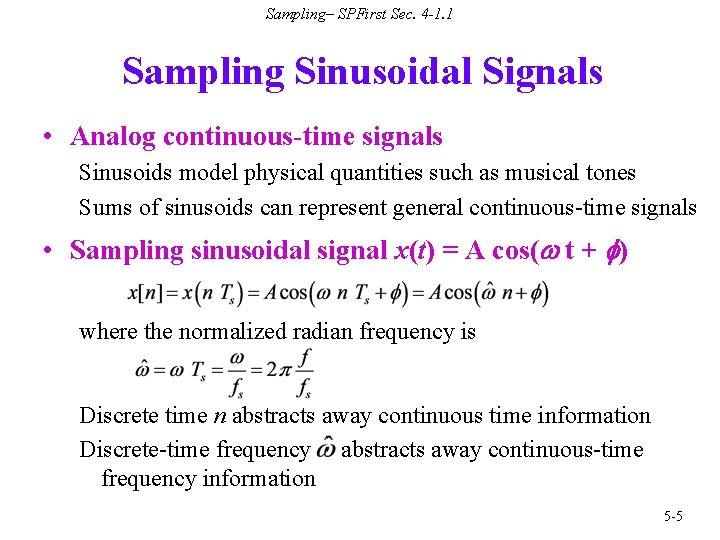
Sampling– SPFirst Sec. 4 -1. 1 Sampling Sinusoidal Signals • Analog continuous-time signals Sinusoids model physical quantities such as musical tones Sums of sinusoids can represent general continuous-time signals • Sampling sinusoidal signal x(t) = A cos(w t + f) where the normalized radian frequency is Discrete time n abstracts away continuous time information Discrete-time frequency abstracts away continuous-time frequency information 5 -5
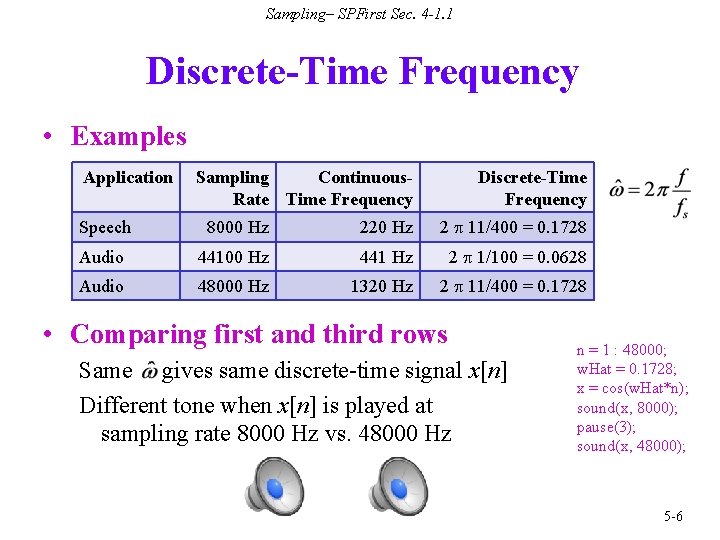
Sampling– SPFirst Sec. 4 -1. 1 Discrete-Time Frequency • Examples Application Sampling Continuous. Rate Time Frequency Discrete-Time Frequency Speech 8000 Hz 220 Hz 2 p 11/400 = 0. 1728 Audio 44100 Hz 441 Hz 2 p 1/100 = 0. 0628 Audio 48000 Hz 1320 Hz 2 p 11/400 = 0. 1728 • Comparing first and third rows Same gives same discrete-time signal x[n] Different tone when x[n] is played at sampling rate 8000 Hz vs. 48000 Hz n = 1 : 48000; w. Hat = 0. 1728; x = cos(w. Hat*n); sound(x, 8000); pause(3); sound(x, 48000); 5 -6
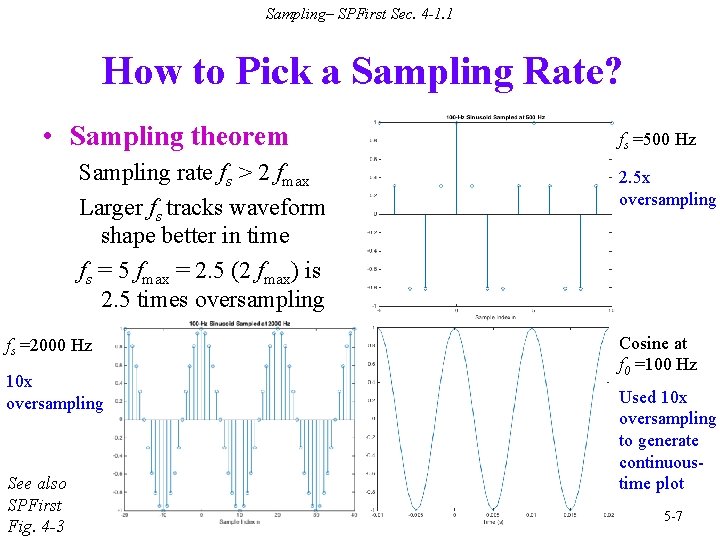
Sampling– SPFirst Sec. 4 -1. 1 How to Pick a Sampling Rate? • Sampling theorem Sampling rate fs > 2 fmax Larger fs tracks waveform shape better in time fs = 5 fmax = 2. 5 (2 fmax) is 2. 5 times oversampling fs =2000 Hz 10 x oversampling See also SPFirst Fig. 4 -3 fs =500 Hz 2. 5 x oversampling Cosine at f 0 =100 Hz Used 10 x oversampling to generate continuoustime plot 5 -7
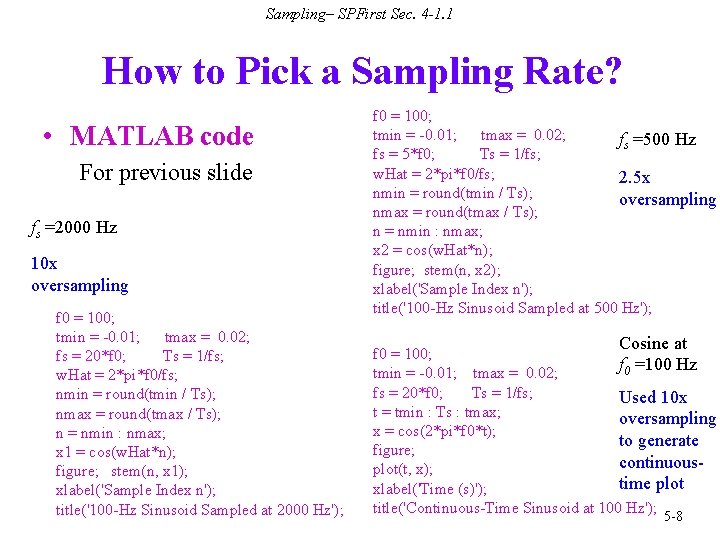
Sampling– SPFirst Sec. 4 -1. 1 How to Pick a Sampling Rate? • MATLAB code For previous slide fs =2000 Hz 10 x oversampling f 0 = 100; tmin = -0. 01; tmax = 0. 02; fs = 20*f 0; Ts = 1/fs; w. Hat = 2*pi*f 0/fs; nmin = round(tmin / Ts); nmax = round(tmax / Ts); n = nmin : nmax; x 1 = cos(w. Hat*n); figure; stem(n, x 1); xlabel('Sample Index n'); title('100 -Hz Sinusoid Sampled at 2000 Hz'); f 0 = 100; tmin = -0. 01; tmax = 0. 02; fs =500 Hz fs = 5*f 0; Ts = 1/fs; w. Hat = 2*pi*f 0/fs; 2. 5 x nmin = round(tmin / Ts); oversampling nmax = round(tmax / Ts); n = nmin : nmax; x 2 = cos(w. Hat*n); figure; stem(n, x 2); xlabel('Sample Index n'); title('100 -Hz Sinusoid Sampled at 500 Hz'); Cosine at f 0 = 100; f 0 =100 Hz tmin = -0. 01; tmax = 0. 02; fs = 20*f 0; Ts = 1/fs; Used 10 x t = tmin : Ts : tmax; oversampling x = cos(2*pi*f 0*t); to generate figure; continuousplot(t, x); time plot xlabel('Time (s)'); title('Continuous-Time Sinusoid at 100 Hz'); 5 -8
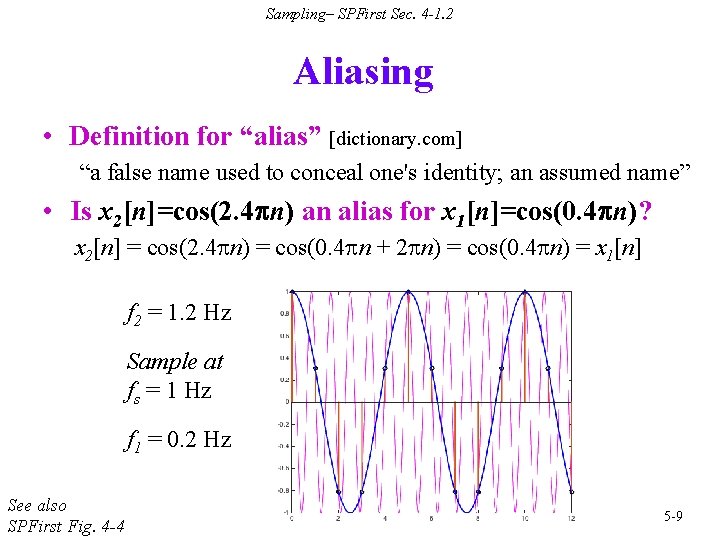
Sampling– SPFirst Sec. 4 -1. 2 Aliasing • Definition for “alias” [dictionary. com] “a false name used to conceal one's identity; an assumed name” • Is x 2[n]=cos(2. 4 pn) an alias for x 1[n]=cos(0. 4 pn)? x 2[n] = cos(2. 4 pn) = cos(0. 4 pn + 2 pn) = cos(0. 4 pn) = x 1[n] f 2 = 1. 2 Hz Sample at fs = 1 Hz f 1 = 0. 2 Hz See also SPFirst Fig. 4 -4 5 -9
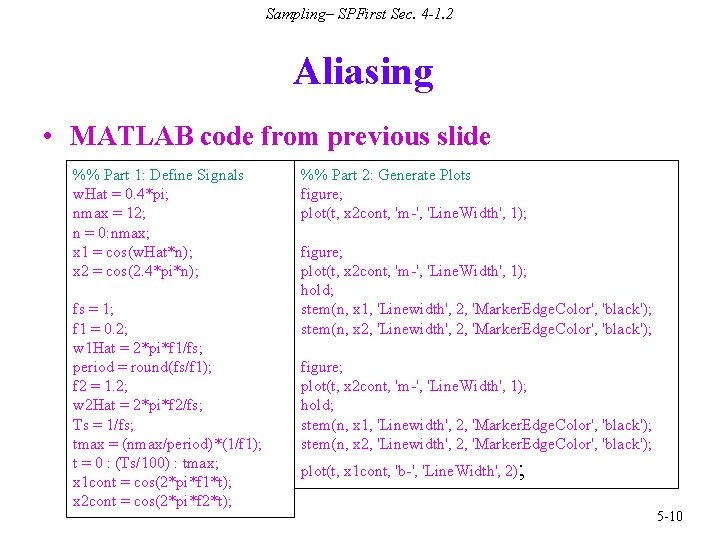
Sampling– SPFirst Sec. 4 -1. 2 Aliasing • MATLAB code from previous slide %% Part 1: Define Signals w. Hat = 0. 4*pi; nmax = 12; n = 0: nmax; x 1 = cos(w. Hat*n); x 2 = cos(2. 4*pi*n); fs = 1; f 1 = 0. 2; w 1 Hat = 2*pi*f 1/fs; period = round(fs/f 1); f 2 = 1. 2; w 2 Hat = 2*pi*f 2/fs; Ts = 1/fs; tmax = (nmax/period)*(1/f 1); t = 0 : (Ts/100) : tmax; x 1 cont = cos(2*pi*f 1*t); x 2 cont = cos(2*pi*f 2*t); %% Part 2: Generate Plots figure; plot(t, x 2 cont, 'm-', 'Line. Width', 1); hold; stem(n, x 1, 'Linewidth', 2, 'Marker. Edge. Color', 'black'); stem(n, x 2, 'Linewidth', 2, 'Marker. Edge. Color', 'black'); plot(t, x 1 cont, 'b-', 'Line. Width', 2); 5 -10
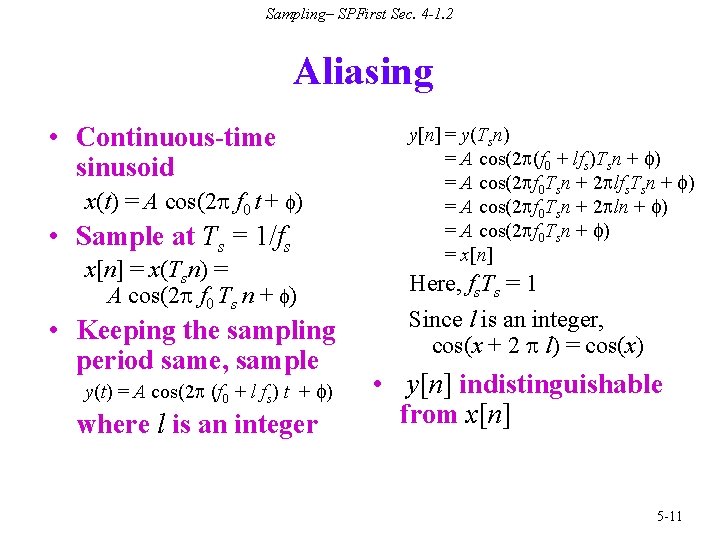
Sampling– SPFirst Sec. 4 -1. 2 Aliasing • Continuous-time sinusoid x(t) = A cos(2 p f 0 t + f) • Sample at Ts = 1/fs x[n] = x(Tsn) = A cos(2 p f 0 Ts n + f) • Keeping the sampling period same, sample y(t) = A cos(2 p (f 0 + l fs) t + f) where l is an integer y[n] = y(Tsn) = A cos(2 p(f 0 + lfs)Tsn + f) = A cos(2 pf 0 Tsn + 2 plfs. Tsn + f) = A cos(2 pf 0 Tsn + 2 pln + f) = A cos(2 pf 0 Tsn + f) = x[n] Here, fs. Ts = 1 Since l is an integer, cos(x + 2 p l) = cos(x) • y[n] indistinguishable from x[n] 5 -11
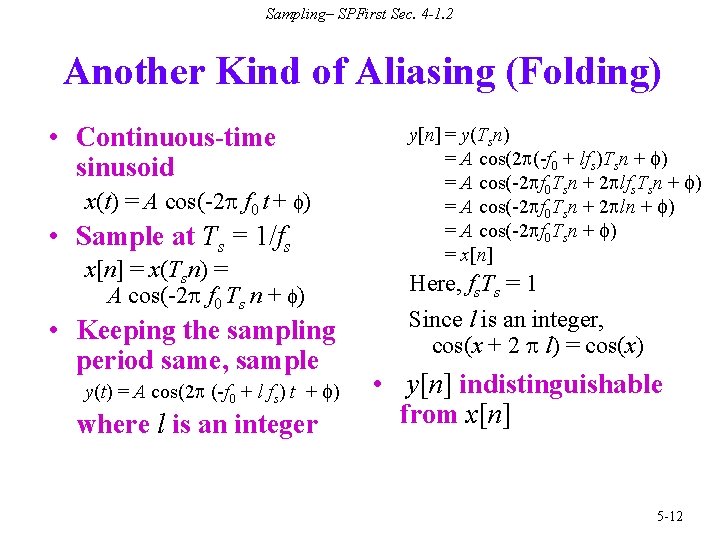
Sampling– SPFirst Sec. 4 -1. 2 Another Kind of Aliasing (Folding) • Continuous-time sinusoid x(t) = A cos(-2 p f 0 t + f) • Sample at Ts = 1/fs x[n] = x(Tsn) = A cos(-2 p f 0 Ts n + f) • Keeping the sampling period same, sample y(t) = A cos(2 p (-f 0 + l fs) t + f) where l is an integer y[n] = y(Tsn) = A cos(2 p(-f 0 + lfs)Tsn + f) = A cos(-2 pf 0 Tsn + 2 plfs. Tsn + f) = A cos(-2 pf 0 Tsn + 2 pln + f) = A cos(-2 pf 0 Tsn + f) = x[n] Here, fs. Ts = 1 Since l is an integer, cos(x + 2 p l) = cos(x) • y[n] indistinguishable from x[n] 5 -12
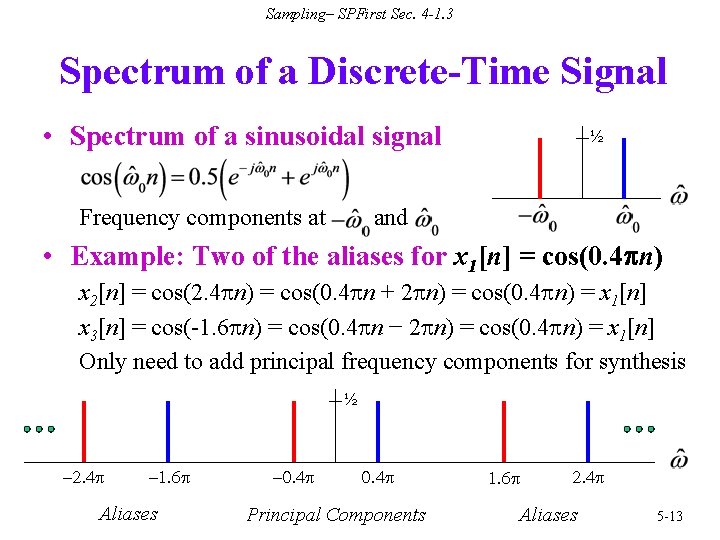
Sampling– SPFirst Sec. 4 -1. 3 Spectrum of a Discrete-Time Signal • Spectrum of a sinusoidal signal Frequency components at ½ and • Example: Two of the aliases for x 1[n] = cos(0. 4 pn) x 2[n] = cos(2. 4 pn) = cos(0. 4 pn + 2 pn) = cos(0. 4 pn) = x 1[n] x 3[n] = cos(-1. 6 pn) = cos(0. 4 pn − 2 pn) = cos(0. 4 pn) = x 1[n] Only need to add principal frequency components for synthesis ½ -2. 4 p -1. 6 p Aliases -0. 4 p Principal Components 1. 6 p 2. 4 p Aliases 5 -13
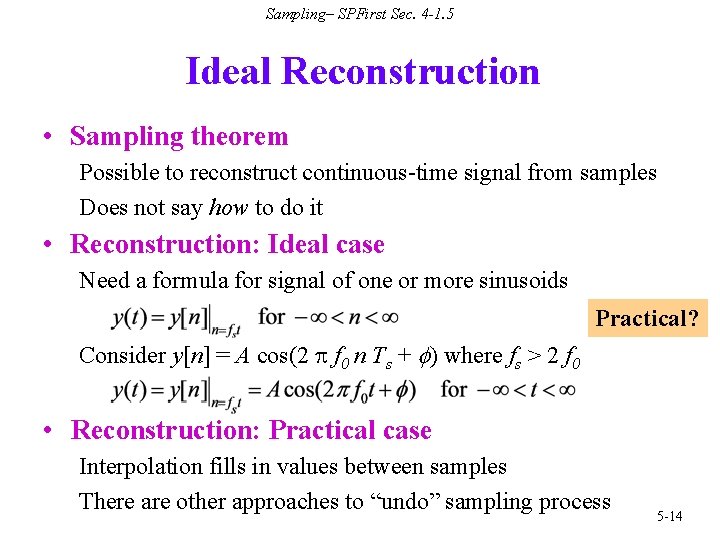
Sampling– SPFirst Sec. 4 -1. 5 Ideal Reconstruction • Sampling theorem Possible to reconstruct continuous-time signal from samples Does not say how to do it • Reconstruction: Ideal case Need a formula for signal of one or more sinusoids Practical? Consider y[n] = A cos(2 p f 0 n Ts + f) where fs > 2 f 0 • Reconstruction: Practical case Interpolation fills in values between samples There are other approaches to “undo” sampling process 5 -14
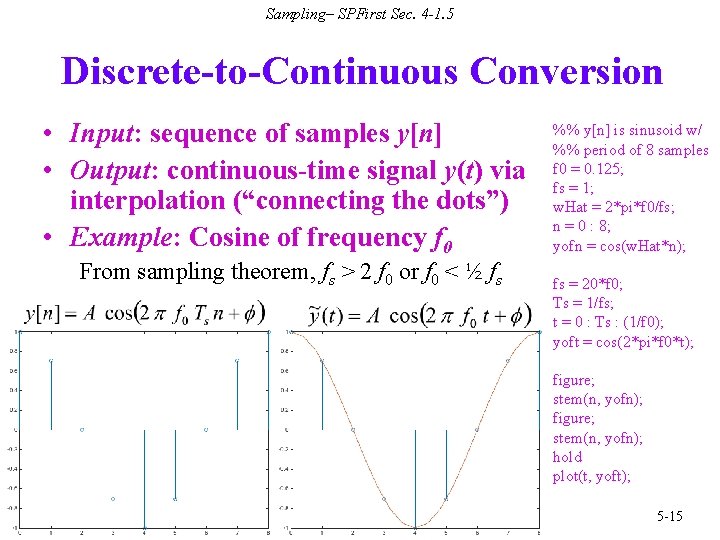
Sampling– SPFirst Sec. 4 -1. 5 Discrete-to-Continuous Conversion • Input: sequence of samples y[n] • Output: continuous-time signal y(t) via interpolation (“connecting the dots”) • Example: Cosine of frequency f 0 From sampling theorem, fs > 2 f 0 or f 0 < ½ fs %% y[n] is sinusoid w/ %% period of 8 samples f 0 = 0. 125; fs = 1; w. Hat = 2*pi*f 0/fs; n = 0 : 8; yofn = cos(w. Hat*n); fs = 20*f 0; Ts = 1/fs; t = 0 : Ts : (1/f 0); yoft = cos(2*pi*f 0*t); figure; stem(n, yofn); hold plot(t, yoft); 5 -15
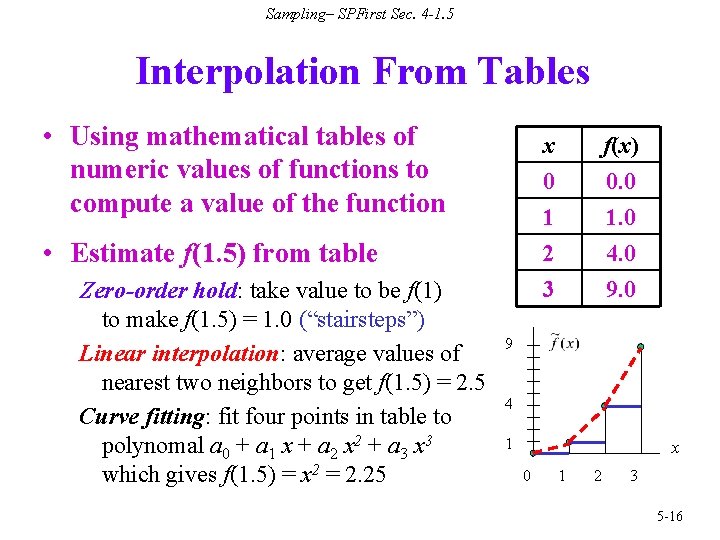
Sampling– SPFirst Sec. 4 -1. 5 Interpolation From Tables • Using mathematical tables of numeric values of functions to compute a value of the function • Estimate f(1. 5) from table Zero-order hold: take value to be f(1) to make f(1. 5) = 1. 0 (“stairsteps”) Linear interpolation: average values of nearest two neighbors to get f(1. 5) = 2. 5 Curve fitting: fit four points in table to polynomal a 0 + a 1 x + a 2 x 2 + a 3 x 3 which gives f(1. 5) = x 2 = 2. 25 x 0 1 2 f(x) 0. 0 1. 0 4. 0 3 9. 0 9 4 1 x 0 1 2 3 5 -16