Dr Kafu Wong ECON 1003 Analysis of Economic
- Slides: 44
Dr. Ka-fu Wong ECON 1003 Analysis of Economic Data Ka-fu Wong © 2003 Chap 4 - 1
Chapter Four Discrete Probability Distributions GOALS l 1. Define the terms random variable and probability distribution. 2. Distinguish between a discrete and continuous probability distributions. 3. Calculate the mean, variance, and standard deviation of a discrete probability distribution. 4. Describe the characteristics and compute probabilities using the binomial probability distribution. 5. Describe the characteristics and compute probabilities using the hypergeometric distribution. 6. Describe the characteristics and compute the Ka-fu Wong © 2003 Chap 4 - 2 probabilities using the Poisson distribution.
Random Variables n A random variable is a numerical value determined by the outcome of an experiment. n A probability distribution is the listing of all possible outcomes of an experiment and the corresponding probability. Ka-fu Wong © 2003 Chap 4 - 3
Types of Probability Distributions n A discrete probability distribution can assume only certain outcomes (need not be finite) – for variables that take discrete values. n The number of students in a class. n The number of children in a family. n The number of cars entering a carwash in a hour. n Number of home mortgages approved by Coastal Federal Bank last week. n Number of CDs you own. n Number of t rips made outside Hong Kong in the past one year. n The number of ten-cents coins in your pocket. Ka-fu Wong © 2003 Chap 4 - 4
Types of Probability Distributions n A continuous probability distribution can assume an infinite number of values within a given range – for variables that take continuous values. n The distance students travel to class. n The time it takes an executive to drive to work. n The length of an afternoon nap. n The length of time of a particular phone call. n The amount of money spent on your last haircut. Ka-fu Wong © 2003 Chap 4 - 5
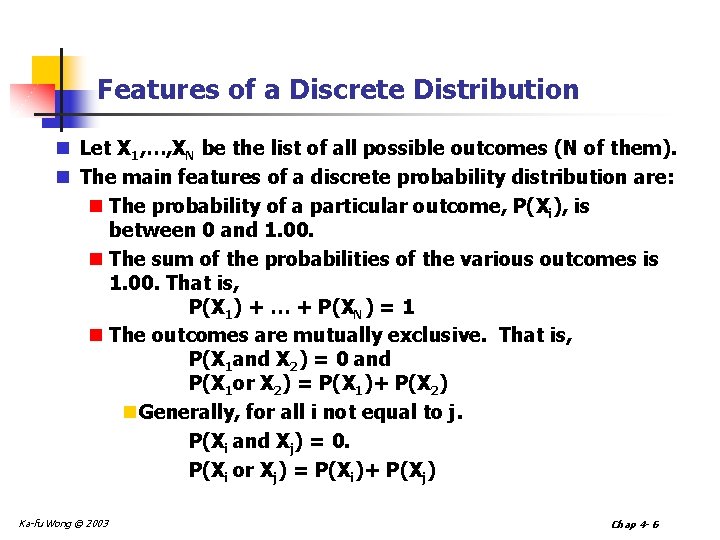
Features of a Discrete Distribution n Let X 1, …, XN be the list of all possible outcomes (N of them). n The main features of a discrete probability distribution are: n The probability of a particular outcome, P(Xi), is between 0 and 1. 00. n The sum of the probabilities of the various outcomes is 1. 00. That is, P(X 1) + … + P(XN) = 1 n The outcomes are mutually exclusive. That is, P(X 1 and X 2) = 0 and P(X 1 or X 2) = P(X 1)+ P(X 2) n Generally, for all i not equal to j. P(Xi and Xj) = 0. P(Xi or Xj) = P(Xi)+ P(Xj) Ka-fu Wong © 2003 Chap 4 - 6
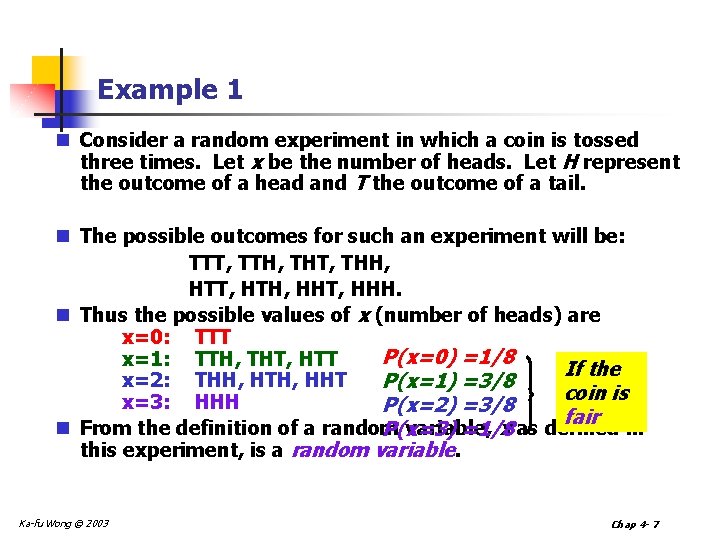
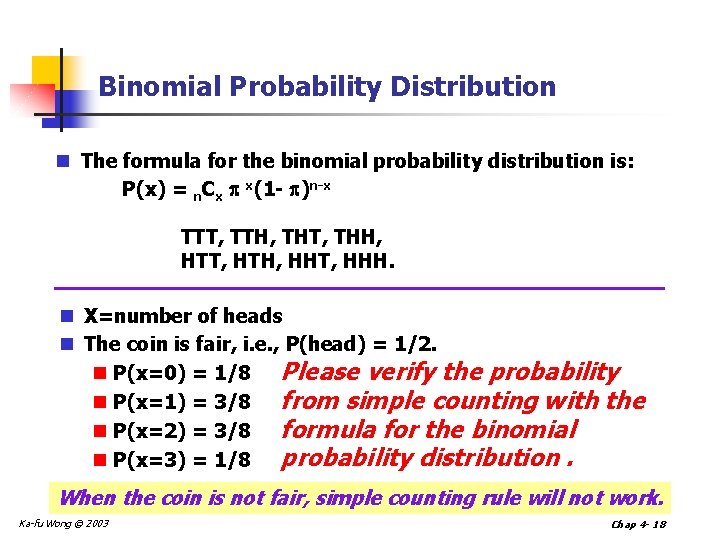
Example 1 n Consider a random experiment in which a coin is tossed three times. Let x be the number of heads. Let H represent the outcome of a head and T the outcome of a tail. n The possible outcomes for such an experiment will be: TTT, TTH, THT, THH, HTT, HTH, HHT, HHH. n Thus the possible values of x (number of heads) are x=0: TTT P(x=0) =1/8 x=1: TTH, THT, HTT If the x=2: THH, HTH, HHT P(x=1) =3/8 coin is x=3: HHH P(x=2) =3/8 fair n From the definition of a random variable, x as defined in P(x=3) =1/8 this experiment, is a random variable. Ka-fu Wong © 2003 Chap 4 - 7
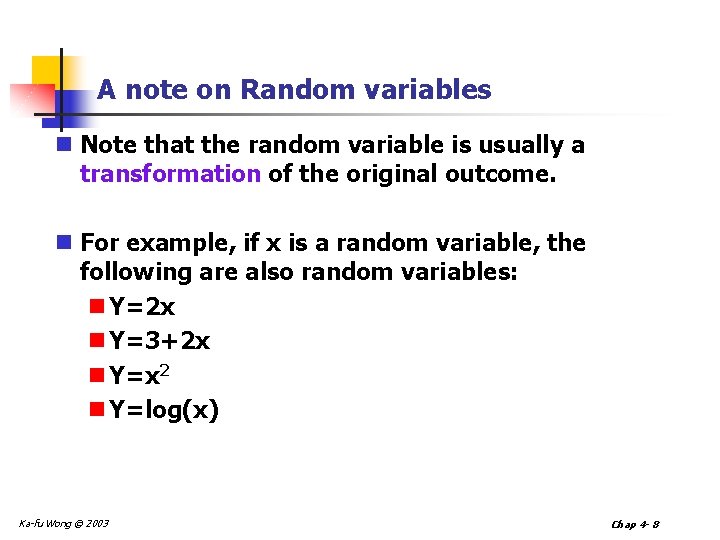
A note on Random variables n Note that the random variable is usually a transformation of the original outcome. n For example, if x is a random variable, the following are also random variables: n Y=2 x n Y=3+2 x n Y=x 2 n Y=log(x) Ka-fu Wong © 2003 Chap 4 - 8
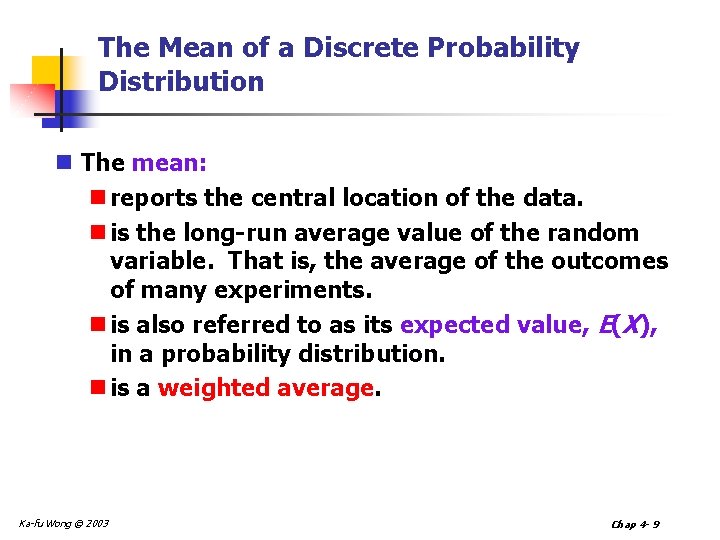
The Mean of a Discrete Probability Distribution n The mean: n reports the central location of the data. n is the long-run average value of the random variable. That is, the average of the outcomes of many experiments. n is also referred to as its expected value, E(X), in a probability distribution. n is a weighted average. Ka-fu Wong © 2003 Chap 4 - 9
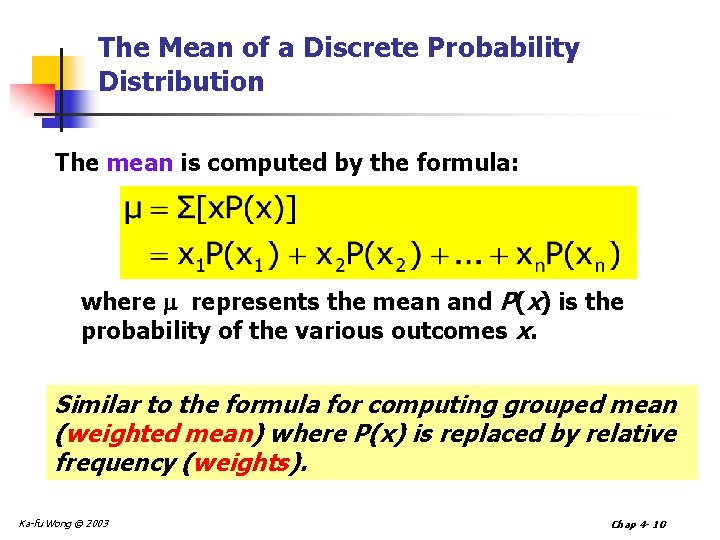
The Mean of a Discrete Probability Distribution The mean is computed by the formula: where represents the mean and P(x) is the probability of the various outcomes x. Similar to the formula for computing grouped mean (weighted mean) where P(x) is replaced by relative frequency (weights). Ka-fu Wong © 2003 Chap 4 - 10
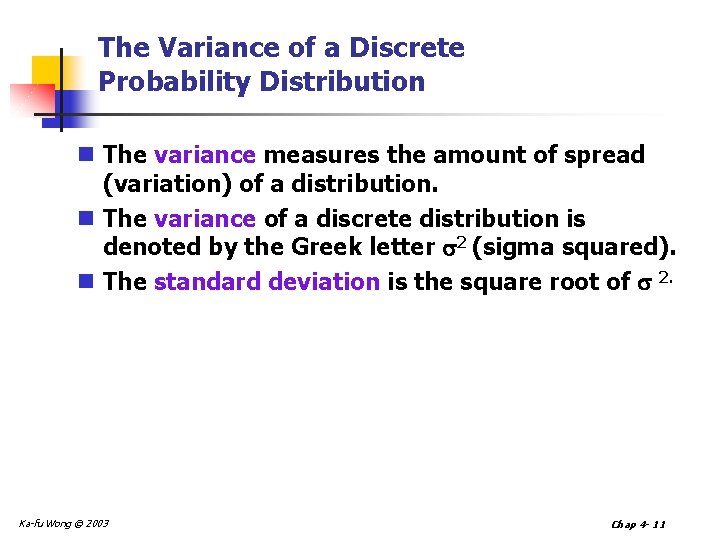
The Variance of a Discrete Probability Distribution n The variance measures the amount of spread (variation) of a distribution. n The variance of a discrete distribution is denoted by the Greek letter 2 (sigma squared). n The standard deviation is the square root of 2. Ka-fu Wong © 2003 Chap 4 - 11
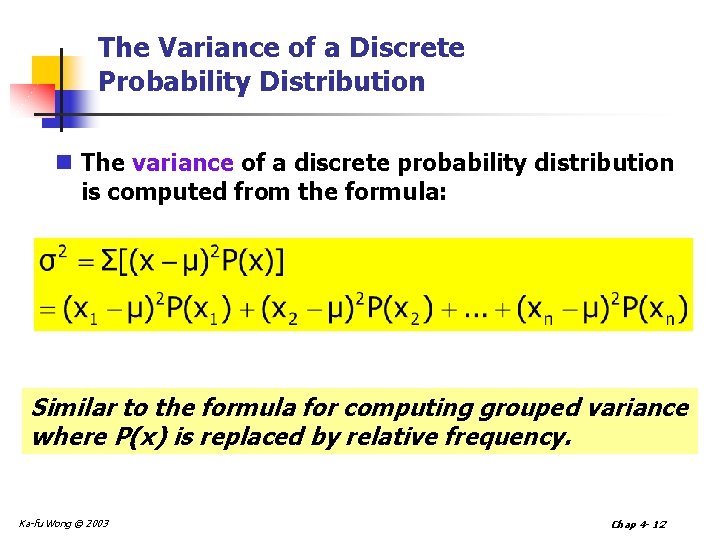
The Variance of a Discrete Probability Distribution n The variance of a discrete probability distribution is computed from the formula: Similar to the formula for computing grouped variance where P(x) is replaced by relative frequency. Ka-fu Wong © 2003 Chap 4 - 12
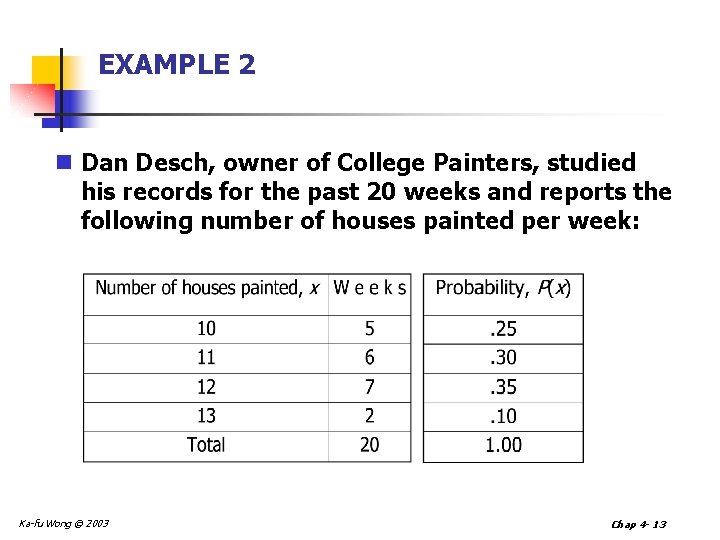
EXAMPLE 2 n Dan Desch, owner of College Painters, studied his records for the past 20 weeks and reports the following number of houses painted per week: Ka-fu Wong © 2003 Chap 4 - 13
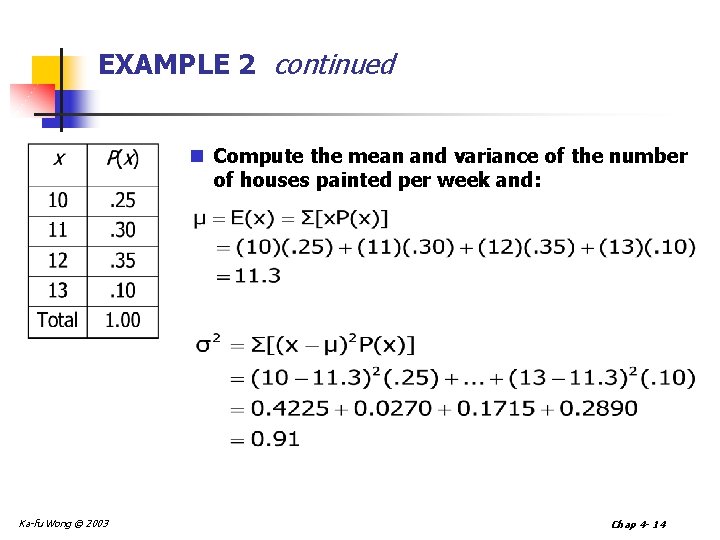
EXAMPLE 2 continued n Compute the mean and variance of the number of houses painted per week and: Ka-fu Wong © 2003 Chap 4 - 14
Binomial Probability Distribution n The binomial distribution has the following characteristics: n An outcome of an experiment is classified into one of two mutually exclusive categories, such as a success or failure. n The data collected are the results of counts in a series of trials. n The probability of success stays the same for each trial. n The trials are independent. n For example, tossing an unfair coin three times. n H is labeled success and T is labeled failure. n The data collected are number of H in the three tosses. n The probability of H stays the same for each toss. n The results of the tosses are independent. Ka-fu Wong © 2003 Chap 4 - 15
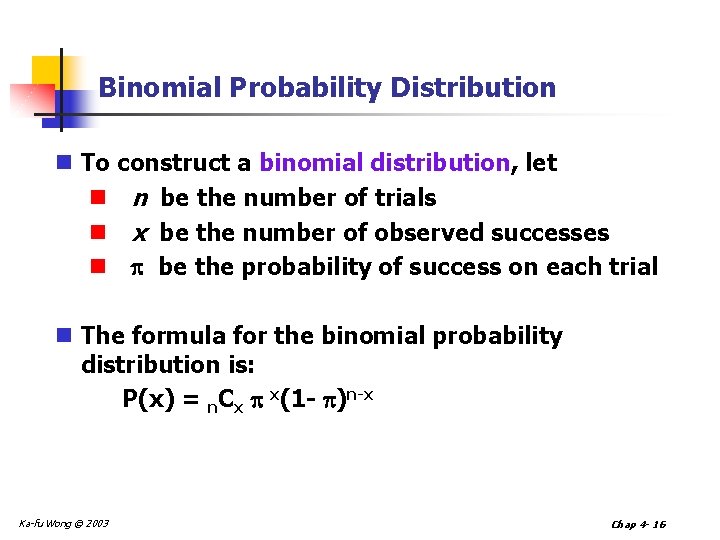
Binomial Probability Distribution n To construct a binomial distribution, let n n be the number of trials n x be the number of observed successes n be the probability of success on each trial n The formula for the binomial probability distribution is: P(x) = n. Cx x(1 - )n-x Ka-fu Wong © 2003 Chap 4 - 16
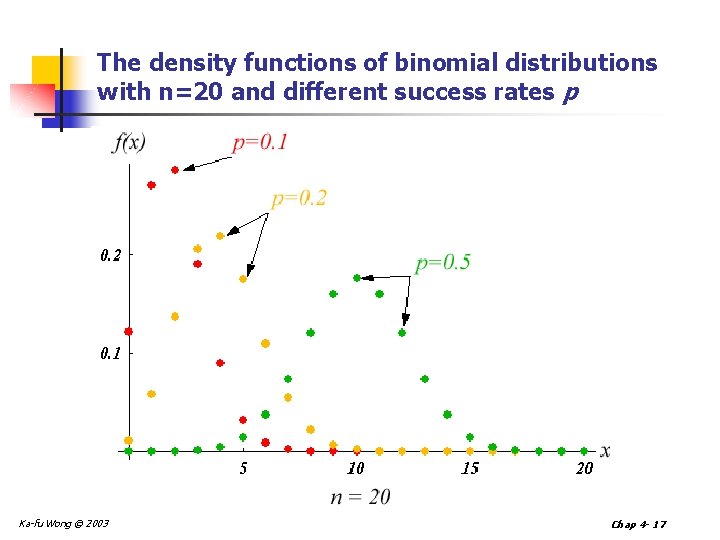
The density functions of binomial distributions with n=20 and different success rates p Ka-fu Wong © 2003 Chap 4 - 17
Binomial Probability Distribution n The formula for the binomial probability distribution is: P(x) = n. Cx x(1 - )n-x TTT, TTH, THT, THH, HTT, HTH, HHT, HHH. n X=number of heads n The coin is fair, i. e. , P(head) = 1/2. n P(x=0) = 1/8 Please verify the probability n P(x=1) = 3/8 from simple counting with the n P(x=2) = 3/8 formula for the binomial n P(x=3) = 1/8 probability distribution. When the coin is not fair, simple counting rule will not work. Ka-fu Wong © 2003 Chap 4 - 18
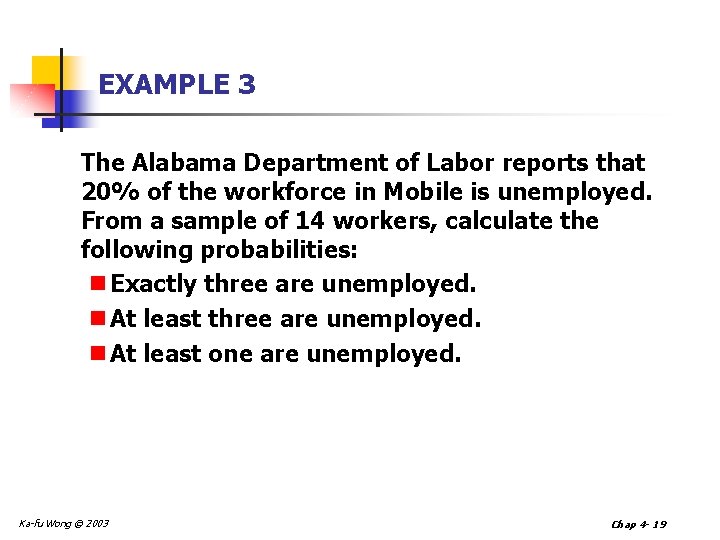
EXAMPLE 3 The Alabama Department of Labor reports that 20% of the workforce in Mobile is unemployed. From a sample of 14 workers, calculate the following probabilities: n Exactly three are unemployed. n At least one are unemployed. Ka-fu Wong © 2003 Chap 4 - 19
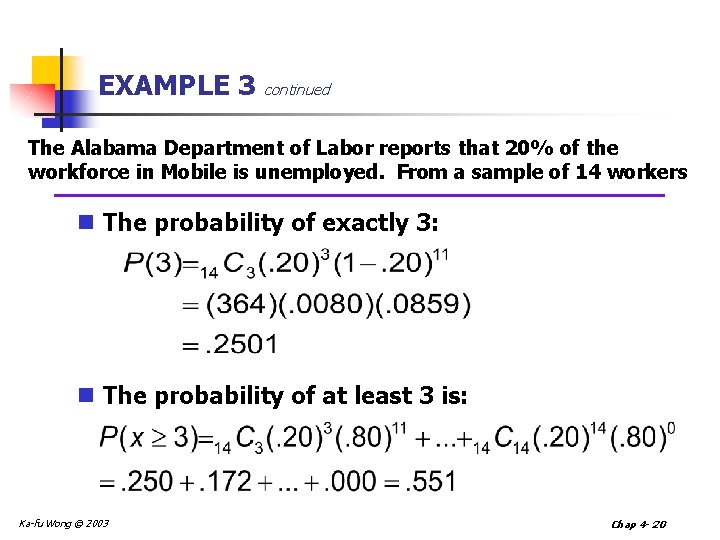
EXAMPLE 3 continued The Alabama Department of Labor reports that 20% of the workforce in Mobile is unemployed. From a sample of 14 workers n The probability of exactly 3: n The probability of at least 3 is: Ka-fu Wong © 2003 Chap 4 - 20
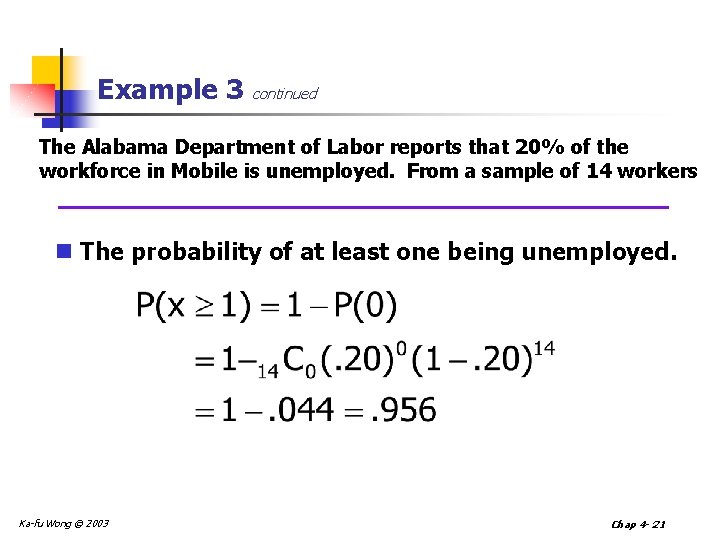
Example 3 continued The Alabama Department of Labor reports that 20% of the workforce in Mobile is unemployed. From a sample of 14 workers n The probability of at least one being unemployed. Ka-fu Wong © 2003 Chap 4 - 21
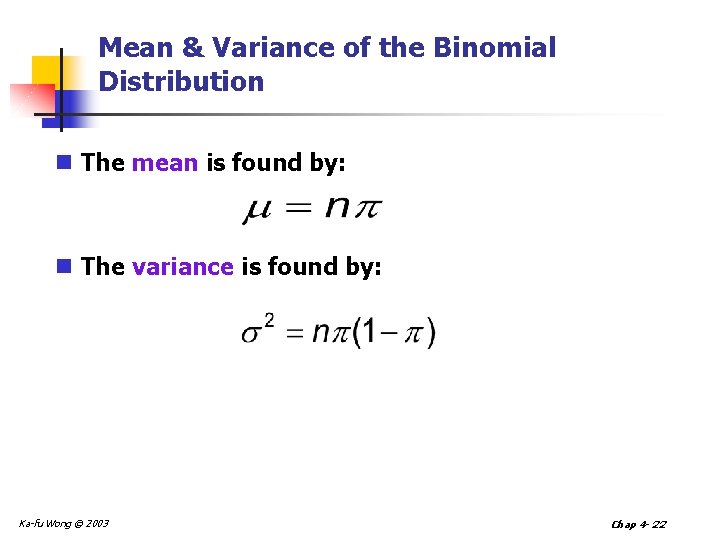
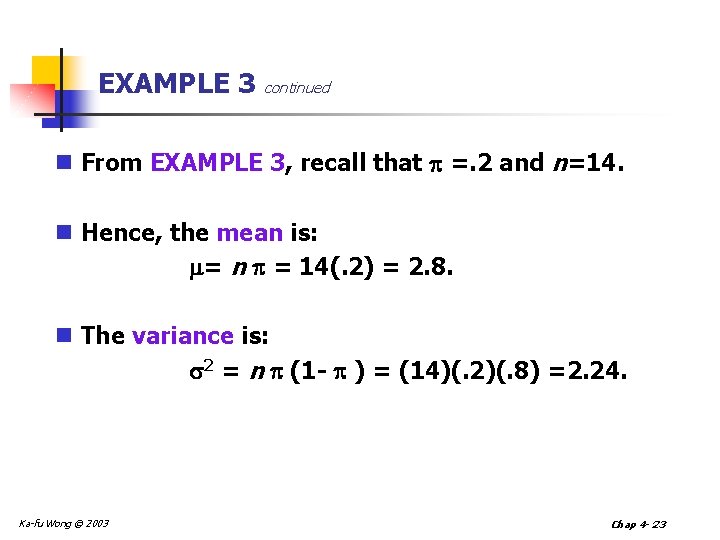
Mean & Variance of the Binomial Distribution n The mean is found by: n The variance is found by: Ka-fu Wong © 2003 Chap 4 - 22
EXAMPLE 3 continued n From EXAMPLE 3, recall that =. 2 and n=14. n Hence, the mean is: = n = 14(. 2) = 2. 8. n The variance is: 2 = n (1 - ) = (14)(. 2)(. 8) =2. 24. Ka-fu Wong © 2003 Chap 4 - 23
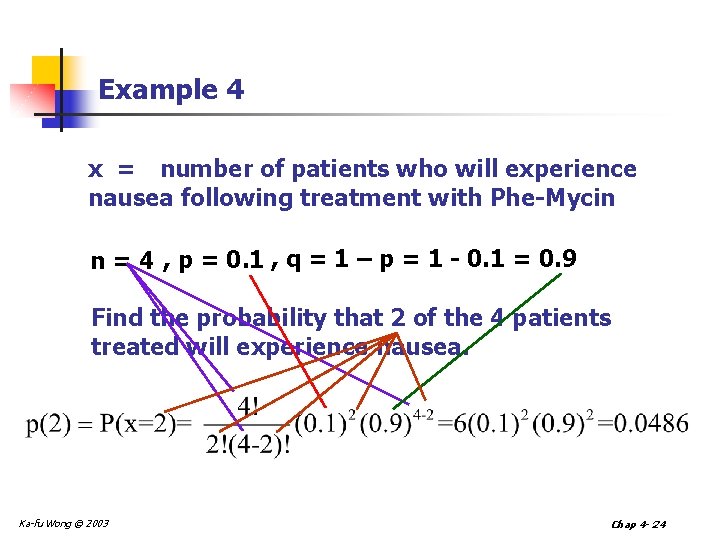
Example 4 x = number of patients who will experience nausea following treatment with Phe-Mycin n = 4 , p = 0. 1 , q = 1 – p = 1 - 0. 1 = 0. 9 Find the probability that 2 of the 4 patients treated will experience nausea. Ka-fu Wong © 2003 Chap 4 - 24
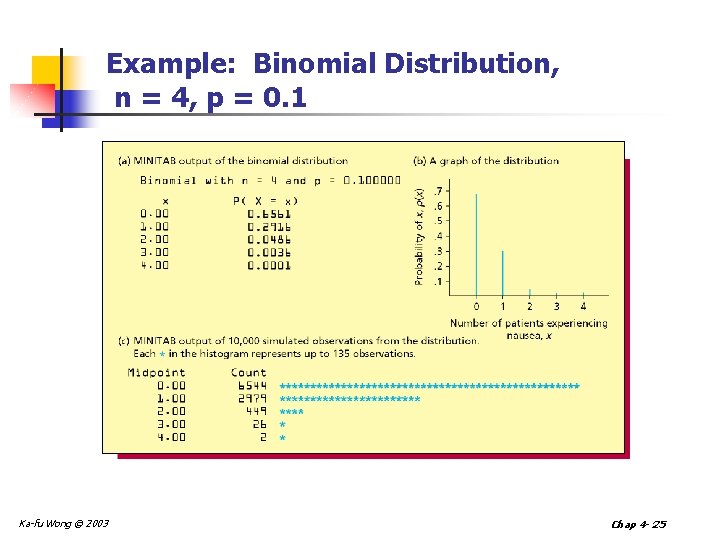
Example: Binomial Distribution, n = 4, p = 0. 1 Ka-fu Wong © 2003 Chap 4 - 25
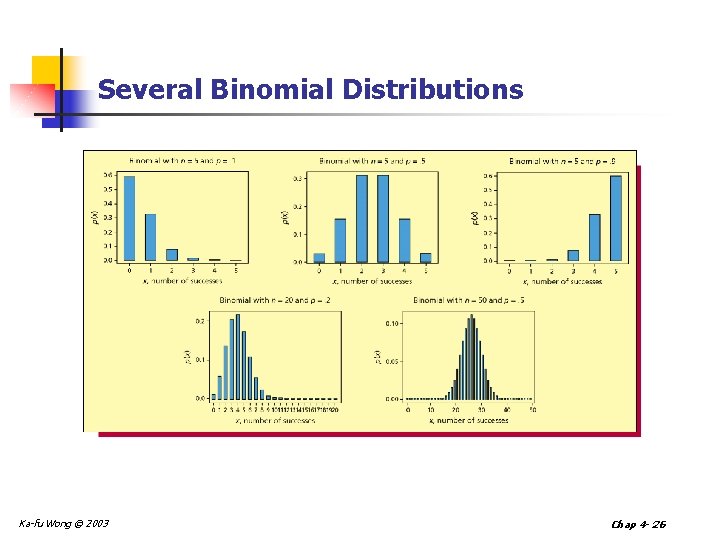
Several Binomial Distributions Ka-fu Wong © 2003 Chap 4 - 26
Finite Population n A finite population is a population consisting of a fixed number of known individuals, objects, or measurements. Examples include: n The number of students in this class. n The number of cars in the parking lot. n The number of homes built in Blackmoor. Ka-fu Wong © 2003 Chap 4 - 27
Hypergeometric Distribution n The hypergeometric distribution has the following characteristics: n There are only 2 possible outcomes. n The probability of a success is not the same on each trial. n It results from a count of the number of successes in a fixed number of trials. Ka-fu Wong © 2003 Chap 4 - 28
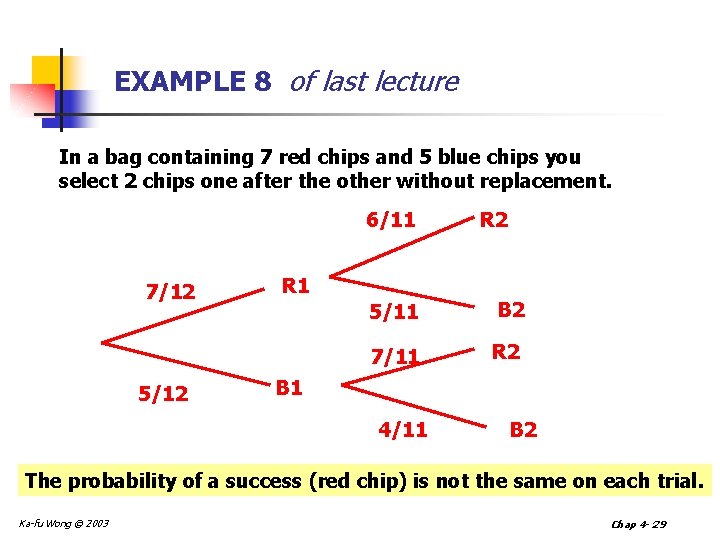
EXAMPLE 8 of last lecture In a bag containing 7 red chips and 5 blue chips you select 2 chips one after the other without replacement. 6/11 7/12 5/12 R 1 R 2 5/11 B 2 7/11 R 2 B 1 4/11 B 2 The probability of a success (red chip) is not the same on each trial. Ka-fu Wong © 2003 Chap 4 - 29
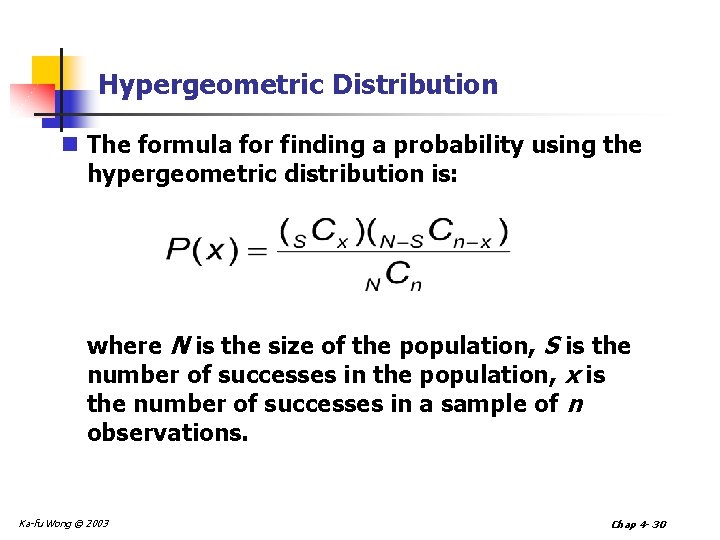
Hypergeometric Distribution n The formula for finding a probability using the hypergeometric distribution is: where N is the size of the population, S is the number of successes in the population, x is the number of successes in a sample of n observations. Ka-fu Wong © 2003 Chap 4 - 30
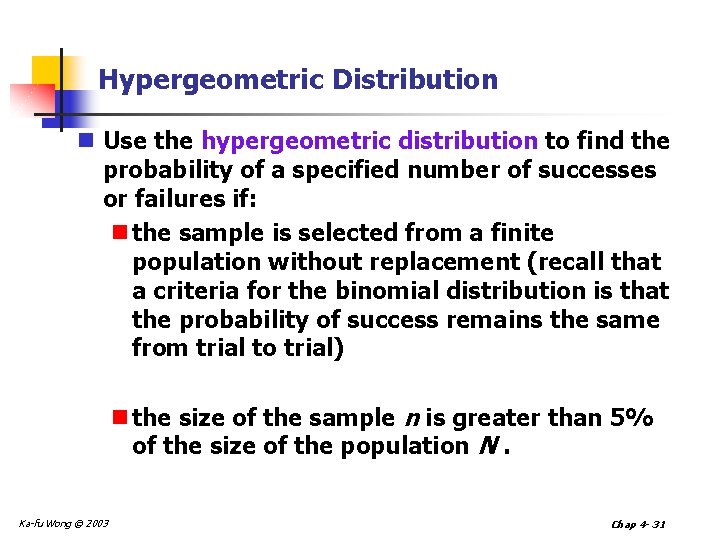
Hypergeometric Distribution n Use the hypergeometric distribution to find the probability of a specified number of successes or failures if: n the sample is selected from a finite population without replacement (recall that a criteria for the binomial distribution is that the probability of success remains the same from trial to trial) n the size of the sample n is greater than 5% of the size of the population N. Ka-fu Wong © 2003 Chap 4 - 31
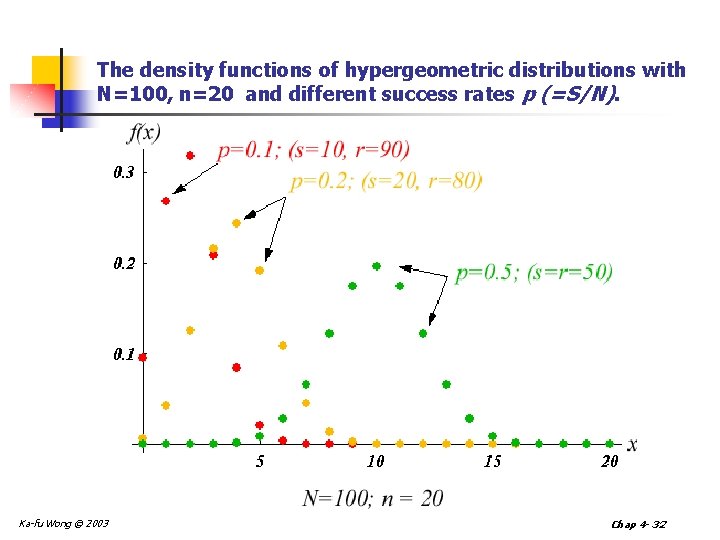
The density functions of hypergeometric distributions with N=100, n=20 and different success rates p (=S/N). Ka-fu Wong © 2003 Chap 4 - 32
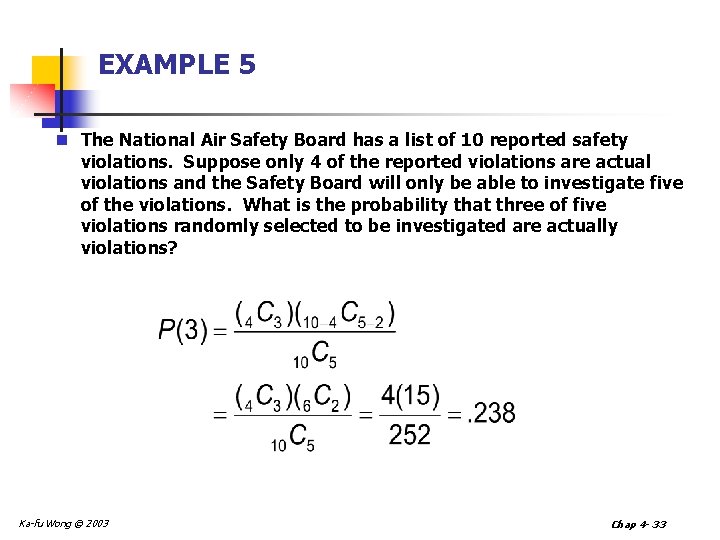
EXAMPLE 5 n The National Air Safety Board has a list of 10 reported safety violations. Suppose only 4 of the reported violations are actual violations and the Safety Board will only be able to investigate five of the violations. What is the probability that three of five violations randomly selected to be investigated are actually violations? Ka-fu Wong © 2003 Chap 4 - 33
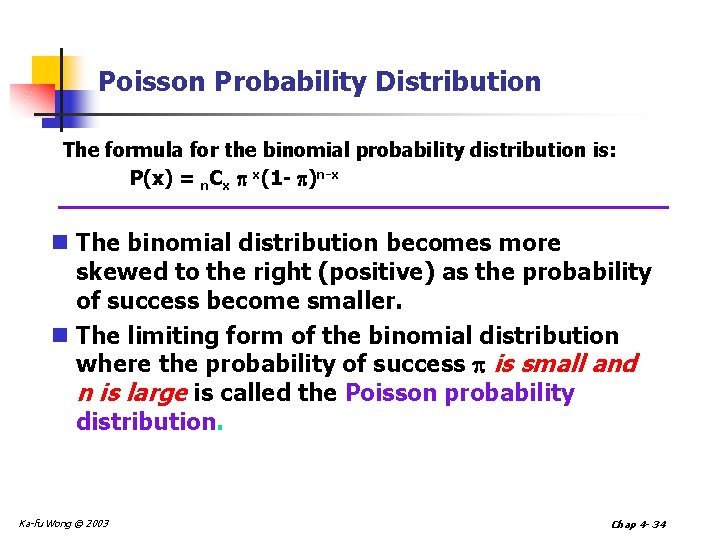
Poisson Probability Distribution The formula for the binomial probability distribution is: P(x) = n. Cx x(1 - )n-x n The binomial distribution becomes more skewed to the right (positive) as the probability of success become smaller. n The limiting form of the binomial distribution where the probability of success is small and n is large is called the Poisson probability distribution. Ka-fu Wong © 2003 Chap 4 - 34
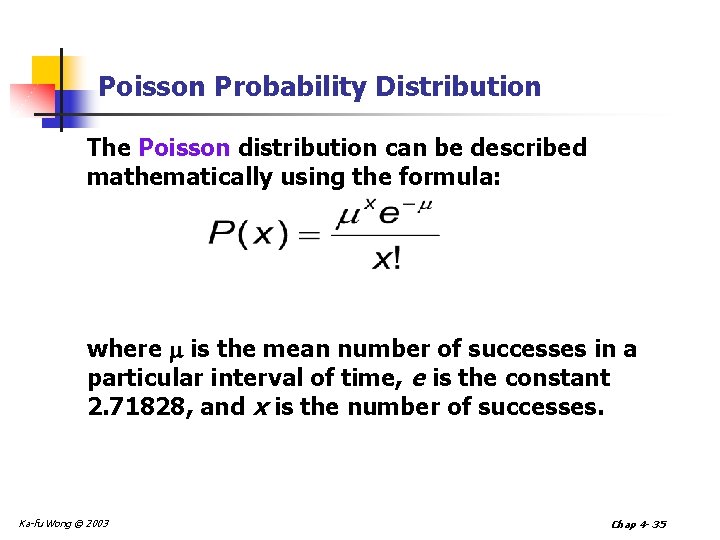
Poisson Probability Distribution The Poisson distribution can be described mathematically using the formula: where is the mean number of successes in a particular interval of time, e is the constant 2. 71828, and x is the number of successes. Ka-fu Wong © 2003 Chap 4 - 35
Poisson Probability Distribution n The mean number of successes can be determined in binomial situations by n , where n is the number of trials and the probability of a success. n The variance of the Poisson distribution is also equal to n . n X, the number of success generally has no specific upper limit. n Probability distribution always skewed to the right. n Becomes symmetrical when gets large. Ka-fu Wong © 2003 Chap 4 - 36
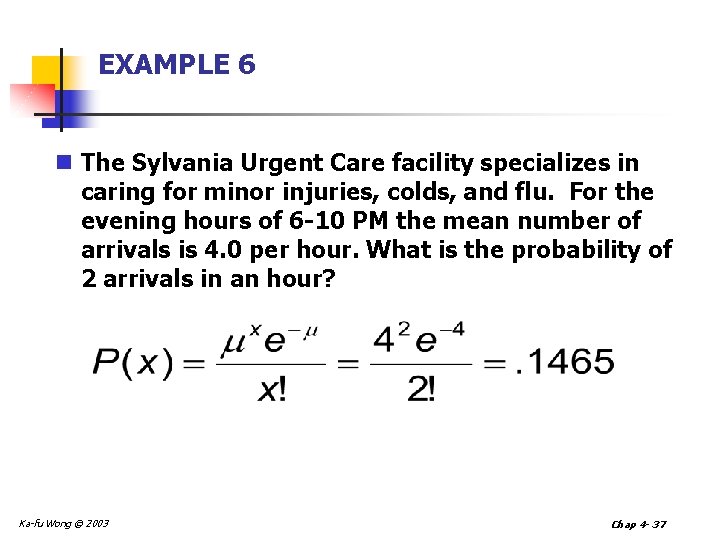
EXAMPLE 6 n The Sylvania Urgent Care facility specializes in caring for minor injuries, colds, and flu. For the evening hours of 6 -10 PM the mean number of arrivals is 4. 0 per hour. What is the probability of 2 arrivals in an hour? Ka-fu Wong © 2003 Chap 4 - 37
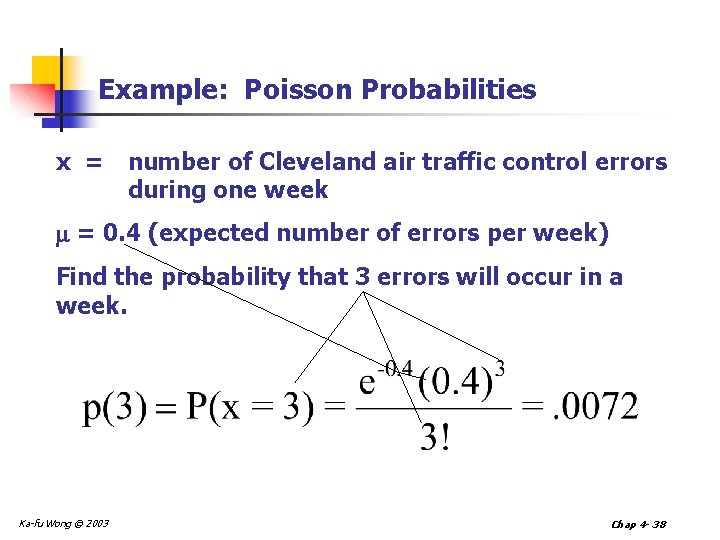
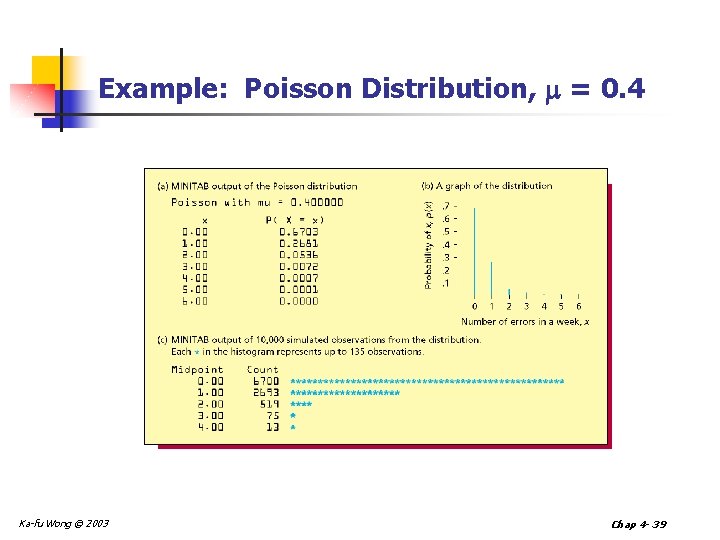
Example: Poisson Probabilities x = number of Cleveland air traffic control errors during one week = 0. 4 (expected number of errors per week) Find the probability that 3 errors will occur in a week. Ka-fu Wong © 2003 Chap 4 - 38
Example: Poisson Distribution, = 0. 4 Ka-fu Wong © 2003 Chap 4 - 39
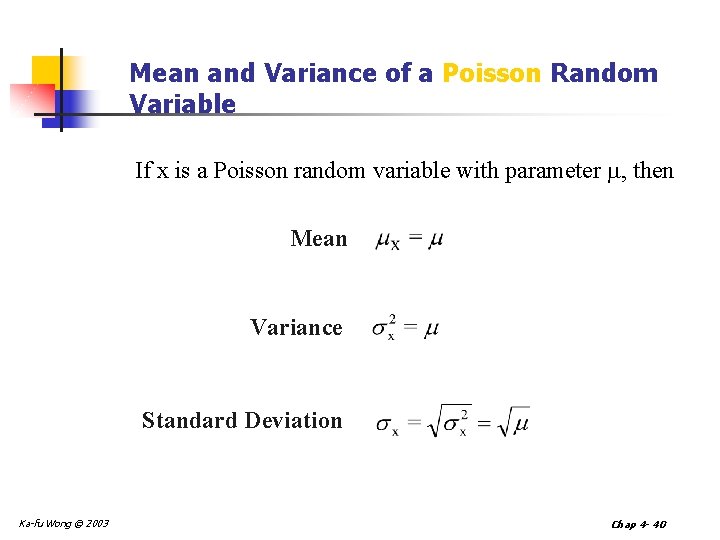
Mean and Variance of a Poisson Random Variable If x is a Poisson random variable with parameter , then Mean Variance Standard Deviation Ka-fu Wong © 2003 Chap 4 - 40
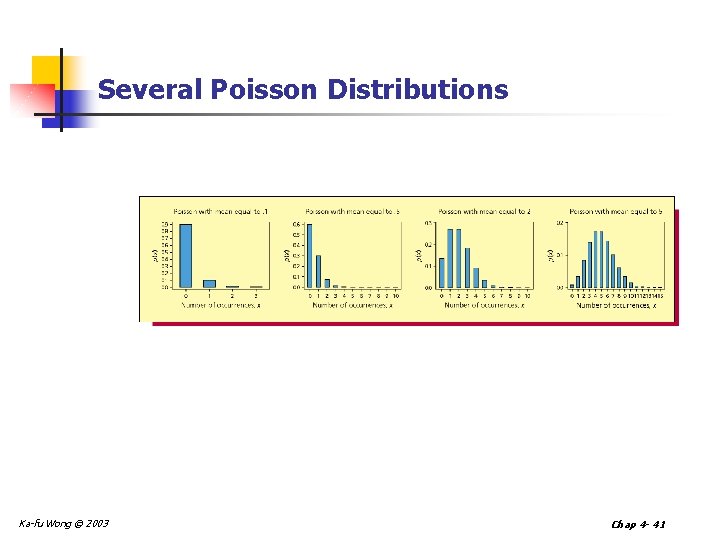
Several Poisson Distributions Ka-fu Wong © 2003 Chap 4 - 41
What distributions to use? n Poisson considers the number of times an event occurs over an INTERVAL of TIME or SPACE. Note that we are not considering a sample of given number of observations. n Thus, if we are considering a sample of 10 observations and we are asked to compute the probability of having 6 successes, we should not use Poisson. Instead, we should consider Binomial or Hypergeometric. n Hypergeometric consider the number of successes in a sample when the probability of success varies across trials due to “without replacement” sampling strategy. To compute the Hypergeometric probability, one will need to know N and S separately. n Suppose we know that the probability of success is 0. 3. We are considering a sample of 10 observations and we are asked to compute the probability of having 6 successes. We cannot use Hypergeometric because we do not have N and S separately. Instead, we have to use Binomial. Ka-fu Wong © 2003 Chap 4 - 42
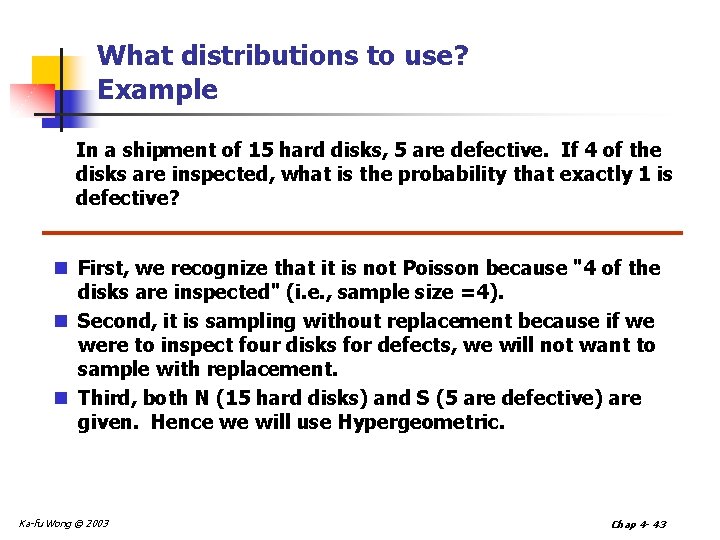
What distributions to use? Example In a shipment of 15 hard disks, 5 are defective. If 4 of the disks are inspected, what is the probability that exactly 1 is defective? n First, we recognize that it is not Poisson because "4 of the disks are inspected" (i. e. , sample size =4). n Second, it is sampling without replacement because if we were to inspect four disks for defects, we will not want to sample with replacement. n Third, both N (15 hard disks) and S (5 are defective) are given. Hence we will use Hypergeometric. Ka-fu Wong © 2003 Chap 4 - 43
Chapter Four Discrete Probability Distributions - END - Ka-fu Wong © 2003 Chap 4 - 44