Dialogue on Cooperative Action India Presentation Surya P



- Slides: 22
Dialogue on Cooperative Action India Presentation Surya P. Sethi Principal Adviser Energy Nov 16, 2006
Outline p Review of Annex I actions to reduce GHGs emissions p India in the global context p Low carbon pathway: sectoral opportunities in India p CDM: in the post 2012 regime
Review of Annex I National Communications Highlights
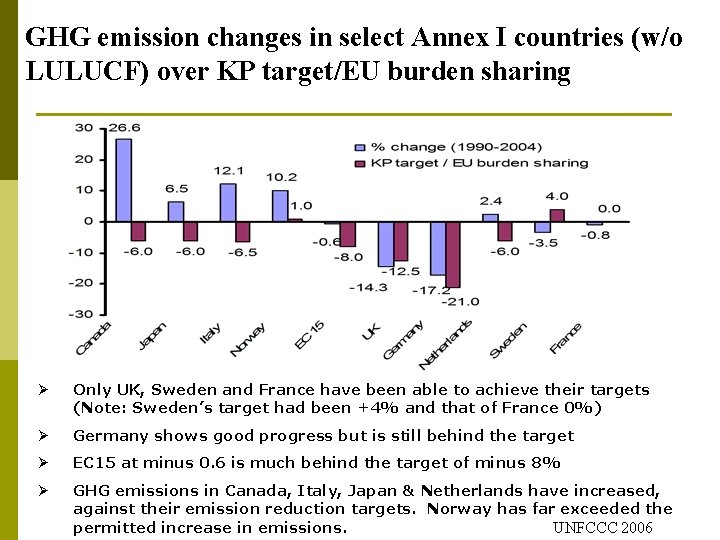
GHG emission changes in select Annex I countries (w/o LULUCF) over KP target/EU burden sharing Ø Only UK, Sweden and France have been able to achieve their targets (Note: Sweden’s target had been +4% and that of France 0%) Ø Germany shows good progress but is still behind the target Ø EC 15 at minus 0. 6 is much behind the target of minus 8% Ø GHG emissions in Canada, Italy, Japan & Netherlands have increased, against their emission reduction targets. Norway has far exceeded the UNFCCC 2006 permitted increase in emissions.
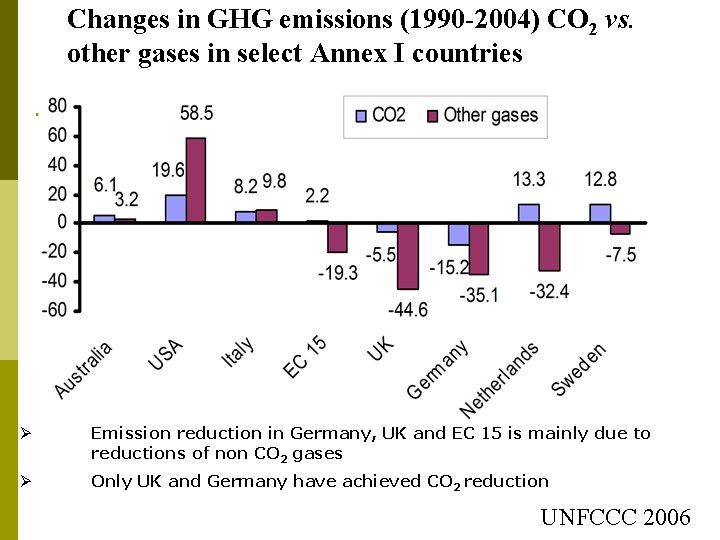
Changes in GHG emissions (1990 -2004) CO 2 vs. other gases in select Annex I countries Ø Emission reduction in Germany, UK and EC 15 is mainly due to reductions of non CO 2 gases Ø Only UK and Germany have achieved CO 2 reduction UNFCCC 2006
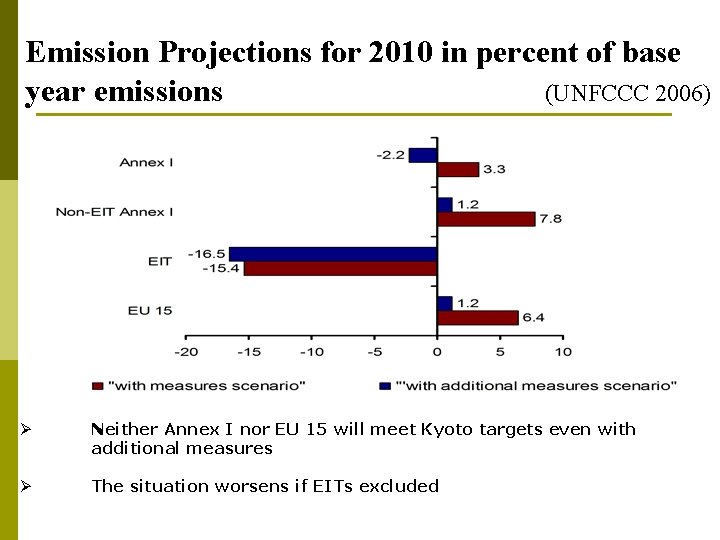
Emission Projections for 2010 in percent of base year emissions (UNFCCC 2006) Ø Neither Annex I nor EU 15 will meet Kyoto targets even with additional measures Ø The situation worsens if EITs excluded
India in the Global Context
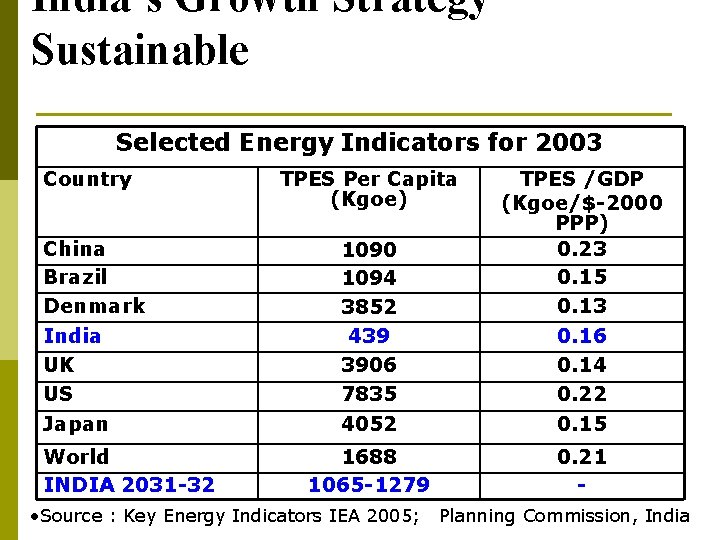
India’s Growth Strategy Sustainable Selected Energy Indicators for 2003 Country China Brazil Denmark India UK US Japan World INDIA 2031 -32 TPES Per Capita (Kgoe) 1090 1094 3852 439 3906 7835 4052 TPES /GDP (Kgoe/$-2000 PPP) 0. 23 0. 15 0. 13 0. 16 0. 14 0. 22 0. 15 1688 1065 -1279 0. 21 - • Source : Key Energy Indicators IEA 2005; Planning Commission, India
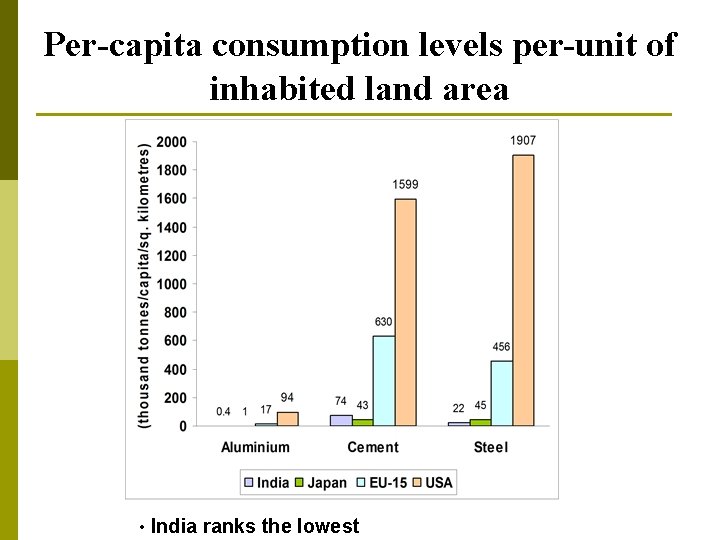
Per-capita consumption levels per-unit of inhabited land area • India ranks the lowest
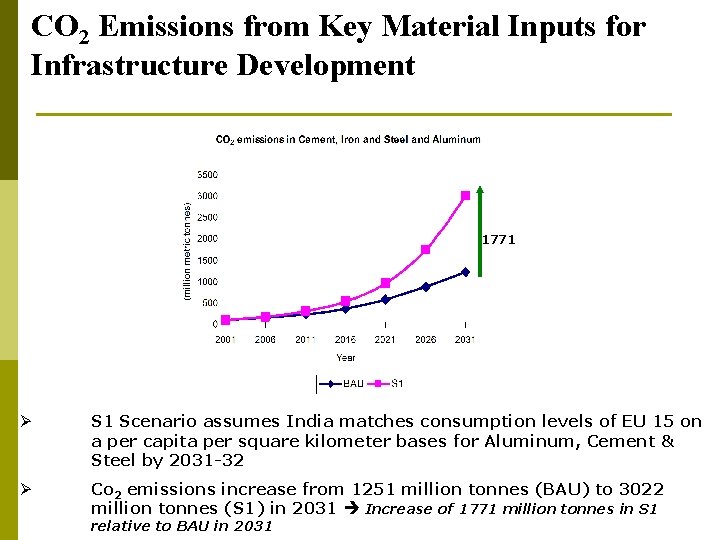
CO 2 Emissions from Key Material Inputs for Infrastructure Development 1771 Ø S 1 Scenario assumes India matches consumption levels of EU 15 on a per capita per square kilometer bases for Aluminum, Cement & Steel by 2031 -32 Ø Co 2 emissions increase from 1251 million tonnes (BAU) to 3022 million tonnes (S 1) in 2031 Increase of 1771 million tonnes in S 1 relative to BAU in 2031
Low carbon pathway: Sectoral opportunities in India
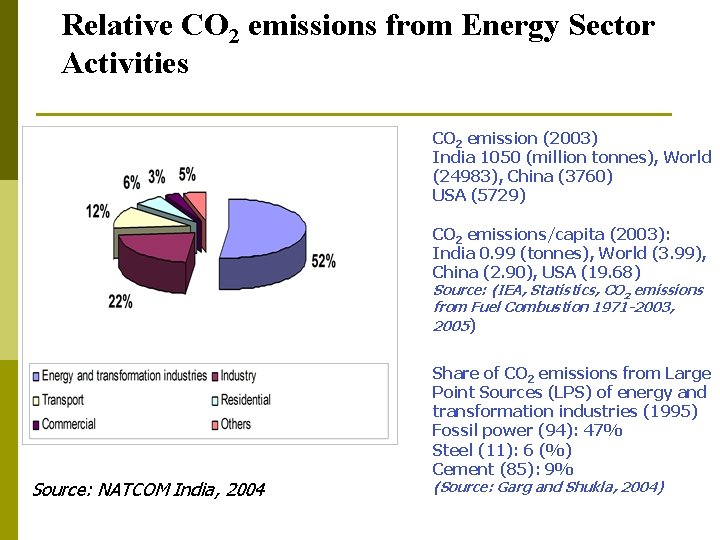
Relative CO 2 emissions from Energy Sector Activities CO 2 emission (2003) India 1050 (million tonnes), World (24983), China (3760) USA (5729) CO 2 emissions/capita (2003): India 0. 99 (tonnes), World (3. 99), China (2. 90), USA (19. 68) Source: (IEA, Statistics, CO 2 emissions from Fuel Combustion 1971 -2003, 2005) Source: NATCOM India, 2004 Share of CO 2 emissions from Large Point Sources (LPS) of energy and transformation industries (1995) Fossil power (94): 47% Steel (11): 6 (%) Cement (85): 9% (Source: Garg and Shukla, 2004)
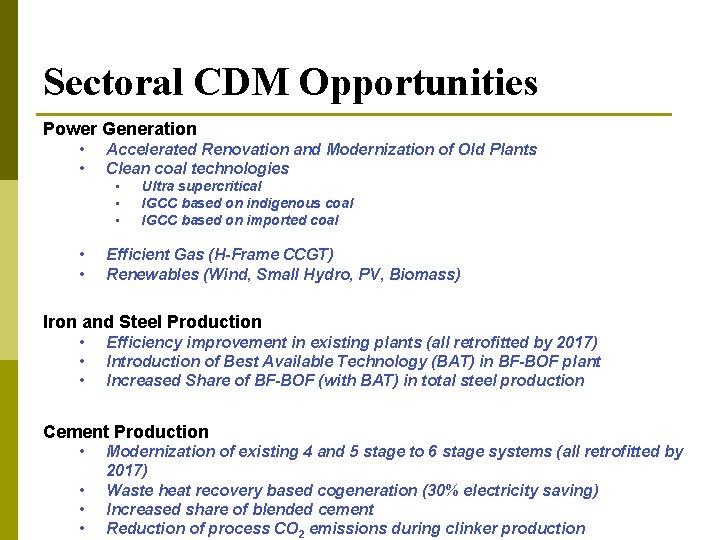
Sectoral CDM Opportunities Power Generation • • Accelerated Renovation and Modernization of Old Plants Clean coal technologies • • • Ultra supercritical IGCC based on indigenous coal IGCC based on imported coal Efficient Gas (H-Frame CCGT) Renewables (Wind, Small Hydro, PV, Biomass) Iron and Steel Production • • • Efficiency improvement in existing plants (all retrofitted by 2017) Introduction of Best Available Technology (BAT) in BF-BOF plant Increased Share of BF-BOF (with BAT) in total steel production Cement Production • • Modernization of existing 4 and 5 stage to 6 stage systems (all retrofitted by 2017) Waste heat recovery based cogeneration (30% electricity saving) Increased share of blended cement Reduction of process CO 2 emissions during clinker production
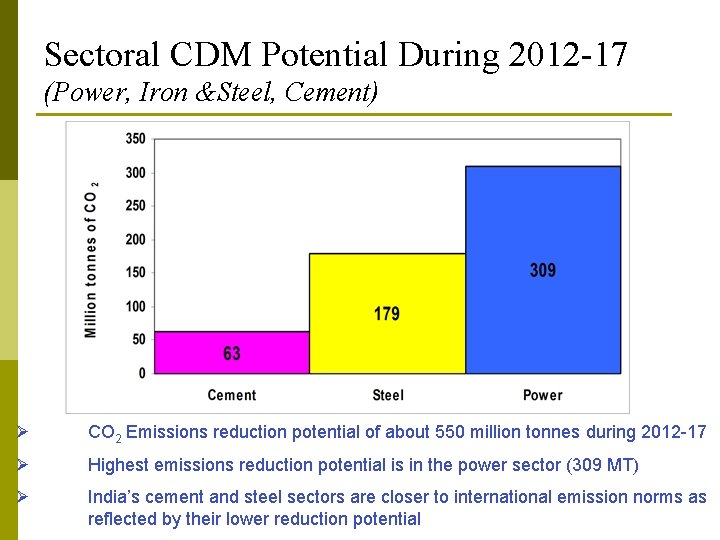
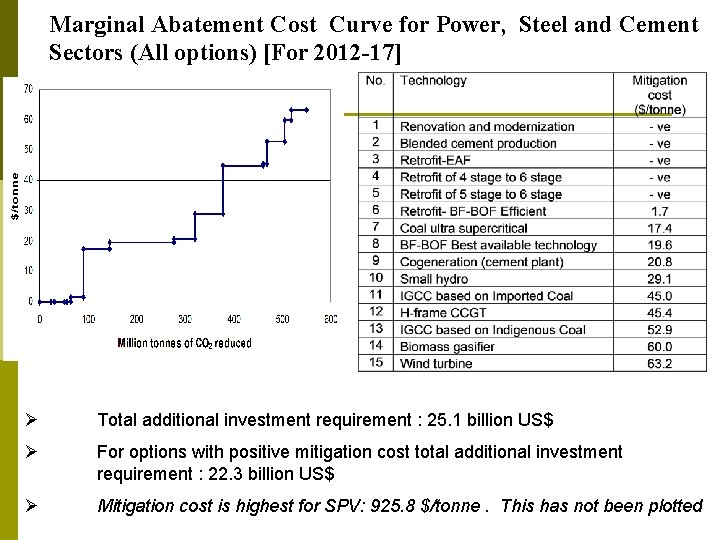
Sectoral CDM Potential During 2012 -17 (Power, Iron &Steel, Cement) Ø CO 2 Emissions reduction potential of about 550 million tonnes during 2012 -17 Ø Highest emissions reduction potential is in the power sector (309 MT) Ø India’s cement and steel sectors are closer to international emission norms as reflected by their lower reduction potential
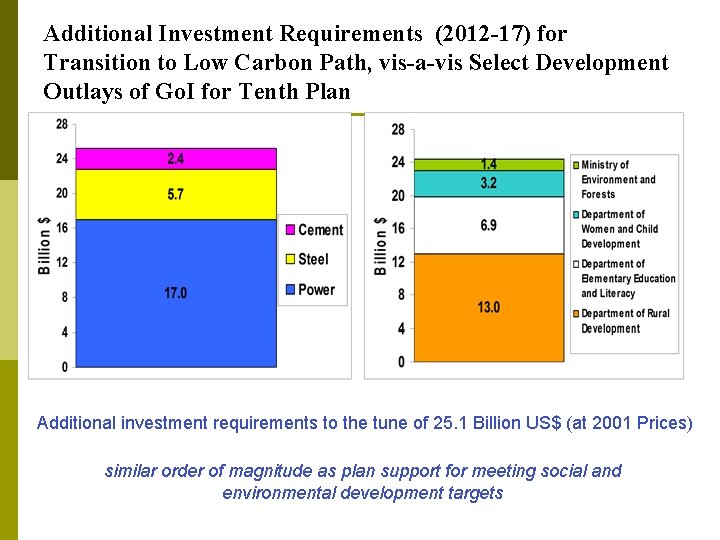
Additional Investment Requirements (2012 -17) for Transition to Low Carbon Path, vis-a-vis Select Development Outlays of Go. I for Tenth Plan Additional investment requirements to the tune of 25. 1 Billion US$ (at 2001 Prices) similar order of magnitude as plan support for meeting social and environmental development targets
Marginal Abatement Cost Curve for Power, Steel and Cement Sectors (All options) [For 2012 -17] Ø Total additional investment requirement : 25. 1 billion US$ Ø For options with positive mitigation cost total additional investment requirement : 22. 3 billion US$ Ø Mitigation cost is highest for SPV: 925. 8 $/tonne. This has not been plotted
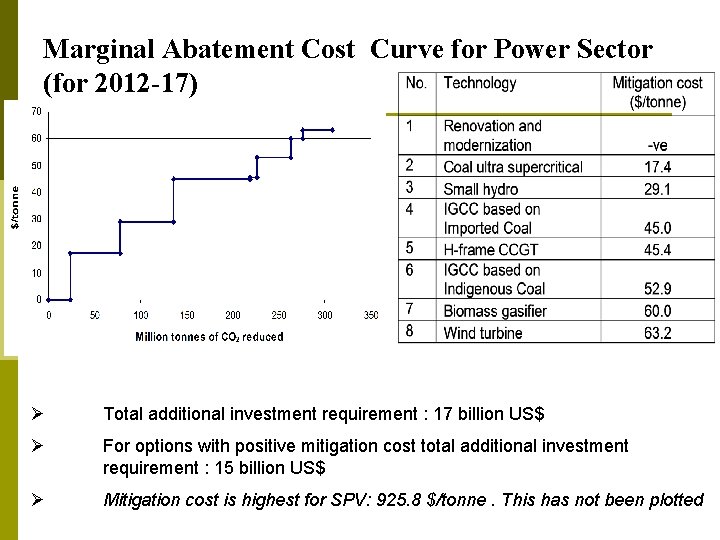
Marginal Abatement Cost Curve for Power Sector (for 2012 -17) Ø Total additional investment requirement : 17 billion US$ Ø For options with positive mitigation cost total additional investment requirement : 15 billion US$ Ø Mitigation cost is highest for SPV: 925. 8 $/tonne. This has not been plotted
India’s Suggestions at the G-8 Summit p Place Energy Efficient and sustainable technologies in limited public domain p Replace traditional technology transfer with collaborative R&D p New Multilateral Window to provide additional funding for the above against the security of robust long term carbon markets
CDM in the post 2012 regime
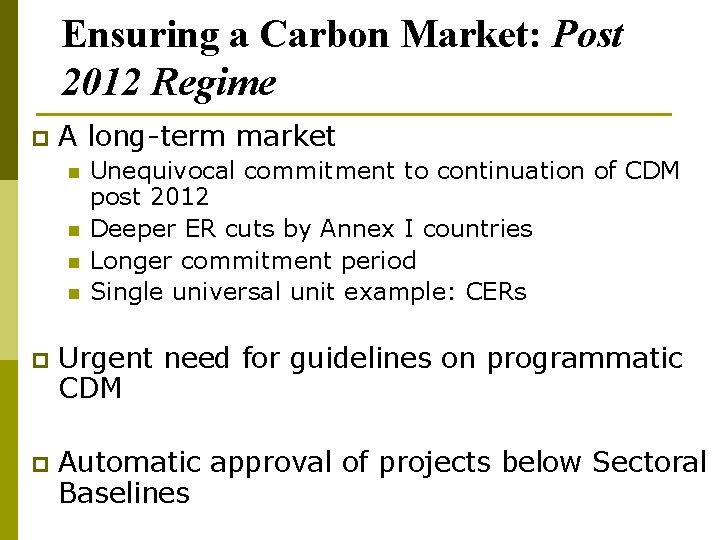
Ensuring a Carbon Market: Post 2012 Regime p A long-term market n n Unequivocal commitment to continuation of CDM post 2012 Deeper ER cuts by Annex I countries Longer commitment period Single universal unit example: CERs p Urgent need for guidelines on programmatic CDM p Automatic approval of projects below Sectoral Baselines
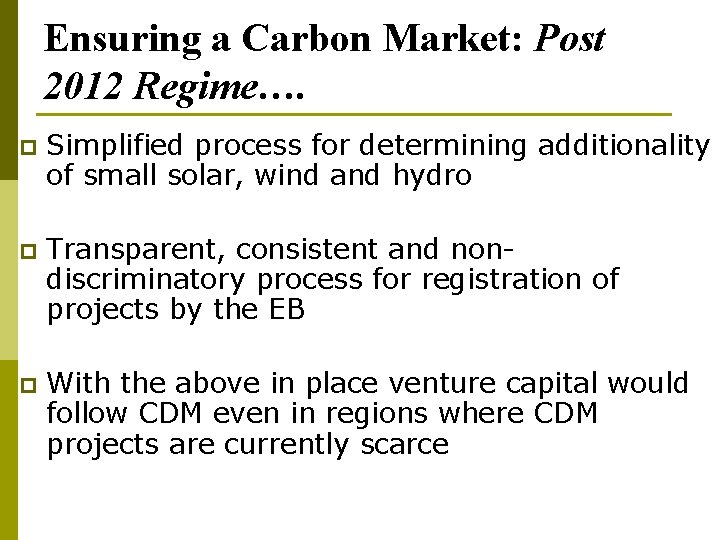
Ensuring a Carbon Market: Post 2012 Regime…. p Simplified process for determining additionality of small solar, wind and hydro p Transparent, consistent and nondiscriminatory process for registration of projects by the EB p With the above in place venture capital would follow CDM even in regions where CDM projects are currently scarce
An ounce of practice is worth more than a ton of preaching