Descriptive Statistics Healey Chapters 3 and 4 1

- Slides: 27
Descriptive Statistics Healey Chapters 3 and 4 (1 e) or Ch. 3 (2/3 e) Measures of Central Tendency And Dispersion
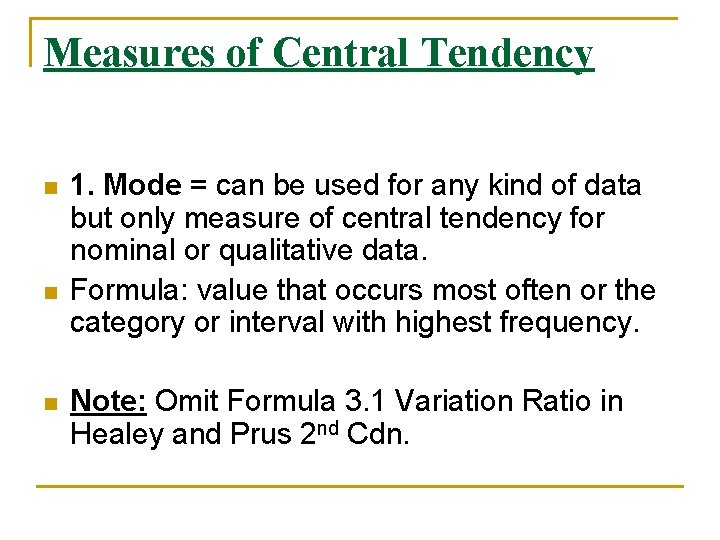
Measures of Central Tendency n n n 1. Mode = can be used for any kind of data but only measure of central tendency for nominal or qualitative data. Formula: value that occurs most often or the category or interval with highest frequency. Note: Omit Formula 3. 1 Variation Ratio in Healey and Prus 2 nd Cdn.
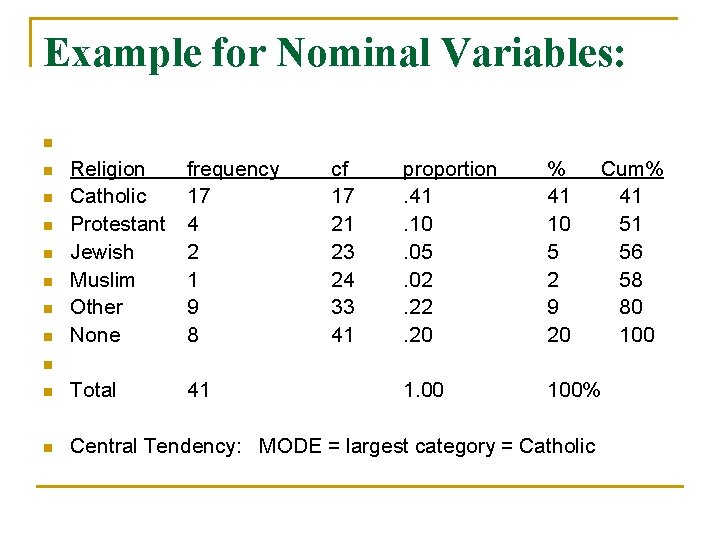
Example for Nominal Variables: n Religion Catholic Protestant Jewish Muslim Other None frequency 17 4 2 1 9 8 n Total 41 n Central Tendency: MODE = largest category = Catholic n n n n cf 17 21 23 24 33 41 proportion. 41. 10. 05. 02. 20 % 41 10 5 2 9 20 Cum% 41 51 56 58 80 100 100% n
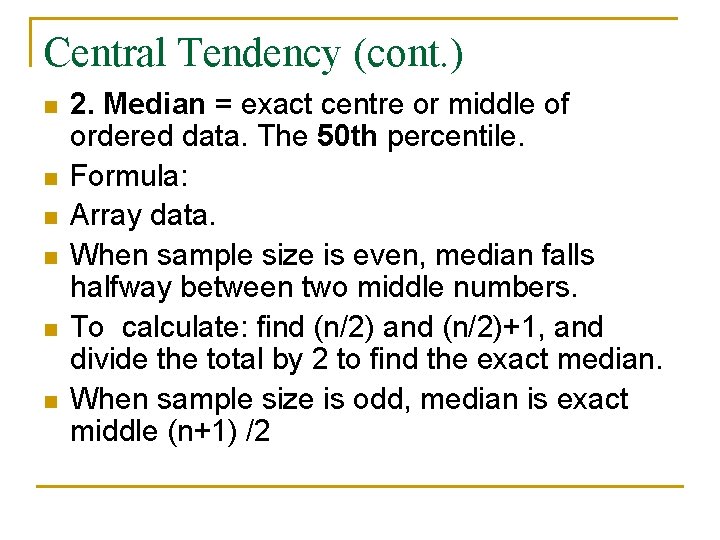
Central Tendency (cont. ) n n n 2. Median = exact centre or middle of ordered data. The 50 th percentile. Formula: Array data. When sample size is even, median falls halfway between two middle numbers. To calculate: find (n/2) and (n/2)+1, and divide the total by 2 to find the exact median. When sample size is odd, median is exact middle (n+1) /2
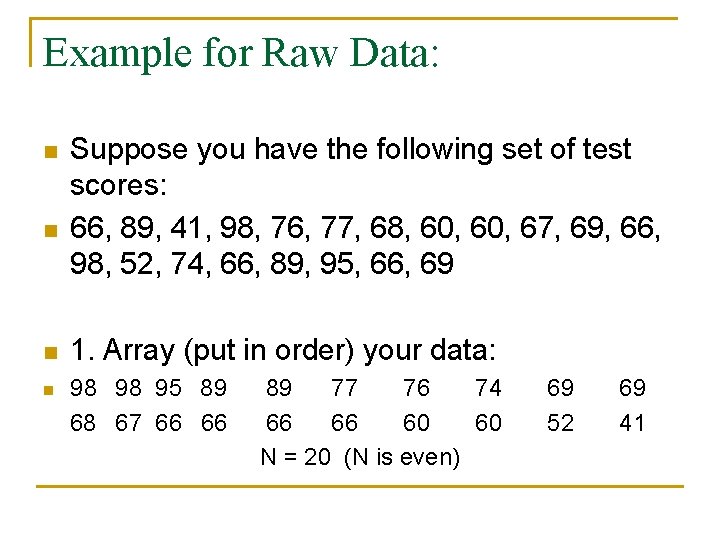
Example for Raw Data: n n Suppose you have the following set of test scores: 66, 89, 41, 98, 76, 77, 68, 60, 67, 69, 66, 98, 52, 74, 66, 89, 95, 66, 69 1. Array (put in order) your data: 98 98 95 89 68 67 66 66 89 77 76 74 66 66 60 60 N = 20 (N is even) 69 52 69 41
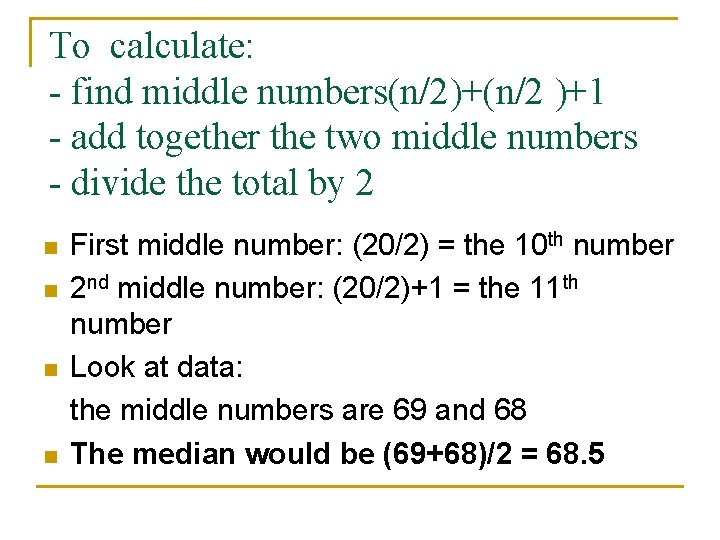
To calculate: - find middle numbers(n/2)+(n/2 )+1 - add together the two middle numbers - divide the total by 2 n n First middle number: (20/2) = the 10 th number 2 nd middle number: (20/2)+1 = the 11 th number Look at data: the middle numbers are 69 and 68 The median would be (69+68)/2 = 68. 5
Median for Aggregate (grouped) Data n This formula is shown in Healey 1 st Cdn Edition but NOT in 2/3 Cdn n We will NOT COVER this one!
Properties of median: n - for numerical data at interval or ordinal level n -"balance point“ n -not affected by outliers n -median is appropriate when distribution is highly skewed.
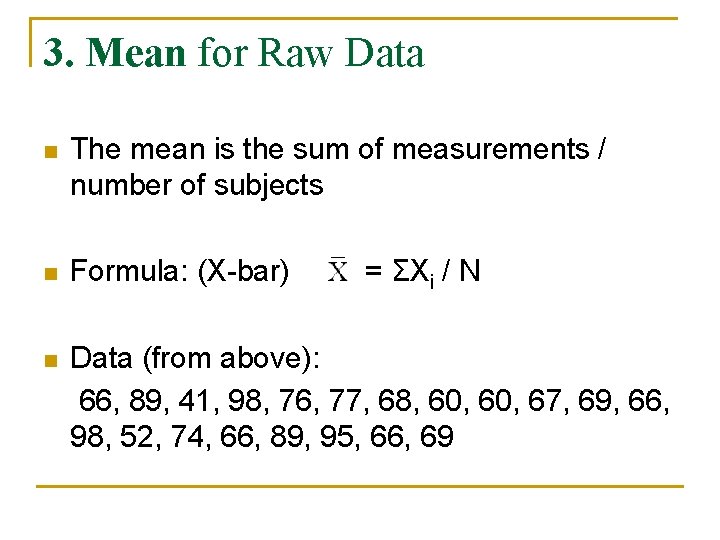
3. Mean for Raw Data n The mean is the sum of measurements / number of subjects n Formula: (X-bar) n Data (from above): 66, 89, 41, 98, 76, 77, 68, 60, 67, 69, 66, 98, 52, 74, 66, 89, 95, 66, 69 = ΣXi / N
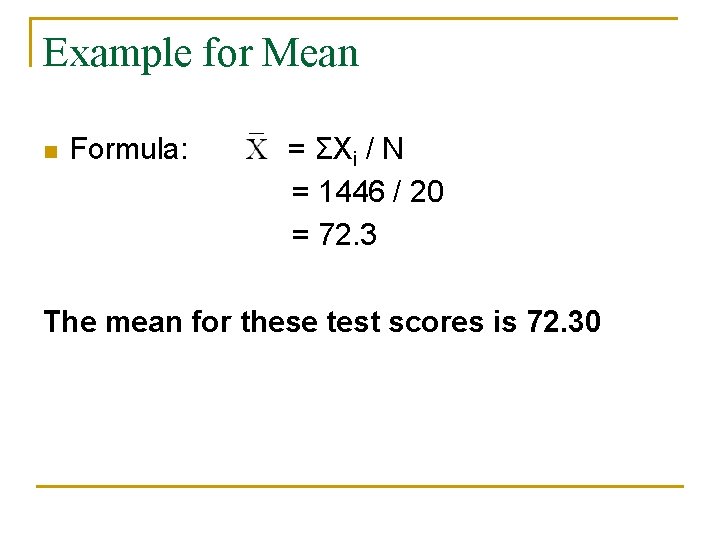
Example for Mean n Formula: = ΣXi / N = 1446 / 20 = 72. 3 The mean for these test scores is 72. 30
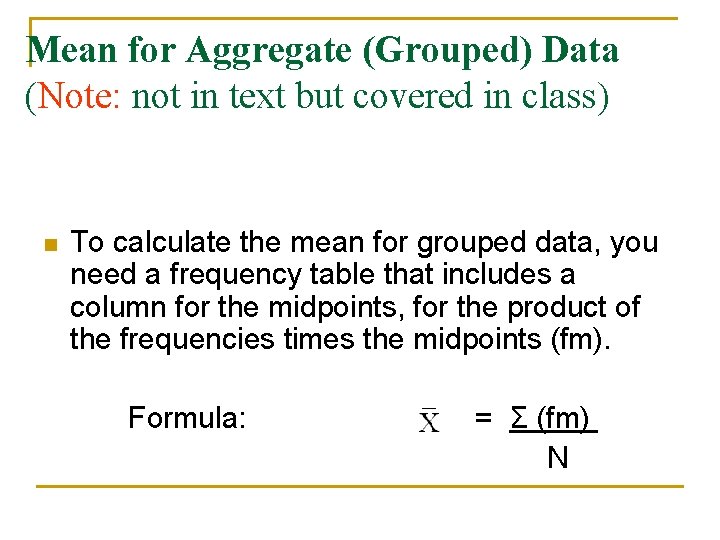
Mean for Aggregate (Grouped) Data (Note: not in text but covered in class) n To calculate the mean for grouped data, you need a frequency table that includes a column for the midpoints, for the product of the frequencies times the midpoints (fm). Formula: = Σ (fm) N
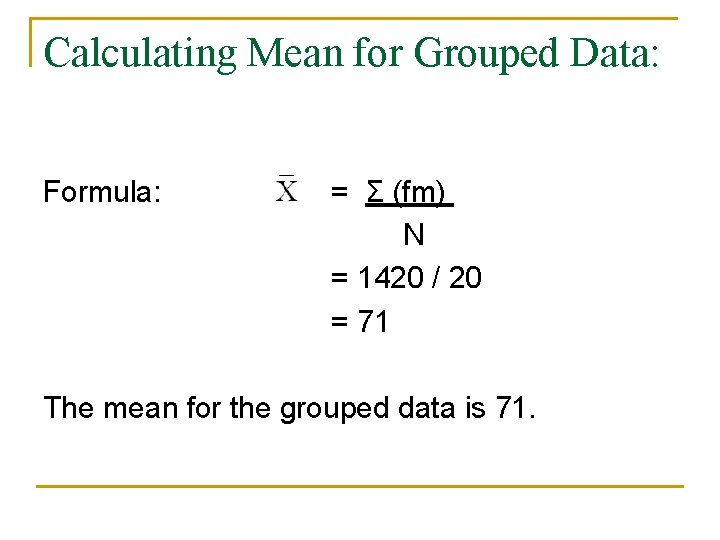
Frequency table: Score f m* 41 -50 1 45. 5 51 -60 3 55. 5 61 -70 8 65. 5 71 -80 3 75. 5 81 -90 2 85. 5 91 -100 3 95. 5 N = 20 Σ (fm) = * Find midpoints first (fm) 45. 5 166. 5 524 226. 5 171 286. 5 1420
Calculating Mean for Grouped Data: Formula: = Σ (fm) N = 1420 / 20 = 71 The mean for the grouped data is 71.
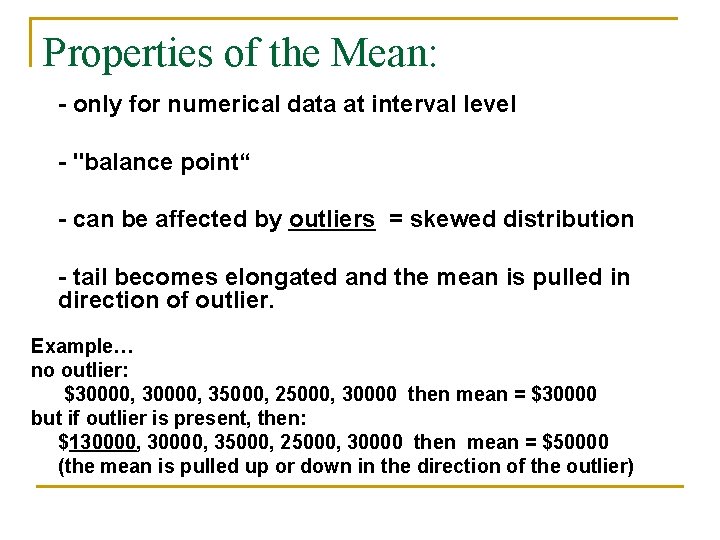
Properties of the Mean: - only for numerical data at interval level - "balance point“ - can be affected by outliers = skewed distribution - tail becomes elongated and the mean is pulled in direction of outlier. Example… no outlier: $30000, 35000, 25000, 30000 then mean = $30000 but if outlier is present, then: $130000, 35000, 25000, 30000 then mean = $50000 (the mean is pulled up or down in the direction of the outlier)
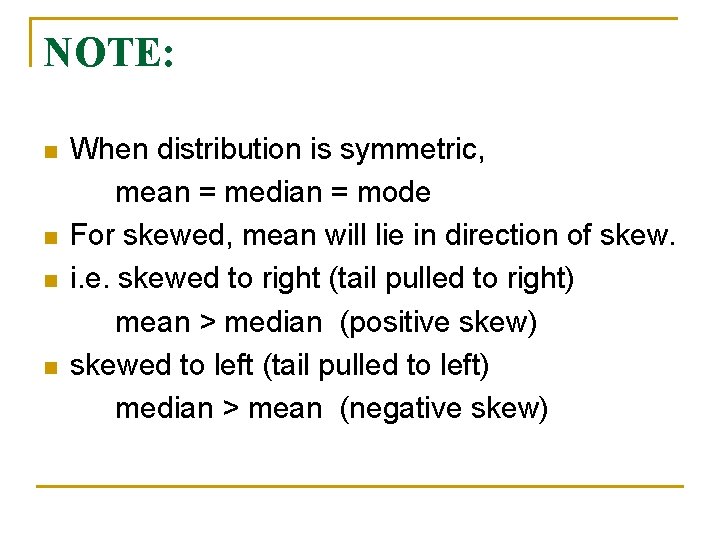
NOTE: n n When distribution is symmetric, mean = median = mode For skewed, mean will lie in direction of skew. i. e. skewed to right (tail pulled to right) mean > median (positive skew) skewed to left (tail pulled to left) median > mean (negative skew)
Measures of Dispersion n Describe how variable the data are. i. e. how spread out around the mean n Also called measures of variation or variability n
Variability for Non-numerical Data (Nominal or Ordinal Level Data) n n Measures of variability for non-numerical nominal or ordinal) data are rarely used We will not be covering these in class Omit Formula 4. 1 IQV in Healey and Prus 1 st Canadian Edition Omit Formula 3. 1 Variation Ratio in Healey and Prus 2/3 Canadian Edition
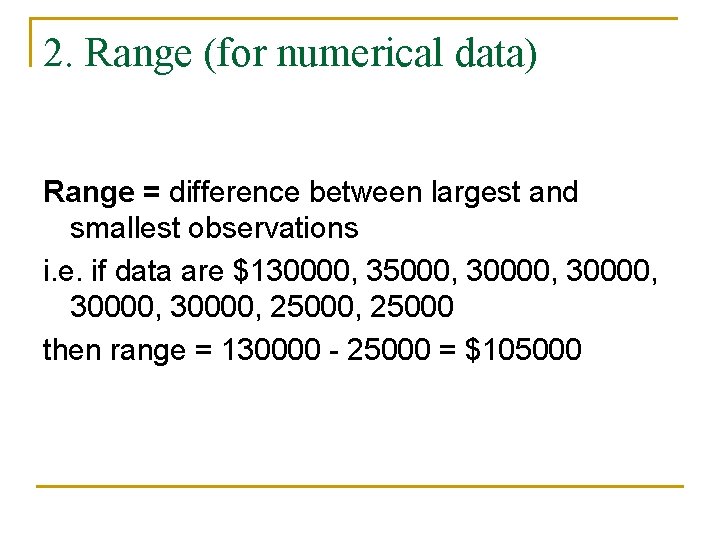
2. Range (for numerical data) Range = difference between largest and smallest observations i. e. if data are $130000, 35000, 30000, 25000 then range = 130000 - 25000 = $105000
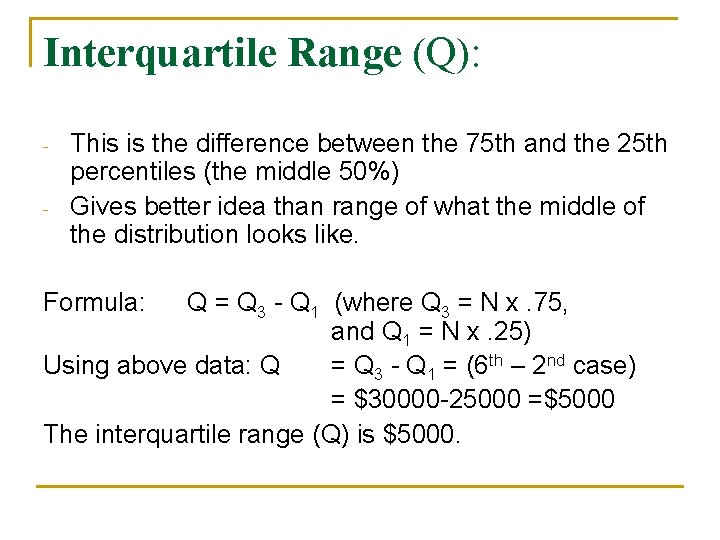
Interquartile Range (Q): - This is the difference between the 75 th and the 25 th percentiles (the middle 50%) Gives better idea than range of what the middle of the distribution looks like. Formula: Q = Q 3 - Q 1 (where Q 3 = N x. 75, and Q 1 = N x. 25) Using above data: Q = Q 3 - Q 1 = (6 th – 2 nd case) = $30000 -25000 =$5000 The interquartile range (Q) is $5000.
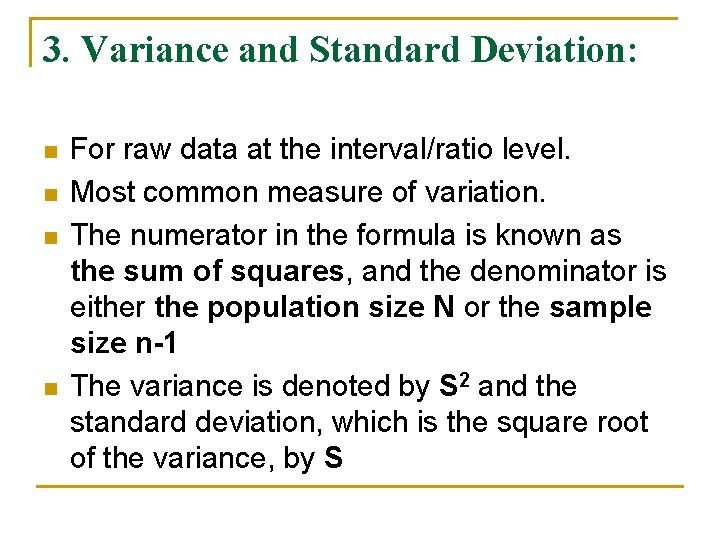
3. Variance and Standard Deviation: n n For raw data at the interval/ratio level. Most common measure of variation. The numerator in the formula is known as the sum of squares, and the denominator is either the population size N or the sample size n-1 The variance is denoted by S 2 and the standard deviation, which is the square root of the variance, by S
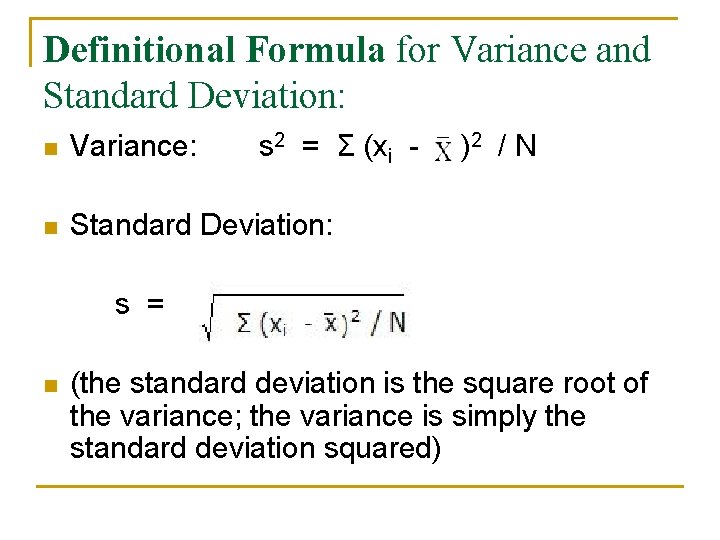
Definitional Formula for Variance and Standard Deviation: n Variance: s 2 = Σ (xi - n Standard Deviation: )2 / N s = n (the standard deviation is the square root of the variance; the variance is simply the standard deviation squared)
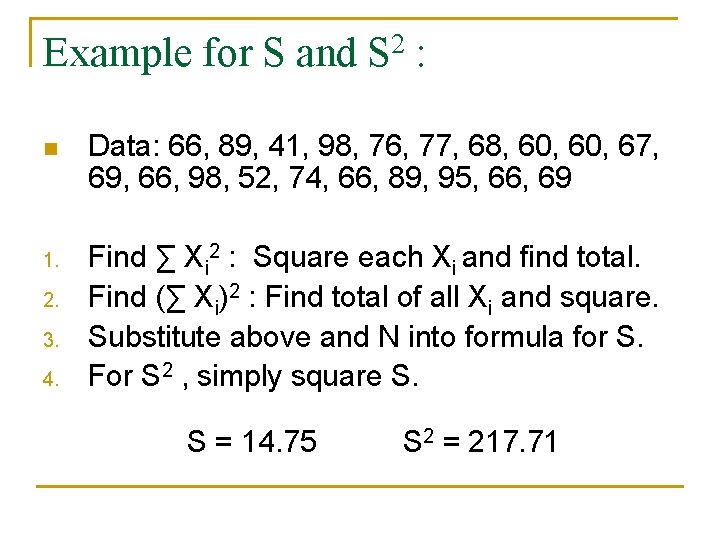
Example for S and S 2 : n Data: 66, 89, 41, 98, 76, 77, 68, 60, 67, 69, 66, 98, 52, 74, 66, 89, 95, 66, 69 1. Find ∑ Xi 2 : Square each Xi and find total. Find (∑ Xi)2 : Find total of all Xi and square. Substitute above and N into formula for S. For S 2 , simply square S. 2. 3. 4. S = 14. 75 S 2 = 217. 71
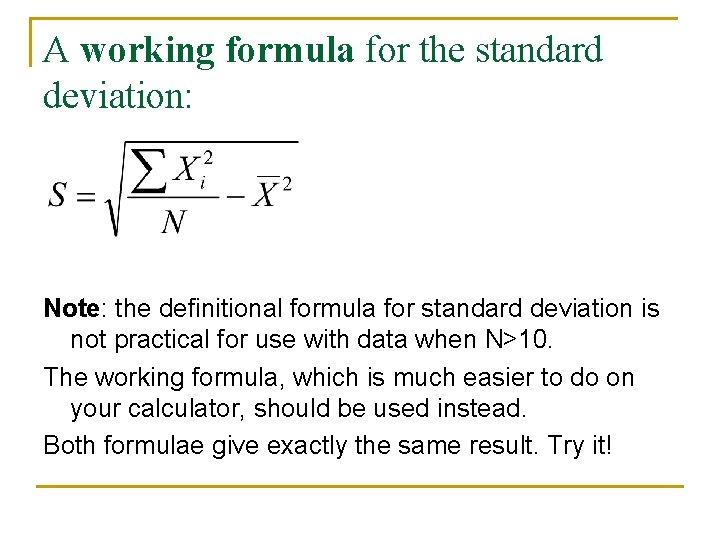
A working formula for the standard deviation: Note: the definitional formula for standard deviation is not practical for use with data when N>10. The working formula, which is much easier to do on your calculator, should be used instead. Both formulae give exactly the same result. Try it!
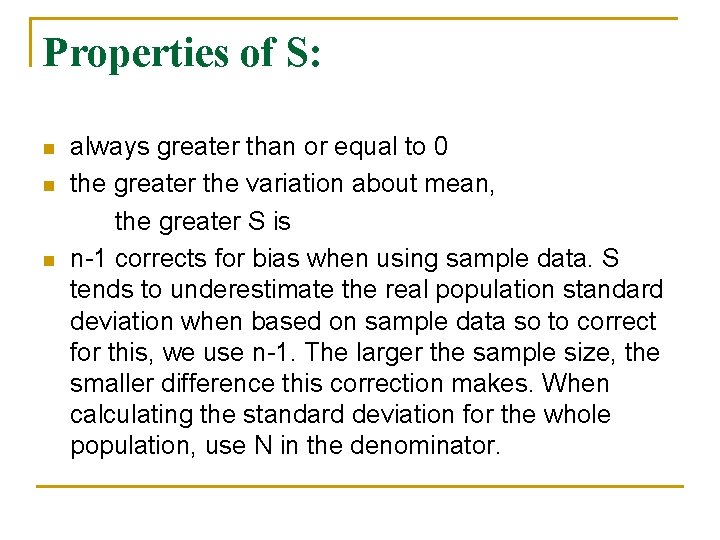
Properties of S: n n n always greater than or equal to 0 the greater the variation about mean, the greater S is n-1 corrects for bias when using sample data. S tends to underestimate the real population standard deviation when based on sample data so to correct for this, we use n-1. The larger the sample size, the smaller difference this correction makes. When calculating the standard deviation for the whole population, use N in the denominator.
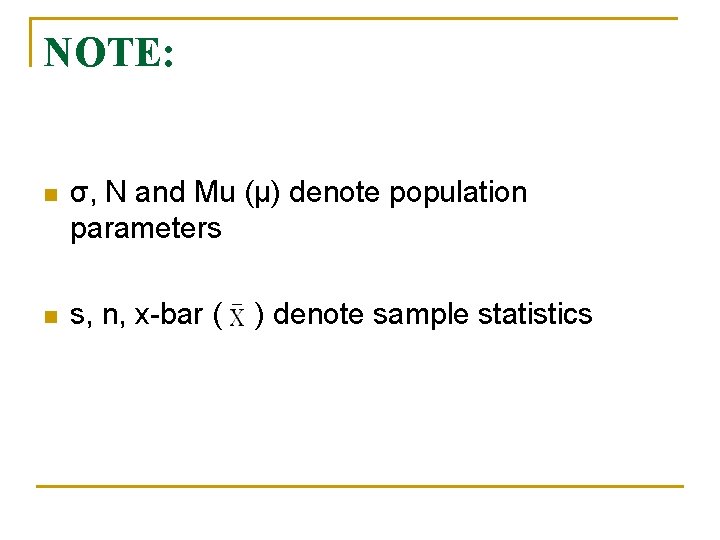
NOTE: n σ, N and Mu (µ) denote population parameters n s, n, x-bar ( ) denote sample statistics
Remember the Rounding Rules! n Always use as many decimal places as your calculator can handle. n Round your final answer to 2 decimal places, rounding to nearest number. n Engineers Rule: When last digit is exactly 5 (followed by 0’s), round the digit before the last digit to nearest EVEN number.
Homework Questions n n Healey and Prus 1 e: #3. 1, #3. 5, #3. 11 and 4. 9, #4. 15 n Healey and Prus 2/3 e #3. 1, #3. 5, #3. 11 (compute s for 8 nations also), #3. 15 n SPSS: n q q Read the SPSS sections for Ch. 3 and 4 in 1 st Cdn. Edition and for Ch. 4 in 2/3 Cdn. Edition Try some of the SPSS exercises for practice