Dedicated to Pramitha Chowrira the Goddess of the
- Slides: 48

Dedicated to Pramitha Chowrira, the Goddess of the Rockies, Mike Waldron, the Student who became the Master, Sheryl Driscoll, who leads purely for the glory and Ann Bischoff, who took me in trade for a developer. . . How STATSPACK Was Used to Solve Common Performance Issues Brian Hitchcock OCP 8, 8 i, 9 i DBA Sun Microsystems brian. hitchcock@sun. com brhora@aol. com No. COUG Brian Hitchcock November 13, 2003 Page 1

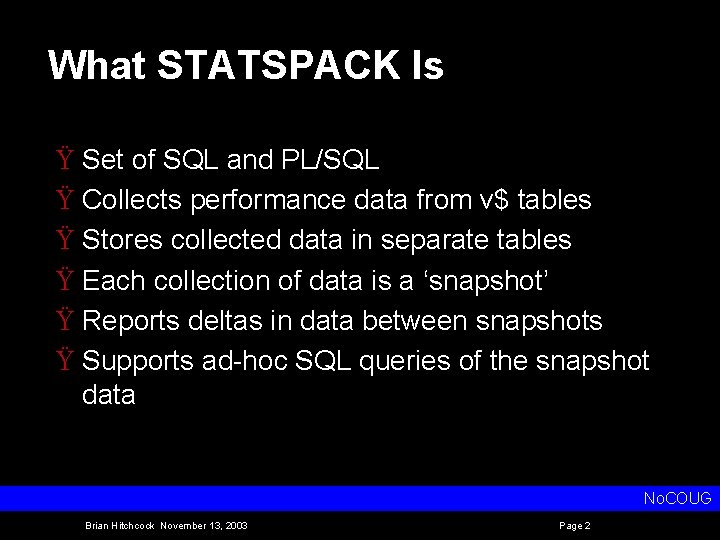
What STATSPACK Is Ÿ Set of SQL and PL/SQL Ÿ Collects performance data from v$ tables Ÿ Stores collected data in separate tables Ÿ Each collection of data is a ‘snapshot’ Ÿ Reports deltas in data between snapshots Ÿ Supports ad hoc SQL queries of the snapshot data No. COUG Brian Hitchcock November 13, 2003 Page 2

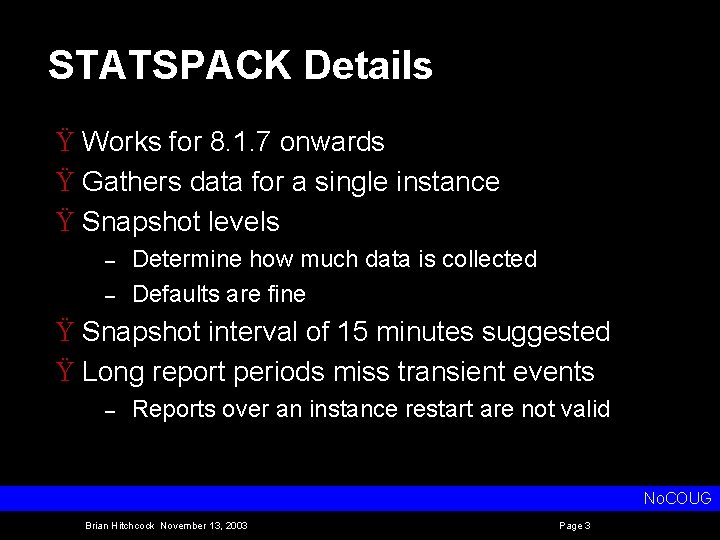
STATSPACK Details Ÿ Works for 8. 1. 7 onwards Ÿ Gathers data for a single instance Ÿ Snapshot levels – – Determine how much data is collected Defaults are fine Ÿ Snapshot interval of 15 minutes suggested Ÿ Long report periods miss transient events – Reports over an instance restart are not valid No. COUG Brian Hitchcock November 13, 2003 Page 3

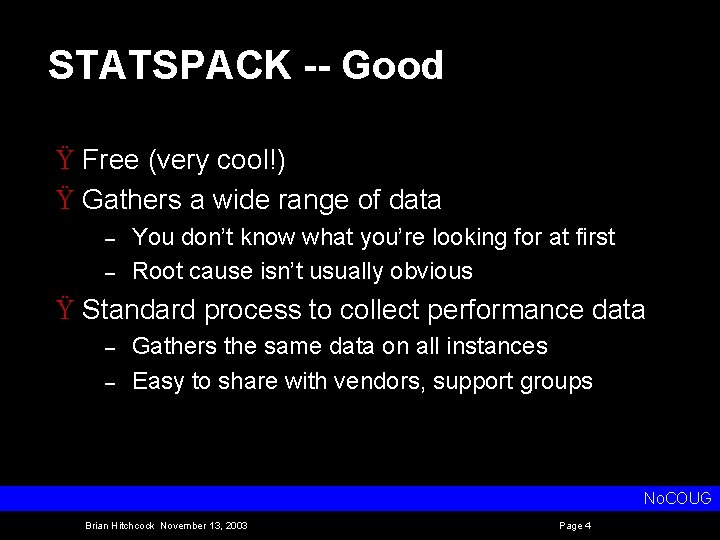
STATSPACK -- Good Ÿ Free (very cool!) Ÿ Gathers a wide range of data – – You don’t know what you’re looking for at first Root cause isn’t usually obvious Ÿ Standard process to collect performance data – – Gathers the same data on all instances Easy to share with vendors, support groups No. COUG Brian Hitchcock November 13, 2003 Page 4

STATSPACK -- Not Perfect Ÿ Gathers a wide range of data – – – Ocean of data Any information? Easy to get lost Ÿ Does not tell you what the problem is – – Shows what is happening in the instance You need to figure out if this is a problem or not Ÿ Does not tell you the solution Ÿ Does not tell you that you are done tuning. . . No. COUG Brian Hitchcock November 13, 2003 Page 5

How to Interpret Output? Ÿ Requires experience with your system – – – No single way to analyze output Must have history of your system Look for possible problem areas Trial and error to change problem behavior Only you can tell if you have a performance problem No. COUG Brian Hitchcock November 13, 2003 Page 6

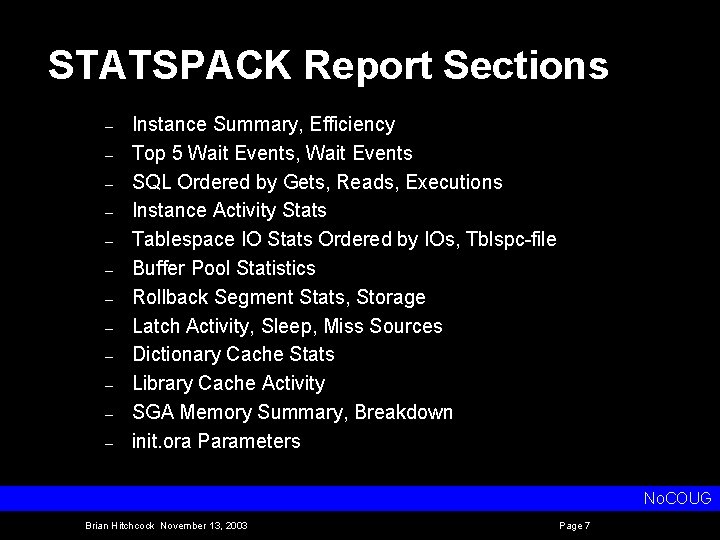
STATSPACK Report Sections – – – Instance Summary, Efficiency Top 5 Wait Events, Wait Events SQL Ordered by Gets, Reads, Executions Instance Activity Stats Tablespace IO Stats Ordered by IOs, Tblspc file Buffer Pool Statistics Rollback Segment Stats, Storage Latch Activity, Sleep, Miss Sources Dictionary Cache Stats Library Cache Activity SGA Memory Summary, Breakdown init. ora Parameters No. COUG Brian Hitchcock November 13, 2003 Page 7

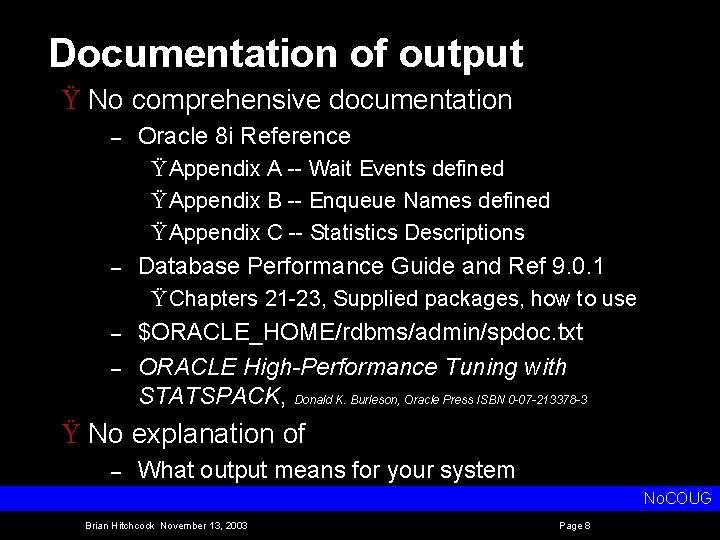
Documentation of output Ÿ No comprehensive documentation – Oracle 8 i Reference Ÿ Appendix A Wait Events defined Ÿ Appendix B Enqueue Names defined Ÿ Appendix C Statistics Descriptions – Database Performance Guide and Ref 9. 0. 1 Ÿ Chapters 21 23, Supplied packages, how to use – – $ORACLE_HOME/rdbms/admin/spdoc. txt ORACLE High-Performance Tuning with STATSPACK, Donald K. Burleson, Oracle Press ISBN 0 -07 -213378 -3 Ÿ No explanation of – What output means for your system No. COUG Brian Hitchcock November 13, 2003 Page 8

Configuration Used Ÿ Oracle 8. 1. 7. 2 Ÿ Snapshots every 15 minutes – snapshots taken continuously Ÿ Default STATSPACK snapshot ‘level’ Ÿ Application loads and analyzes web site click stream data – – – Lots of data More data all the time We don’t know what vendor code looks like No. COUG Brian Hitchcock November 13, 2003 Page 9

Actual Use Ÿ 4 Performance issues in 2002 – Case 1) Reports Running Slow Ÿ STATSPACK output didn’t show the problem – Case 2) Vendor Demo Slow Ÿ STATSPACK output didn’t show the problem – Case 3) Data Load Slow Ÿ STATSPACK output led to 18 x speedup (1800%) – Case 4) Data Load Time Varies Ÿ STATSPACK output led to the root cause No. COUG Brian Hitchcock November 13, 2003 Page 10

Case 1) Reports Running Slow Ÿ Vendor code allows users to setup reports – Vendor code generates SQL for report Ÿ Long run interferes with next day’s data load Ÿ STATSPACK captures SQL – Generate explain plan(s) Ÿ Report SQL doesn’t generate where clause properly to use partition pruning Ÿ Vendor refuses to change their code Ÿ We simply removed the reports – Performance issue ‘resolved’ No. COUG Brian Hitchcock November 13, 2003 Page 11

Case 2) Vendor Demo Slow Ÿ Due to issues like Case 1) – – – – New vendor sets up demo, data load slow Data load runs twice as fast at vendor Statspack output doesn’t show anything obvious Compare configuration of vendor and our dbs Vendor has only one redo log file per group We had two redo log files per group We drop one file per group, performance issue resolved No. COUG Brian Hitchcock November 13, 2003 Page 12

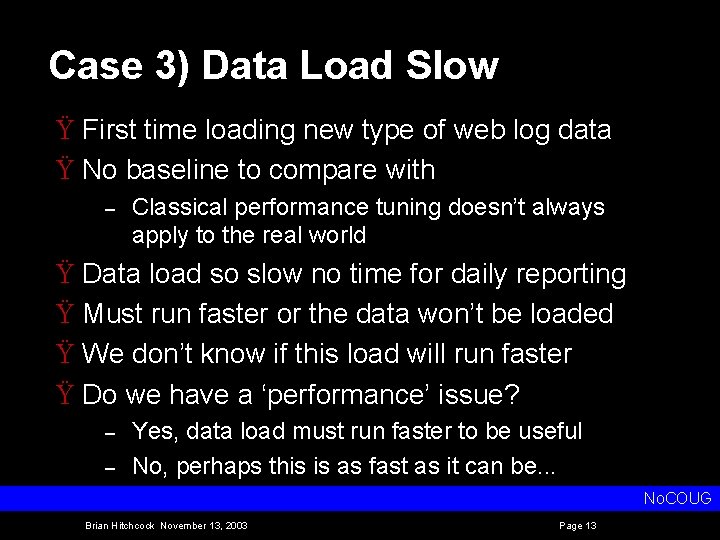
Case 3) Data Load Slow Ÿ First time loading new type of web log data Ÿ No baseline to compare with – Classical performance tuning doesn’t always apply to the real world Ÿ Data load so slow no time for daily reporting Ÿ Must run faster or the data won’t be loaded Ÿ We don’t know if this load will run faster Ÿ Do we have a ‘performance’ issue? – – Yes, data load must run faster to be useful No, perhaps this is as fast as it can be. . . No. COUG Brian Hitchcock November 13, 2003 Page 13

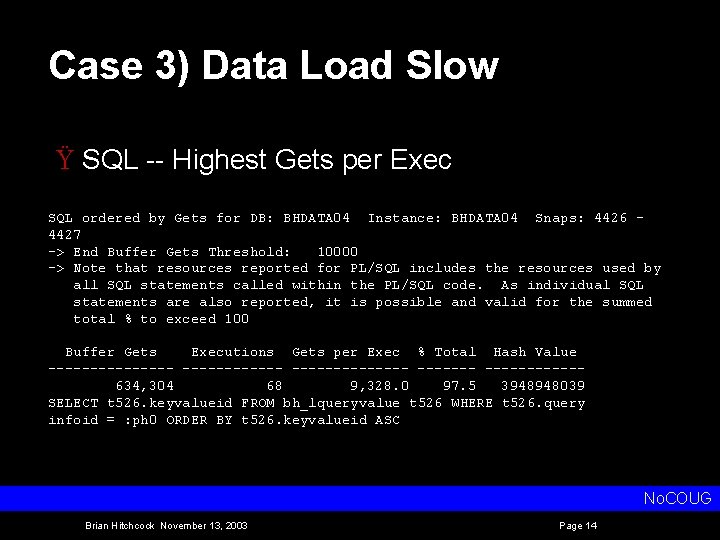
Case 3) Data Load Slow Ÿ SQL Highest Gets per Exec SQL ordered by Gets for DB: BHDATA 04 Instance: BHDATA 04 Snaps: 4426 4427 -> End Buffer Gets Threshold: 10000 -> Note that resources reported for PL/SQL includes the resources used by all SQL statements called within the PL/SQL code. As individual SQL statements are also reported, it is possible and valid for the summed total % to exceed 100 Buffer Gets Executions Gets per Exec % Total Hash Value -------------------634, 304 68 9, 328. 0 97. 5 3948948039 SELECT t 526. keyvalueid FROM bh_lqueryvalue t 526 WHERE t 526. query infoid = : ph 0 ORDER BY t 526. keyvalueid ASC No. COUG Brian Hitchcock November 13, 2003 Page 14

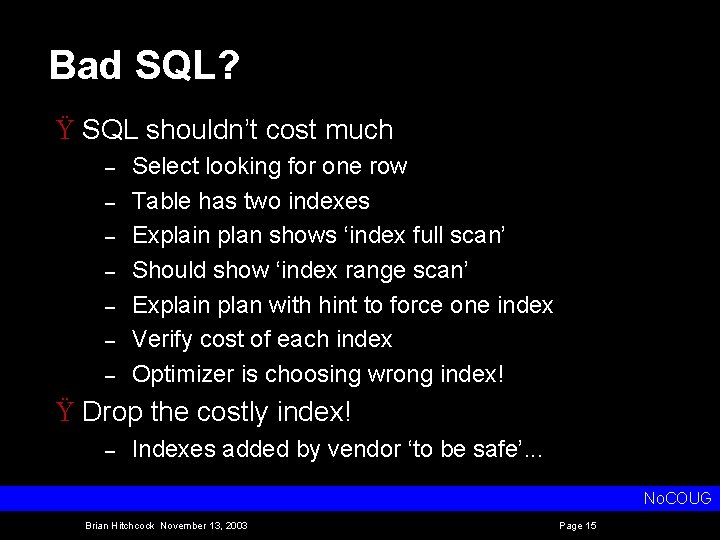
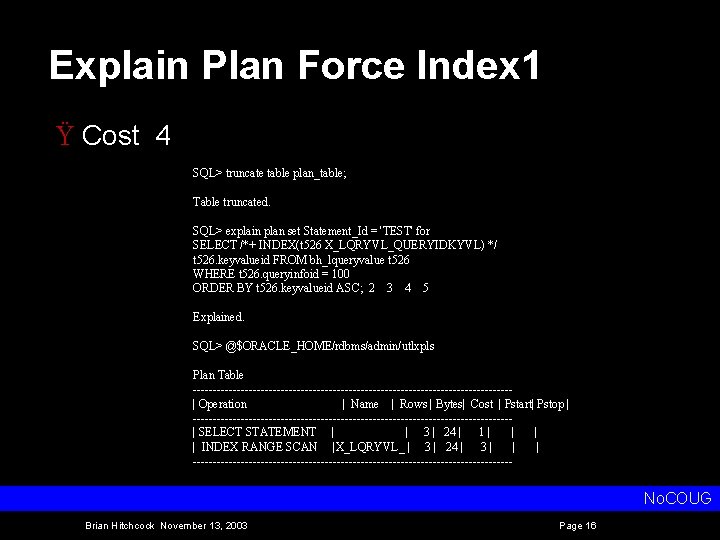
Bad SQL? Ÿ SQL shouldn’t cost much – – – – Select looking for one row Table has two indexes Explain plan shows ‘index full scan’ Should show ‘index range scan’ Explain plan with hint to force one index Verify cost of each index Optimizer is choosing wrong index! Ÿ Drop the costly index! – Indexes added by vendor ‘to be safe’. . . No. COUG Brian Hitchcock November 13, 2003 Page 15

Explain Plan Force Index 1 Ÿ Cost 4 SQL> truncate table plan_table; Table truncated. SQL> explain plan set Statement_Id = 'TEST' for SELECT /*+ INDEX(t 526 X_LQRYVL_QUERYIDKYVL) */ t 526. keyvalueid FROM bh_lqueryvalue t 526 WHERE t 526. queryinfoid = 100 ORDER BY t 526. keyvalueid ASC; 2 3 4 5 Explained. SQL> @$ORACLE_HOME/rdbms/admin/utlxpls Plan Table ----------------------------------------| Operation | Name | Rows | Bytes| Cost | Pstart| Pstop | ----------------------------------------| SELECT STATEMENT | | 3 | 24 | 1| | INDEX RANGE SCAN |X_LQRYVL_ | 3 | 24 | 3| | | ---------------------------------------- No. COUG Brian Hitchcock November 13, 2003 Page 16

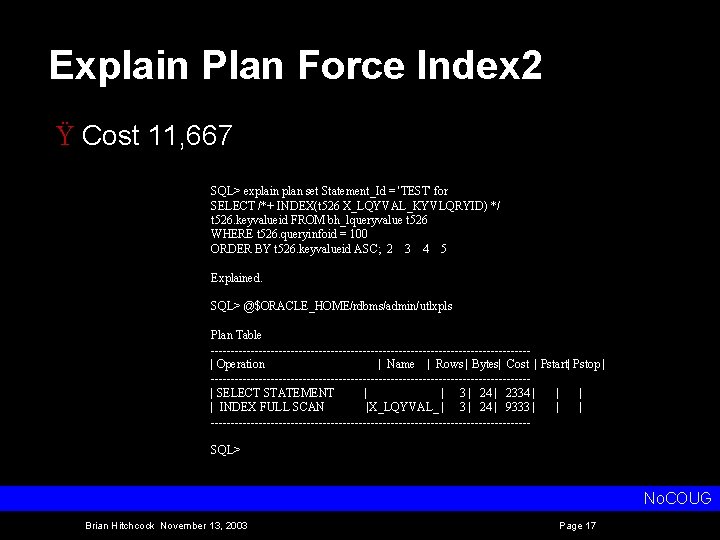
Explain Plan Force Index 2 Ÿ Cost 11, 667 SQL> explain plan set Statement_Id = 'TEST' for SELECT /*+ INDEX(t 526 X_LQYVAL_KYVLQRYID) */ t 526. keyvalueid FROM bh_lqueryvalue t 526 WHERE t 526. queryinfoid = 100 ORDER BY t 526. keyvalueid ASC; 2 3 4 5 Explained. SQL> @$ORACLE_HOME/rdbms/admin/utlxpls Plan Table ----------------------------------------| Operation | Name | Rows | Bytes| Cost | Pstart| Pstop | ----------------------------------------| SELECT STATEMENT | | 3 | 24 | 2334 | | INDEX FULL SCAN |X_LQYVAL_ | 3 | 24 | 9333 | | | ----------------------------------------SQL> No. COUG Brian Hitchcock November 13, 2003 Page 17

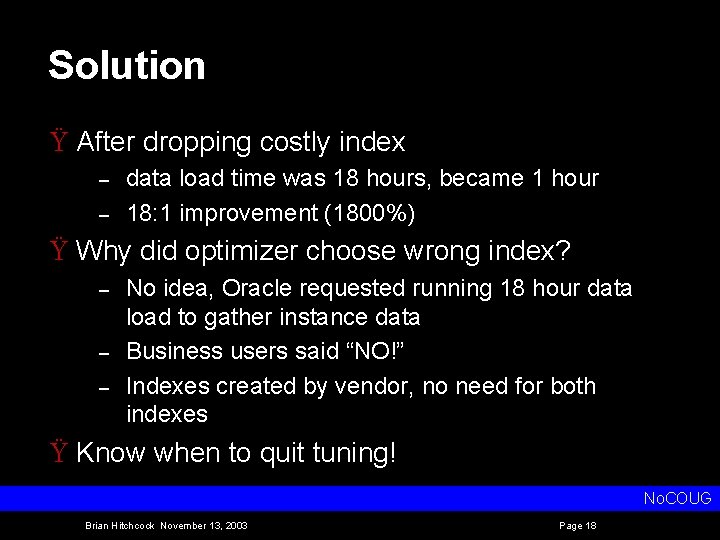
Solution Ÿ After dropping costly index – – data load time was 18 hours, became 1 hour 18: 1 improvement (1800%) Ÿ Why did optimizer choose wrong index? – – – No idea, Oracle requested running 18 hour data load to gather instance data Business users said “NO!” Indexes created by vendor, no need for both indexes Ÿ Know when to quit tuning! No. COUG Brian Hitchcock November 13, 2003 Page 18

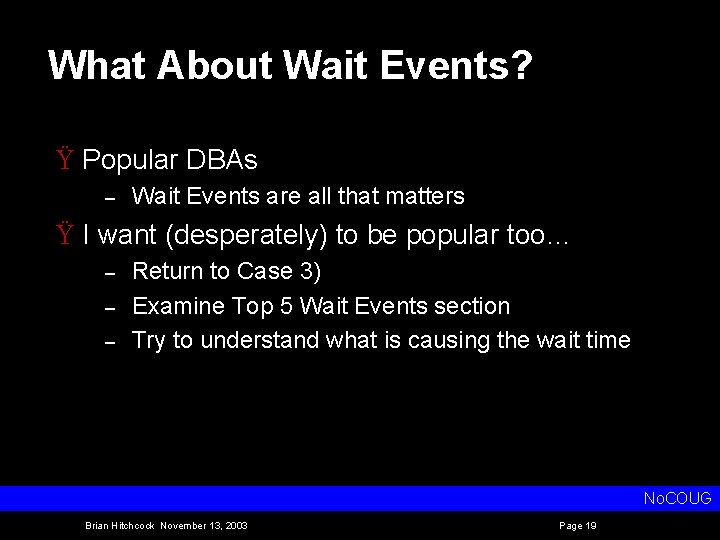
What About Wait Events? Ÿ Popular DBAs – Wait Events are all that matters Ÿ I want (desperately) to be popular too… – – – Return to Case 3) Examine Top 5 Wait Events section Try to understand what is causing the wait time No. COUG Brian Hitchcock November 13, 2003 Page 19

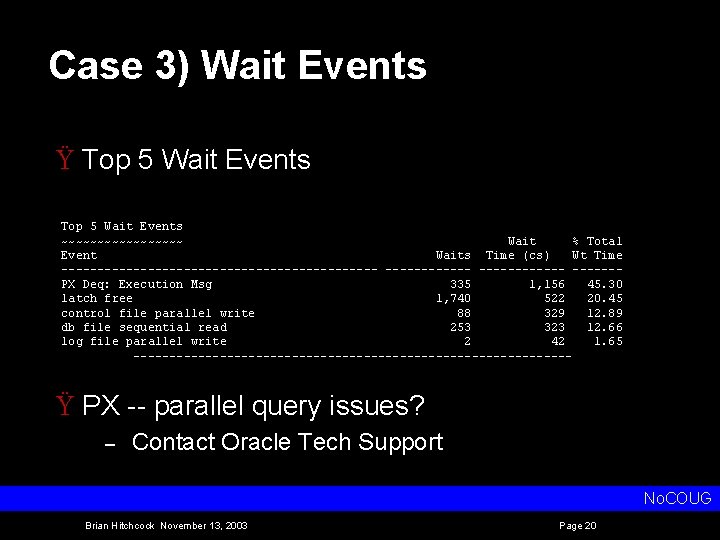
Case 3) Wait Events Ÿ Top 5 Wait Events ~~~~~~~~~ Wait % Total Event Waits Time (cs) Wt Time ---------------------- ------PX Deq: Execution Msg 335 1, 156 45. 30 latch free 1, 740 522 20. 45 control file parallel write 88 329 12. 89 db file sequential read 253 323 12. 66 log file parallel write 2 42 1. 65 ------------------------------- Ÿ PX parallel query issues? – Contact Oracle Tech Support No. COUG Brian Hitchcock November 13, 2003 Page 20

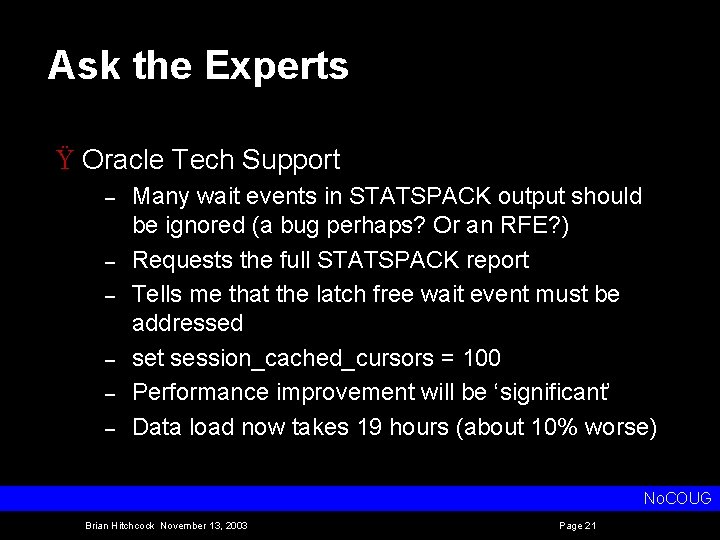
Ask the Experts Ÿ Oracle Tech Support – – – Many wait events in STATSPACK output should be ignored (a bug perhaps? Or an RFE? ) Requests the full STATSPACK report Tells me that the latch free wait event must be addressed set session_cached_cursors = 100 Performance improvement will be ‘significant’ Data load now takes 19 hours (about 10% worse) No. COUG Brian Hitchcock November 13, 2003 Page 21

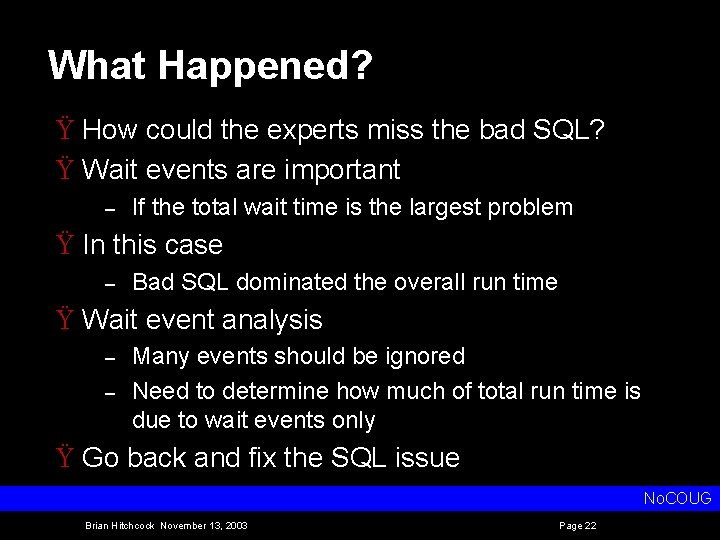
What Happened? Ÿ How could the experts miss the bad SQL? Ÿ Wait events are important – If the total wait time is the largest problem Ÿ In this case – Bad SQL dominated the overall run time Ÿ Wait event analysis – – Many events should be ignored Need to determine how much of total run time is due to wait events only Ÿ Go back and fix the SQL issue No. COUG Brian Hitchcock November 13, 2003 Page 22

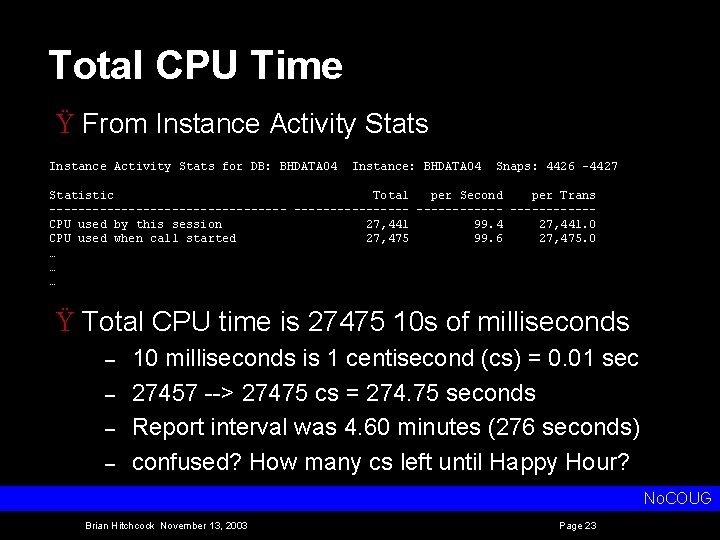
Total CPU Time Ÿ From Instance Activity Stats for DB: BHDATA 04 Instance: BHDATA 04 Snaps: 4426 -4427 Statistic Total per Second per Trans ----------------- ------CPU used by this session 27, 441 99. 4 27, 441. 0 CPU used when call started 27, 475 99. 6 27, 475. 0 … … … Ÿ Total CPU time is 27475 10 s of milliseconds – – 10 milliseconds is 1 centisecond (cs) = 0. 01 sec 27457 > 27475 cs = 274. 75 seconds Report interval was 4. 60 minutes (276 seconds) confused? How many cs left until Happy Hour? No. COUG Brian Hitchcock November 13, 2003 Page 23

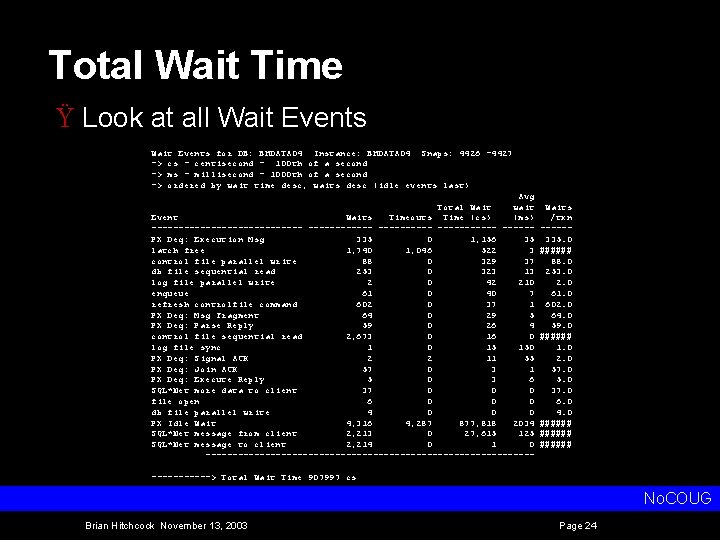
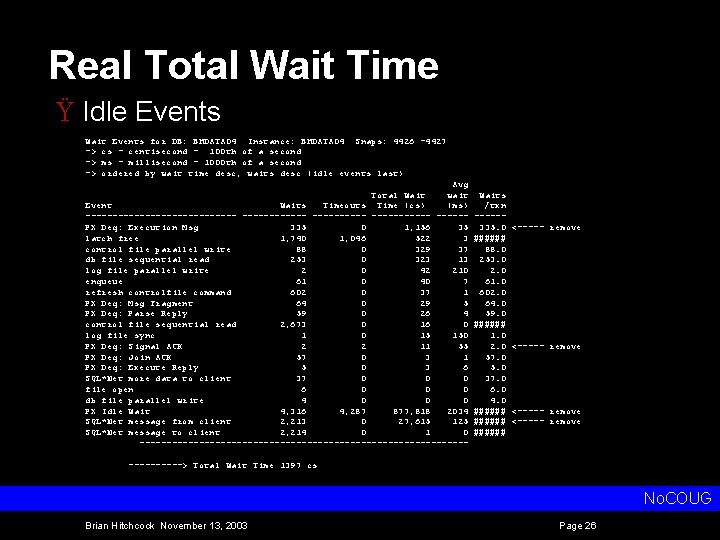
Total Wait Time Ÿ Look at all Wait Events for DB: BHDATA 04 Instance: BHDATA 04 Snaps: 4426 -4427 -> cs - centisecond - 100 th of a second -> ms - millisecond - 1000 th of a second -> ordered by wait time desc, waits desc (idle events last) Avg Total Wait wait Event Waits Timeouts Time (cs) (ms) -------------- -----------PX Deq: Execution Msg 335 0 1, 156 35 latch free 1, 740 1, 046 522 3 control file parallel write 88 0 329 37 db file sequential read 253 0 323 13 log file parallel write 2 0 42 210 enqueue 61 0 40 7 refresh controlfile command 602 0 37 1 PX Deq: Msg Fragment 64 0 29 5 PX Deq: Parse Reply 59 0 26 4 control file sequential read 2, 673 0 16 0 log file sync 1 0 15 150 PX Deq: Signal ACK 2 2 11 55 PX Deq: Join ACK 57 0 3 1 PX Deq: Execute Reply 5 0 3 6 SQL*Net more data to client 37 0 0 0 file open 6 0 0 0 db file parallel write 4 0 0 0 PX Idle Wait 4, 316 4, 287 877, 818 2034 SQL*Net message from client 2, 213 0 27, 615 125 SQL*Net message to client 2, 214 0 1 0 ------------------------------- Waits /txn -----335. 0 ###### 88. 0 253. 0 2. 0 61. 0 602. 0 64. 0 59. 0 ###### 1. 0 2. 0 57. 0 5. 0 37. 0 6. 0 4. 0 ###### ------> Total Wait Time 907997 cs No. COUG Brian Hitchcock November 13, 2003 Page 24

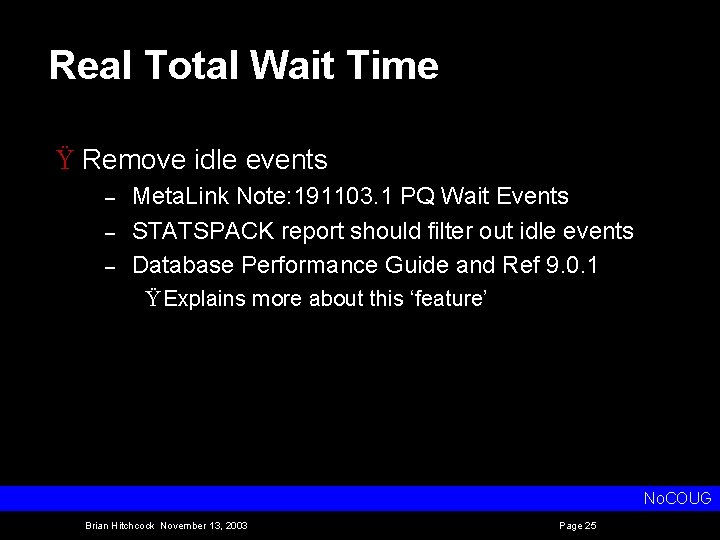
Real Total Wait Time Ÿ Remove idle events – – – Meta. Link Note: 191103. 1 PQ Wait Events STATSPACK report should filter out idle events Database Performance Guide and Ref 9. 0. 1 Ÿ Explains more about this ‘feature’ No. COUG Brian Hitchcock November 13, 2003 Page 25

Real Total Wait Time Ÿ Idle Events Wait Events for DB: BHDATA 04 Instance: BHDATA 04 Snaps: 4426 -4427 -> cs - centisecond - 100 th of a second -> ms - millisecond - 1000 th of a second -> ordered by wait time desc, waits desc (idle events last) Avg Total Wait wait Event Waits Timeouts Time (cs) (ms) -------------- -----------PX Deq: Execution Msg 335 0 1, 156 35 latch free 1, 740 1, 046 522 3 control file parallel write 88 0 329 37 db file sequential read 253 0 323 13 log file parallel write 2 0 42 210 enqueue 61 0 40 7 refresh controlfile command 602 0 37 1 PX Deq: Msg Fragment 64 0 29 5 PX Deq: Parse Reply 59 0 26 4 control file sequential read 2, 673 0 16 0 log file sync 1 0 15 150 PX Deq: Signal ACK 2 2 11 55 PX Deq: Join ACK 57 0 3 1 PX Deq: Execute Reply 5 0 3 6 SQL*Net more data to client 37 0 0 0 file open 6 0 0 0 db file parallel write 4 0 0 0 PX Idle Wait 4, 316 4, 287 877, 818 2034 SQL*Net message from client 2, 213 0 27, 615 125 SQL*Net message to client 2, 214 0 1 0 ------------------------------- Waits /txn -----335. 0 ###### 88. 0 253. 0 2. 0 61. 0 602. 0 64. 0 59. 0 ###### 1. 0 2. 0 57. 0 5. 0 37. 0 6. 0 4. 0 ###### <----- remove -----> Total Wait Time 1397 cs No. COUG Brian Hitchcock November 13, 2003 Page 26

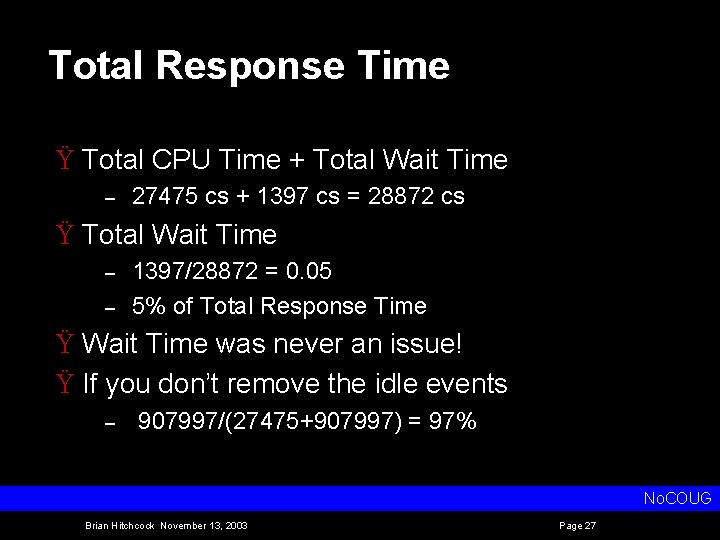
Total Response Time Ÿ Total CPU Time + Total Wait Time – 27475 cs + 1397 cs = 28872 cs Ÿ Total Wait Time – – 1397/28872 = 0. 05 5% of Total Response Time Ÿ Wait Time was never an issue! Ÿ If you don’t remove the idle events – 907997/(27475+907997) = 97% No. COUG Brian Hitchcock November 13, 2003 Page 27

Bad SQL Rules Ÿ Slow data load time – – Time due to Bad SQL Time due All Others Ÿ Including Wait Events No. COUG Brian Hitchcock November 13, 2003 Page 28

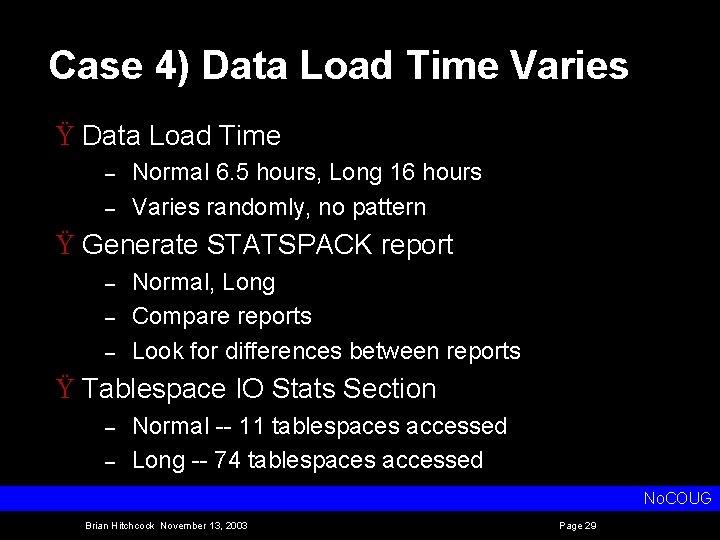
Case 4) Data Load Time Varies Ÿ Data Load Time – – Normal 6. 5 hours, Long 16 hours Varies randomly, no pattern Ÿ Generate STATSPACK report – – – Normal, Long Compare reports Look for differences between reports Ÿ Tablespace IO Stats Section – – Normal 11 tablespaces accessed Long 74 tablespaces accessed No. COUG Brian Hitchcock November 13, 2003 Page 29

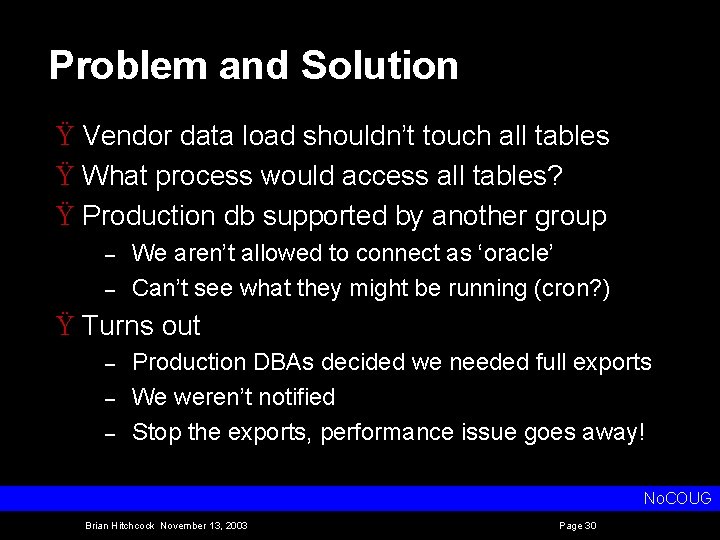
Problem and Solution Ÿ Vendor data load shouldn’t touch all tables Ÿ What process would access all tables? Ÿ Production db supported by another group – – We aren’t allowed to connect as ‘oracle’ Can’t see what they might be running (cron? ) Ÿ Turns out – – – Production DBAs decided we needed full exports We weren’t notified Stop the exports, performance issue goes away! No. COUG Brian Hitchcock November 13, 2003 Page 30

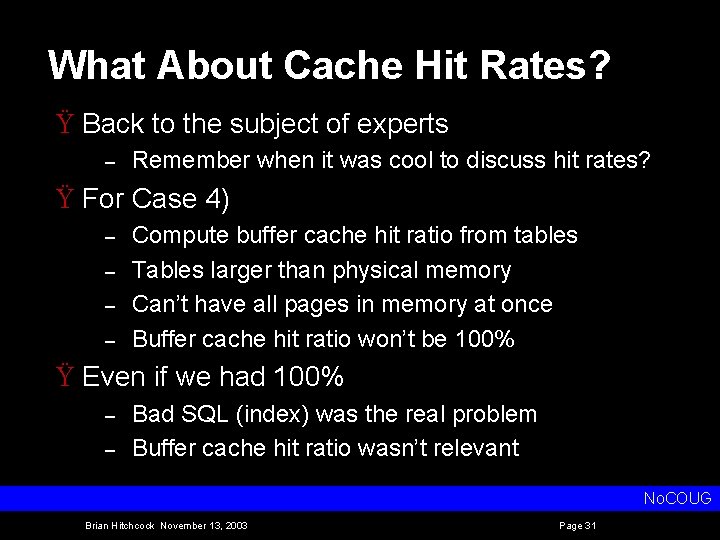
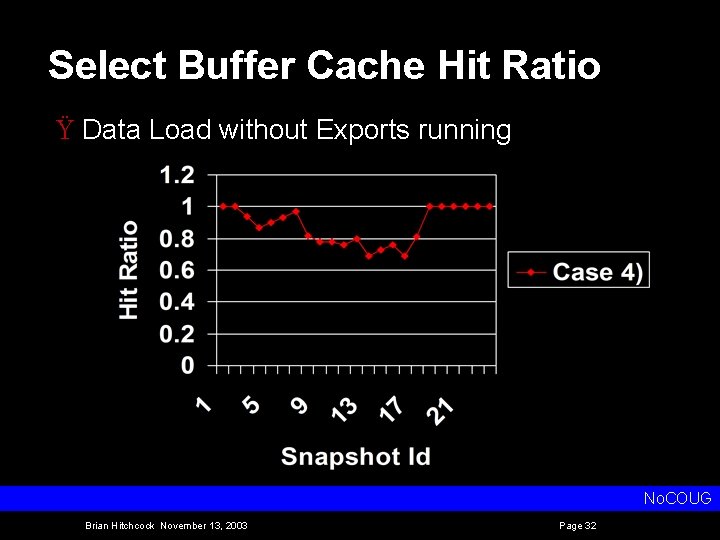
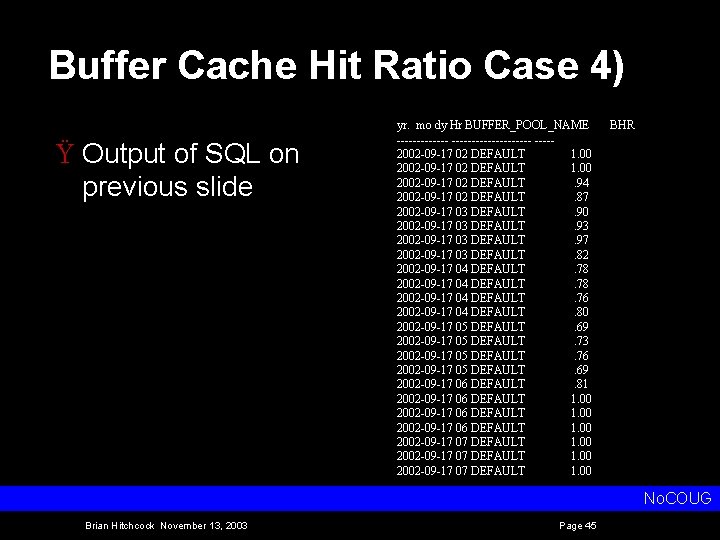
What About Cache Hit Rates? Ÿ Back to the subject of experts – Remember when it was cool to discuss hit rates? Ÿ For Case 4) – – Compute buffer cache hit ratio from tables Tables larger than physical memory Can’t have all pages in memory at once Buffer cache hit ratio won’t be 100% Ÿ Even if we had 100% – – Bad SQL (index) was the real problem Buffer cache hit ratio wasn’t relevant No. COUG Brian Hitchcock November 13, 2003 Page 31

Select Buffer Cache Hit Ratio Ÿ Data Load without Exports running No. COUG Brian Hitchcock November 13, 2003 Page 32

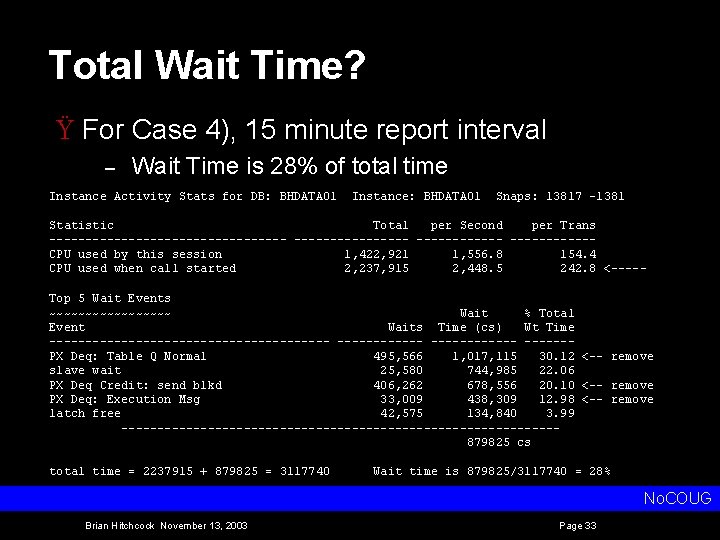
Total Wait Time? Ÿ For Case 4), 15 minute report interval – Wait Time is 28% of total time Instance Activity Stats for DB: BHDATA 01 Instance: BHDATA 01 Snaps: 13817 -1381 Statistic Total per Second per Trans ----------------- ------CPU used by this session 1, 422, 921 1, 556. 8 154. 4 CPU used when call started 2, 237, 915 2, 448. 5 242. 8 <----Top 5 Wait Events ~~~~~~~~~ Wait % Total Event Waits Time (cs) Wt Time -------------------- ------PX Deq: Table Q Normal 495, 566 1, 017, 115 30. 12 <-- remove slave wait 25, 580 744, 985 22. 06 PX Deq Credit: send blkd 406, 262 678, 556 20. 10 <-- remove PX Deq: Execution Msg 33, 009 438, 309 12. 98 <-- remove latch free 42, 575 134, 840 3. 99 ------------------------------879825 cs total time = 2237915 + 879825 = 3117740 Wait time is 879825/3117740 = 28% No. COUG Brian Hitchcock November 13, 2003 Page 33

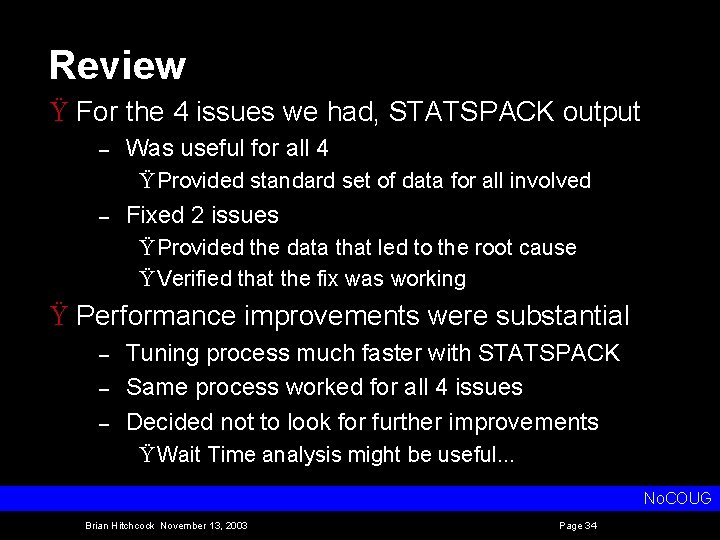
Review Ÿ For the 4 issues we had, STATSPACK output – Was useful for all 4 Ÿ Provided standard set of data for all involved – Fixed 2 issues Ÿ Provided the data that led to the root cause Ÿ Verified that the fix was working Ÿ Performance improvements were substantial – – – Tuning process much faster with STATSPACK Same process worked for all 4 issues Decided not to look for further improvements Ÿ Wait Time analysis might be useful. . . No. COUG Brian Hitchcock November 13, 2003 Page 34

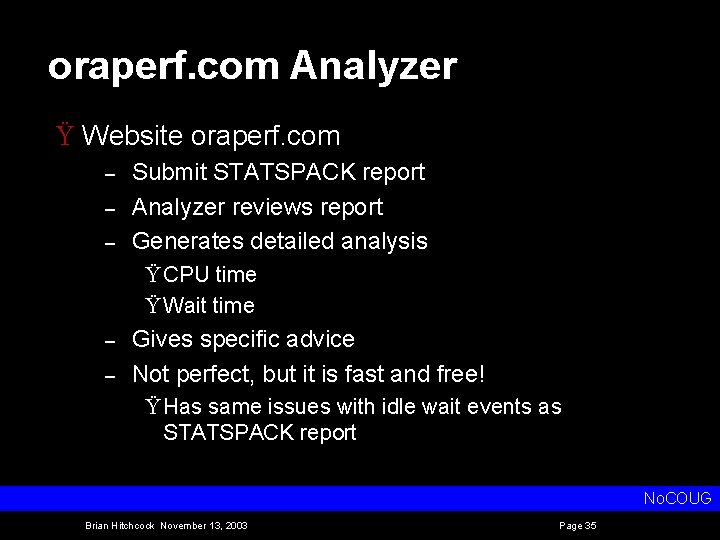
oraperf. com Analyzer Ÿ Website oraperf. com – – – Submit STATSPACK report Analyzer reviews report Generates detailed analysis Ÿ CPU time Ÿ Wait time – – Gives specific advice Not perfect, but it is fast and free! Ÿ Has same issues with idle wait events as STATSPACK report No. COUG Brian Hitchcock November 13, 2003 Page 35

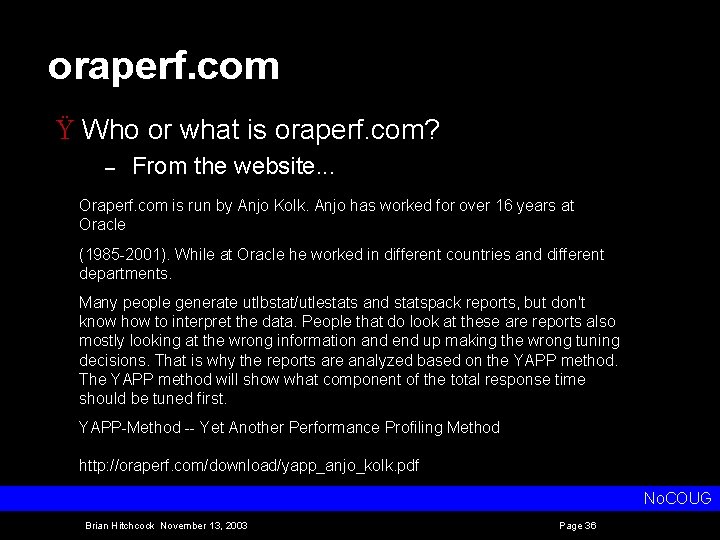
oraperf. com Ÿ Who or what is oraperf. com? – From the website. . . Oraperf. com is run by Anjo Kolk. Anjo has worked for over 16 years at Oracle (1985 2001). While at Oracle he worked in different countries and different departments. Many people generate utlbstat/utlestats and statspack reports, but don't know how to interpret the data. People that do look at these are reports also mostly looking at the wrong information and end up making the wrong tuning decisions. That is why the reports are analyzed based on the YAPP method. The YAPP method will show what component of the total response time should be tuned first. YAPP Method Yet Another Performance Profiling Method http: //oraperf. com/download/yapp_anjo_kolk. pdf No. COUG Brian Hitchcock November 13, 2003 Page 36

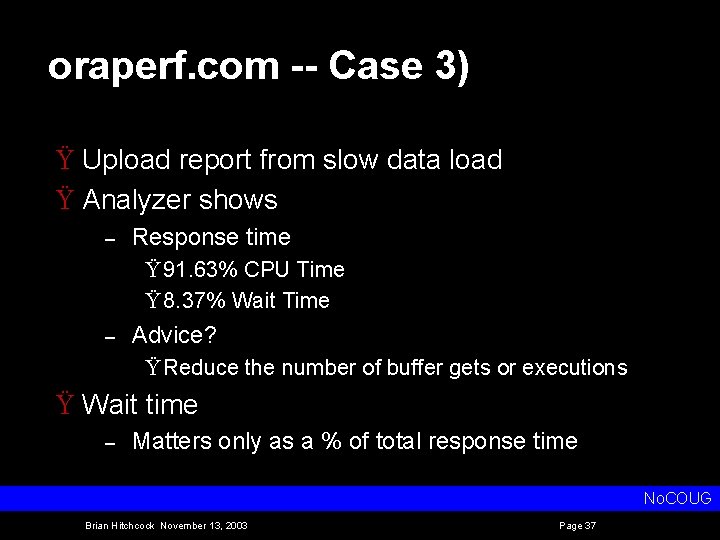
oraperf. com -- Case 3) Ÿ Upload report from slow data load Ÿ Analyzer shows – Response time Ÿ 91. 63% CPU Time Ÿ 8. 37% Wait Time – Advice? Ÿ Reduce the number of buffer gets or executions Ÿ Wait time – Matters only as a % of total response time No. COUG Brian Hitchcock November 13, 2003 Page 37

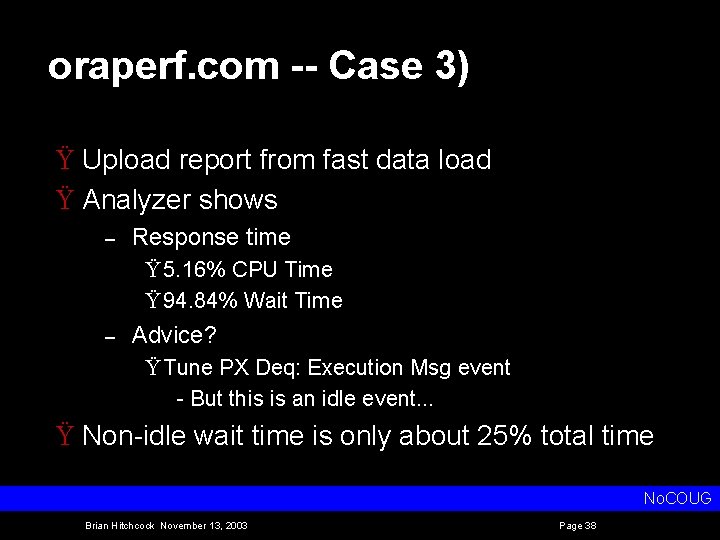
oraperf. com -- Case 3) Ÿ Upload report from fast data load Ÿ Analyzer shows – Response time Ÿ 5. 16% CPU Time Ÿ 94. 84% Wait Time – Advice? Ÿ Tune PX Deq: Execution Msg event But this is an idle event. . . Ÿ Non idle wait time is only about 25% total time No. COUG Brian Hitchcock November 13, 2003 Page 38

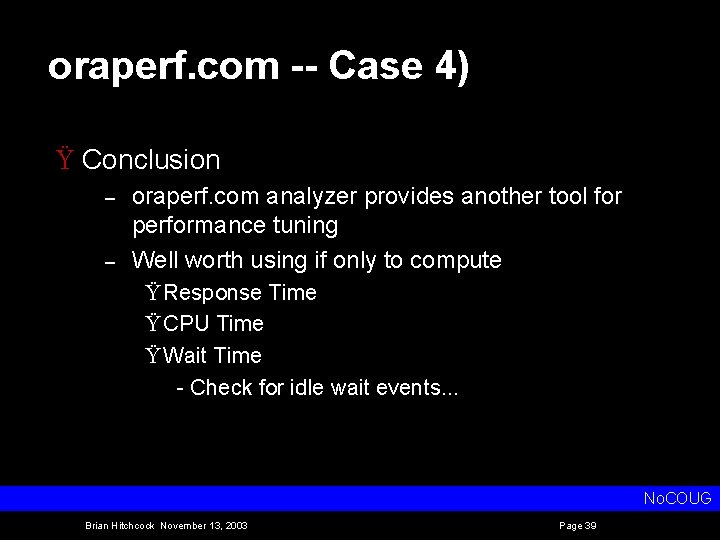
oraperf. com -- Case 4) Ÿ Conclusion – – oraperf. com analyzer provides another tool for performance tuning Well worth using if only to compute Ÿ Response Time Ÿ CPU Time Ÿ Wait Time Check for idle wait events. . . No. COUG Brian Hitchcock November 13, 2003 Page 39

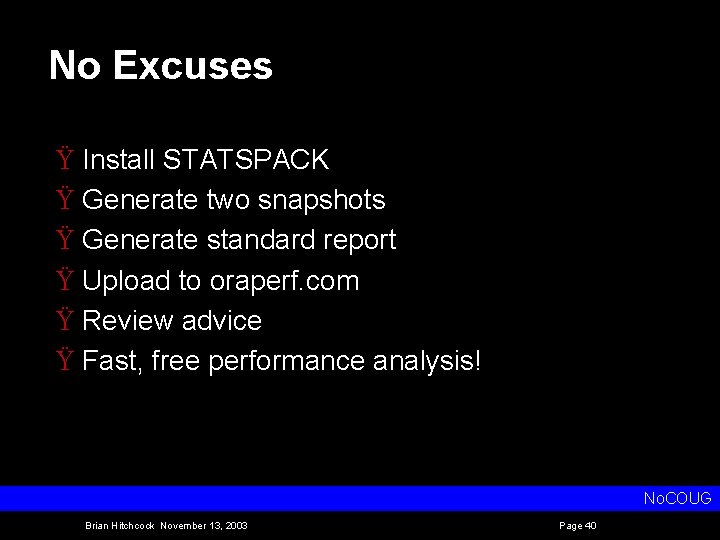
No Excuses Ÿ Install STATSPACK Ÿ Generate two snapshots Ÿ Generate standard report Ÿ Upload to oraperf. com Ÿ Review advice Ÿ Fast, free performance analysis! No. COUG Brian Hitchcock November 13, 2003 Page 40

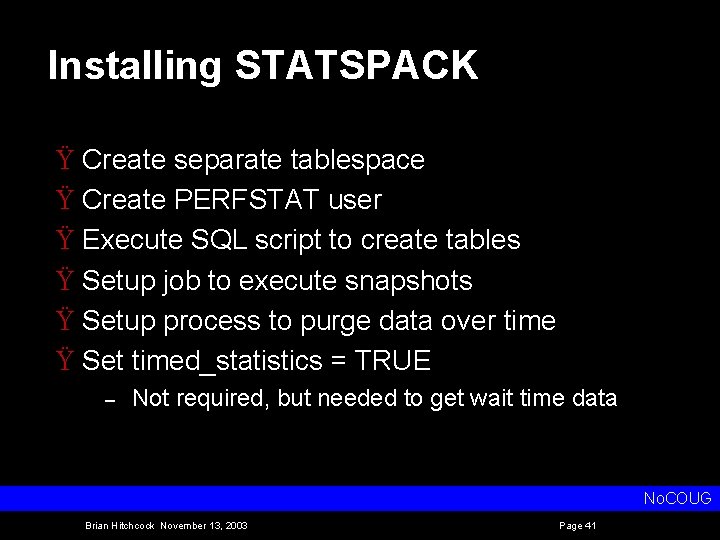
Installing STATSPACK Ÿ Create separate tablespace Ÿ Create PERFSTAT user Ÿ Execute SQL script to create tables Ÿ Setup job to execute snapshots Ÿ Setup process to purge data over time Ÿ Set timed_statistics = TRUE – Not required, but needed to get wait time data No. COUG Brian Hitchcock November 13, 2003 Page 41

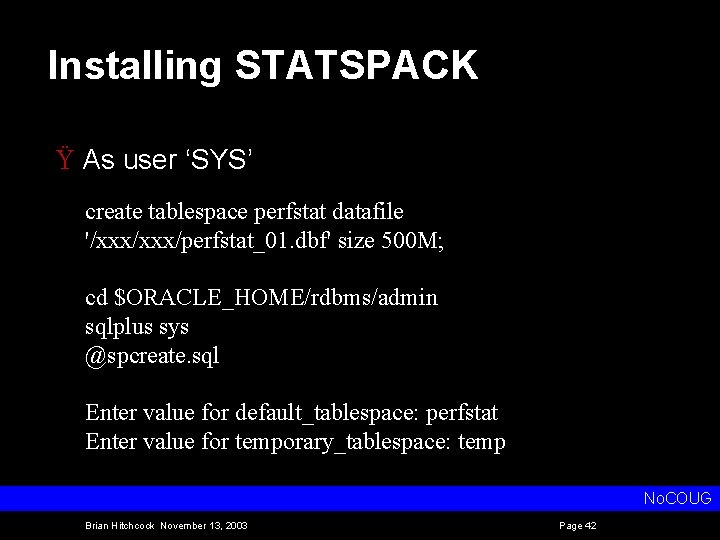
Installing STATSPACK Ÿ As user ‘SYS’ create tablespace perfstat datafile '/xxx/perfstat_01. dbf' size 500 M; cd $ORACLE_HOME/rdbms/admin sqlplus sys @spcreate. sql Enter value for default_tablespace: perfstat Enter value for temporary_tablespace: temp No. COUG Brian Hitchcock November 13, 2003 Page 42

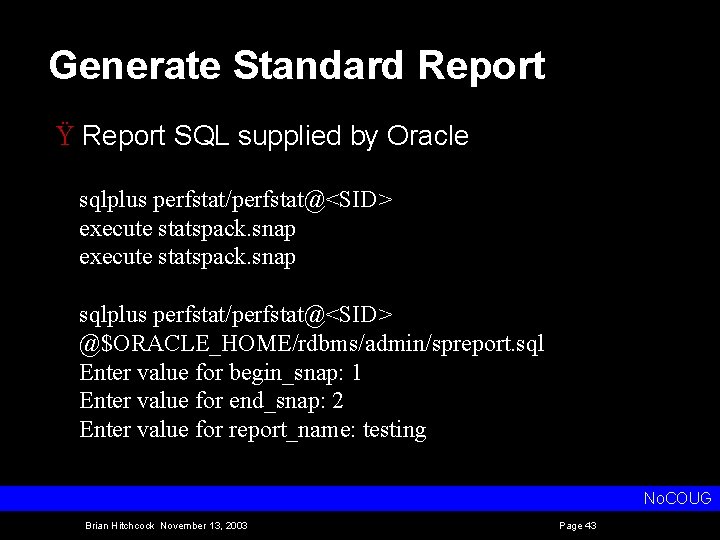
Generate Standard Report Ÿ Report SQL supplied by Oracle sqlplus perfstat/perfstat@<SID> execute statspack. snap sqlplus perfstat/perfstat@<SID> @$ORACLE_HOME/rdbms/admin/spreport. sql Enter value for begin_snap: 1 Enter value for end_snap: 2 Enter value for report_name: testing No. COUG Brian Hitchcock November 13, 2003 Page 43

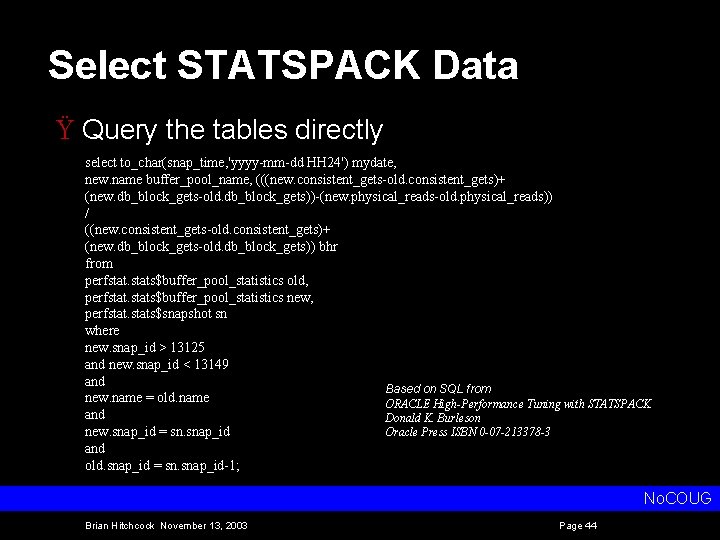
Select STATSPACK Data Ÿ Query the tables directly select to_char(snap_time, 'yyyy-mm-dd HH 24') mydate, new. name buffer_pool_name, (((new. consistent_gets-old. consistent_gets)+ (new. db_block_gets-old. db_block_gets))-(new. physical_reads-old. physical_reads)) / ((new. consistent_gets-old. consistent_gets)+ (new. db_block_gets-old. db_block_gets)) bhr from perfstats$buffer_pool_statistics old, perfstats$buffer_pool_statistics new, perfstats$snapshot sn where new. snap_id > 13125 and new. snap_id < 13149 and Based on SQL from new. name = old. name ORACLE High-Performance Tuning with STATSPACK and Donald K. Burleson new. snap_id = sn. snap_id Oracle Press ISBN 0 -07 -213378 -3 and old. snap_id = sn. snap_id-1; No. COUG Brian Hitchcock November 13, 2003 Page 44

Buffer Cache Hit Ratio Case 4) Ÿ Output of SQL on previous slide yr. mo dy Hr BUFFER_POOL_NAME --------------------2002 -09 -17 02 DEFAULT 1. 00 2002 -09 -17 02 DEFAULT. 94 2002 -09 -17 02 DEFAULT. 87 2002 -09 -17 03 DEFAULT. 90 2002 -09 -17 03 DEFAULT. 93 2002 -09 -17 03 DEFAULT. 97 2002 -09 -17 03 DEFAULT. 82 2002 -09 -17 04 DEFAULT. 78 2002 -09 -17 04 DEFAULT. 76 2002 -09 -17 04 DEFAULT. 80 2002 -09 -17 05 DEFAULT. 69 2002 -09 -17 05 DEFAULT. 73 2002 -09 -17 05 DEFAULT. 76 2002 -09 -17 05 DEFAULT. 69 2002 -09 -17 06 DEFAULT. 81 2002 -09 -17 06 DEFAULT 1. 00 2002 -09 -17 07 DEFAULT 1. 00 BHR No. COUG Brian Hitchcock November 13, 2003 Page 45

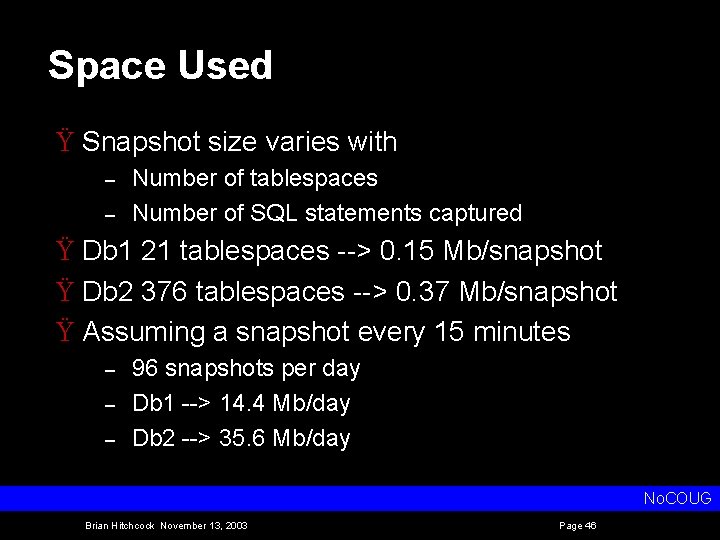
Space Used Ÿ Snapshot size varies with – – Number of tablespaces Number of SQL statements captured Ÿ Db 1 21 tablespaces > 0. 15 Mb/snapshot Ÿ Db 2 376 tablespaces > 0. 37 Mb/snapshot Ÿ Assuming a snapshot every 15 minutes – – – 96 snapshots per day Db 1 > 14. 4 Mb/day Db 2 > 35. 6 Mb/day No. COUG Brian Hitchcock November 13, 2003 Page 46

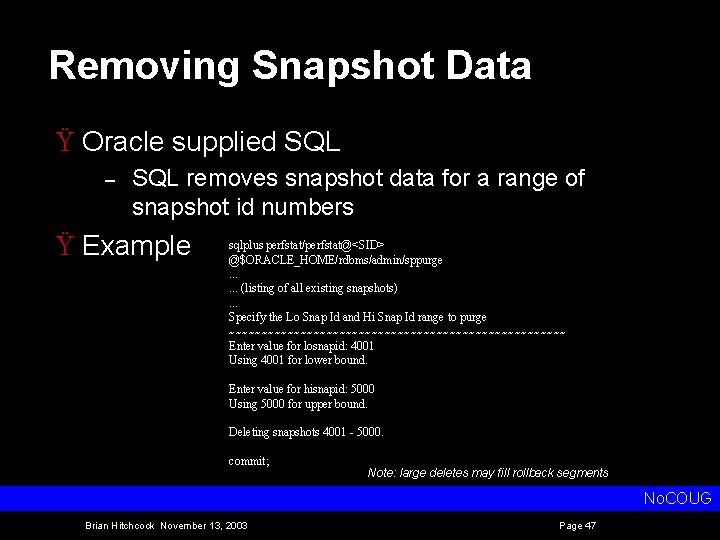
Removing Snapshot Data Ÿ Oracle supplied SQL – SQL removes snapshot data for a range of snapshot id numbers Ÿ Example sqlplus perfstat/perfstat@<SID> @$ORACLE_HOME/rdbms/admin/sppurge. . . (listing of all existing snapshots). . . Specify the Lo Snap Id and Hi Snap Id range to purge ~~~~~~~~~~~~~~~~~~~~~~~~~~ Enter value for losnapid: 4001 Using 4001 for lower bound. Enter value for hisnapid: 5000 Using 5000 for upper bound. Deleting snapshots 4001 - 5000. commit; Note: large deletes may fill rollback segments No. COUG Brian Hitchcock November 13, 2003 Page 47

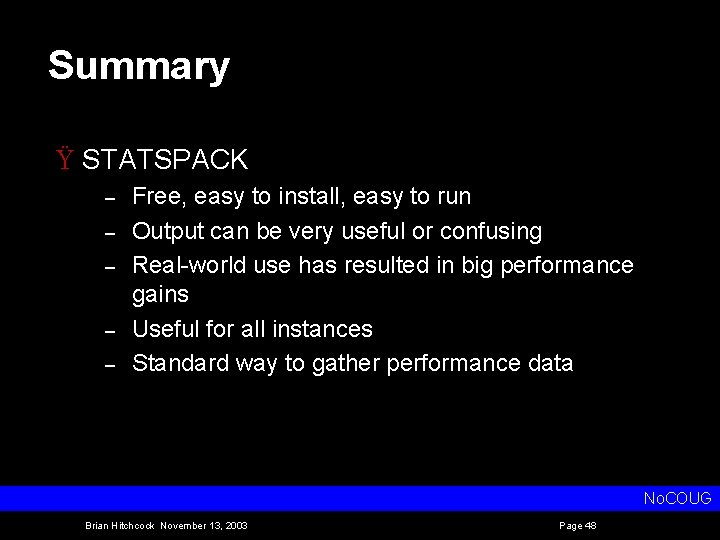
Summary Ÿ STATSPACK – – – Free, easy to install, easy to run Output can be very useful or confusing Real world use has resulted in big performance gains Useful for all instances Standard way to gather performance data No. COUG Brian Hitchcock November 13, 2003 Page 48