Dashboard 1 Data Visualisation Forecasting Adventure Hardware Group
 is a global manufacturing")
Dashboard 1 Data Visualisation & Forecasting Adventure Hardware Group (AHG) is a global manufacturing organisation with operations in America, Europe and Asia. AHG has been experiencing a shift in the market place towards digital as well as change in customer demographic, possibly leading to decline in its store sales. To make the strategic shift toward a greater digital share of wallet and overall growth, AHG has engaged Kernel Decision Science Limited to help it find a solution to this problem. Among its requirements, AHG need Kernel to develop a Business Intelligence and Insight Visualisation capability to better understand monitor key trends over time. The goal is to create commercial action plan as well as an integrated data visualisation and a dynamic analytics system using traditional software tools. The system must auto-fresh whenever new data sources are ingested into the system; use Excel, Tableau, Qlik. View, Business Objects or similar as your data visualisation software. Your final solution must help senior stakeholders, users achieve the following; a. Frame a solution structure for the problem and come up with a robust methodology for separating and dealing with the problems components. b. Carry out problem domain evaluation through extensive data discovery, highlighting where the areas of focus must be and propose action steps and gain buy-in from your analytics lead in Kernel Limited as well as leadership teams in Tele. Net. You will argue your case an agree next steps in your conference call before you begin project in full. Your Solution Plan MUST include the following; 1. Identify areas where AHG could improve existing processes (i. e, where costs are too high, pricing is inadequate, inefficient supply chain processes, inadequate discounting policy (check industry average or method against % of discount across most products), inefficient supplier management, poor quality operations) and reduce cost and must track change over time across regions. 2. Create a 5 year forecast of quarterly sales for each region. Are sales growing as fast as the market or not? Either way, using evidence from the data only, what can AHG do to continue to improve its position in the market (Which market are we referring to here)? DS – USE PYTHON, IA USE – SAS ENTERPRISE GUIDE 3. Identify which products and regions are doing better or worse against the market, benchmarked against manufacturers of similar products e. g. Halfords and similar, as well as online hardware retailers in similar space as AHG. (Present this part in 15 -20 page deck). Is there readily available information out there. 4. If products where to be shelved in the stores, or advertised online, what products may be shelved together given that these products are historically purchased together. Association analysis? DS – USE PYTHON, IA USE – SAS MINER 5. What should AHG Digital strategy be? Should it close its stores(it doesn’t have a store, only resellers, which resellers have low impact- can we move end terms with them? ) and migrate fully online across all regions, some regions(some resellers based on regions)? If some, which regions should be migrated fully online, and what is the likely impact of this aggressive strategy (cost benefit analysis – volume and revenue)? KPIs to consider: Sales Volume, Returns/Cancellation, Costs, Discount Rates, Revenue Per Sale, Profit per Sale, Market Penetration Rate, Attachment Rate, Items Per Transaction, Revenue Per Transaction, Average Transaction Value, Cost Per Sale, Revenue Per 1 Customer, Cost Per Customer, Transaction per Customer.

Approach – Thinking inside and outside the box Others Place. Location/region Product, categories, subcategorie s Promotion Price and reason Decline in sales & Sales Performance Loyalty Logistics Sales Channel Time to Manufacture Quality & Manufacturing Purchase Patterns Historical transactions

Gather data analytic requirements from across the organisations including Sales, product and channel performance analysis, Customer Insight, Market basket analysis, Forecasting, Campaign Analysis and predicting customer behaviours Make proposals on analytical approaches and tools to use to deliver on the task and agree project deliverables and timelines. Delivery phase Communicating and querying various data sources including databases, Enterprise data warehouses, Customer relationship management(CR M) systems and Enterprise resource planning (ERP) system • Consolidating the extracted datasets into a single robust dataset • Carrying out exploratory analysis on the data including reviewing the metadata, identifying missing values, anomalies, extreme values and distribution of the variables. • Merging Data • Manipulating the data including data cleansing, checking format of the variables, deriving new variables and filtering data. • Sub-setting Data • Dealing with Missing Data and anomalies • Data Cleansing and purging • Summarising Data • Basic Segmentation • Forecasting • Correlations • Indexing • Measures of Central Tendencies • Deriving new variables • Using advanced functions etc • MIR • Dashboard development • KPI generation • Cubes Analysing/Model ling the data and creating bespoke outputs using advanced visualisation Generating insights and making actionable recommendatio ns based on findings. • Present findings to stakeholders using Power. Point, charts, pictures, tables and graph • Tracking the impact of my recommendat ion post implementatio n.
 is a global manufacturing organisation with operations in America, Europe")
Adventure Hardware Group (AHG) is a global manufacturing organisation with operations in America, Europe and Asia. AHG has been experiencing a shift in the market place towards digital as well as change in customer demographic, possibly leading to decline in its store sales. a. Shift in the market place towards digital – Is this true? Can we prove it with the data? a. b. c. Go to market channels – Reseller (aka Retailer, stores) & Online (Digital - AHG’s online website). We need to compare sales (revenue, profit, volume of transactions and items sold(order quantities) over time. Use Month- Year (in excel formula = text(Datefield, ”yyyy-mm” (2005 -07) Where do we find this data? Adventureworks Database – Please read the data dictionary before embarking on the project. a. b. d. [Sales]. [Sales. Order. Detail] (All the transactional information) [Sales]. [Sales. Order. Header] (Additional transaction information - [Online. Order. Flag] field 1 = Online Sales and 0 = Reseller Sales. If there has been a shift, can you find out what is driving the shift? By Regions, Product Categories or Subcategories. b. Change in customer demography (Use Online customer data only because we don’t have demographic details of reseller) - Is this true? Can we prove it with the data? a. If you link your Sales]. [Sales. Order. Detail] (All the transaction information) b. [Sales]. [Sales. Order. Header] (Additional transaction information - [Online. Order. Flag] field 1 = Online Sales and 0 = Reseller Sales. c. [Adventure. Works. DW 2012] - [dbo]. [Dim. Customer], you can join this table to. Sales]. [Sales. Order. Header] using [Customer. Key] and [Customer. ID]. Note – we don’t have customer demography data for the reseller channel. TIP SELECT A. [Customer. ID] , A. Online. Order. Flag , A. [Order. Date] , B. * FROM [Sales]. [Sales. Order. Header] AS A LEFT JOIN [Adventure. Works. DW 2012]. [dbo]. [Dim. Customer] AS B ON A. Customer. ID = B. [Customer. Key]

c. Possibly leading to decline in its store sales. - Is this true? Can we prove it with the data? a. Is there a decline in store sales? Is the business making profit? Are we selling below cost price or list price - Investigate over time to identify if there has been decline in sales? d. AHG need Kernel to develop a Business Intelligence and Insight Visualisation capability to better understand monitor key trends over time. The goal is to create commercial action plan as well as an integrated data visualisation and a dynamic analytics system using traditional software tools. The system must auto-fresh whenever new data sources are ingested into the system; use Excel, Tableau, Qlik. View, Business Objects or similar as your data visualisation software. – • a. Create a Dashboard that can show : Sales Volume, Costs, Revenue, Average Transaction Value, Cost Per Sale, Revenue Per Customer, Average Transaction per Customer by Region, Product Categories, Subcategories, Products, Channels, e. Identify areas where AHG could improve existing processes (i. e, where costs are too high, pricing is inadequate, inefficient supply chain processes, inadequate discounting policy (check industry average or method against % of discount across most products), inefficient supplier management, poor quality operations) and reduce cost and must track change over time across regions. • a. where costs are too high, pricing is inadequate – Are we selling below cost price or List price or unit price? Investigate this by channel, region and products, • B. inefficient supply chain processes, inefficient supplier management – Are we getting the materials needed for the products on time, what is our average time to deliver products, What is the average time to manufacture? • inadequate discounting policy – Investigate discounts and see how it affects our sales, the products being sold below cost/list price, are they heavily discounted? • poor quality operations – How many of our products are being returned or scrapped? Operations not sales Identify which products and regions are doing better or worse against the market, benchmarked against manufacturers of similar products e. g. Halfords and similar, as well as online hardware retailers in similar space as AHG. (Present this part in 15 -20 page deck). Is there readily available information out a. On an average, compare AHG UK vs Halfords on product prices, Total Revenue, Profits etc

h. If products where to be shelved in the stores, or advertised online, what products may be shelved together given that these products are historically purchased together. • i. • a. Association Analysis or Market Basket Analysis – Use What should AHG Digital strategy be? Should it close its stores(it doesn’t have a store, only resellers, which resellers have low impact- can we move end terms with them? ) and migrate fully online across all regions, some regions(some resellers based on regions)? If some, which regions should be migrated fully online, and what is the likely impact of this aggressive strategy (cost benefit analysis – volume and revenue)? a. Your recommendation must make commercial sense, what is the likely revenue and profit impact over time for AHG if the we discontinue the reseller channels sales?

f. Create a 5 year forecast of quarterly sales for each region. Are sales growing as fast as the market or not? Either way, using evidence from the data only, what can AHG do to continue to improve its position in the market (Which market are we referring to here)? a. Use your preferred software to create a forecast e. g excel, tableau, SAS, python etc Approach • Five year forecast – Why do we do a forecast? • Quarterly • Sales (revenue) • Region • Channel Data Requirement (fields) Data required/Action Data Source/Table Quarterly (Time ID) Summarised or Aggregated Total Quarterly Sales of products Adventureworks Database – Salesorderdetail & Salesorderheader – Orderdate(year, day, month, quarter can be generated from orderdate) Sales(Revenue) Total Sales of products per Quarter Adventureworks Database – Salesorderdetail – Unitprice * orderquantity Regional Data Adventureworks Database – [Sales]. [Sales. Territory] & [Sales]. [Sales. Order. Header] – Territory Name Channel Adventureworks Database – [Sales]. [Sales. Order. Header] – [Online. Order. Flag] (1 = Onlinesales and 0 = Reseller Sales)
 • • Promoted products gained")
Examples of how to write Insights/commentaries (Just a guidance) • • Promoted products gained 178% within those two weeks; the category rose by 23% Brought 21% incremental shopper base to the water brand 50. 4% of brand sales came from these new customers who did not buy the brand in the previous three months These measures all increased for brand / category: Basket penetration +105% / +21% Units/visit +50% / +7% Sales units +219% / +35% • Reach: Content and conversations about the brand reached more than 1. 25 million customers • Engagement: Over 11, 000 conversations and pieces of content generated • Brand opinion: 30% increase in opinion of the Frizz Ease brand • Recommendations: +88 increase in likelihood to recommend (Net Promoter Score) • Sales impact: £ 2. 29 sales-to-cost ratio on products featured in mailer Sales growth: Overall total beer sales grew 8. 5%, and 11. 2% year over year Customers increased 5. 6% Focus on premium ale: Customers are buying more upmarket ales, buying 34% more year over year New products rule: Outperformed the delisted lines Increased loyalty: Research indicates loyalty has grown by 1. 4%, and loyal customers are spending 11. 2% more year over year • The sales to cost ratio was 15: 1 • 70% of the generated uplift was on products not advertised via text messages • Sales increased by 62%, driven by customers buying more units per visit • New customers were also attained through the program (penetration +4%) • The promotion also stimulated customer interest in more items — 44% of customers had not bought any of the promoted items in the previous 12 weeks • Following a review of oral care sales and customer behavior, it was determined that: • About 20% of customers have more than one toothpaste in their basket • Whitening toothpaste is the largest toothpaste segment at the grocer • Toothbrushes are the most common product purchased with toothpaste 8
 Data Analyst")
Project Presentation Assessment Criterion (Your project would be scored based on these) Data Analyst Customer Insight Data Science Business question understanding 1 -10 Solution approach – Does it tell a story? 1 -10 Creativity 1 -10 Choice of tools & data analytics methodology 1 -10 Errors and accuracy of analysis, stats etc. 1 -10 Ability to aggregate and summarise data 1 -10 Usage of Appropriate visualisation 1 -10 Quality of Insights 1 -10 Quality of Presentation – Design, text, clip charts, pictures etc 1 -10 Confidence 1 -10 Communication 1 -10 Attention to detail 1 -10 Statistical parameters understanding and application 1 -10 Choice of Variables 1 -10 Choice of Models 1 -10 Model interpretation and cost benefit analysis 1 -10 Understanding of Big Data Platforms and tools 1 -10 Understanding of Data Structures and Migration 1 -10 Recommendations 1 -10

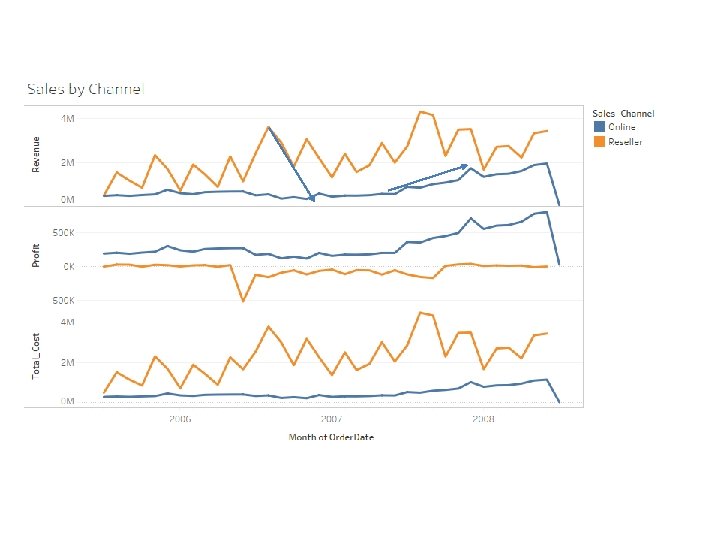
Shift in the market place towards digital – Is this true? Can we prove it with the data? • Shift – time variable (Order date – Sales. Order. Header). A snap shot in time. • Sales – Product Cost (Production. product) – Revenue (Derived FROM Unitprice * Orderquantity or use line total in Sales. Order. Detail) – Profit (Derived from Revenue - Product cost) – Number of transactions ( Count of unique salesorder. ID – Sales order header has unique salesorderid) – Item sold (Total Order quantity - Sales. Order. Detail) – Product (Name, Category, Subcategory) – Location (Sales territory) • Sales Channel – (Sales. Orderheader) – Digital – Online sales – Reseller – Store sales

Bikes – performance – Revenue, Profit, Items, regions, channels and subcategories

Online Sales have increased by 250% between June 2017 and July 2018 Revenue by Sales Channel 4500000 4000000 3500000 3000000 2500000 1949361. 10999997 2000000 1500000 1000000 554799. 2281 500000 0 1 2 3 4 5 6 7 8 9 10 11 12 13 14 15 16 17 18 19 20 21 22 23 24 25 26 27 28 29 30 31 32 33 34 35 36 37 0 1

Bikes Sales have grown by 20% in the last quarter 1200 1000 450 325 300 500 450 300 220 25% 14% 1 2 3 120 4 35% 26% 5 6 7 8 9 10
- Slides: 14