Corporate Valuation Keith M Howe Scholl Professor of

- Slides: 37
Corporate Valuation Keith M. Howe Scholl Professor of Finance De. Paul University Summer 2009
Valuation Approaches I. Discounted cash flow (DCF) analysis II. Relative valuation analysis § § § comparable companies analysis equity valuation using P/E multiples enterprise valuation using EBITDA multiples
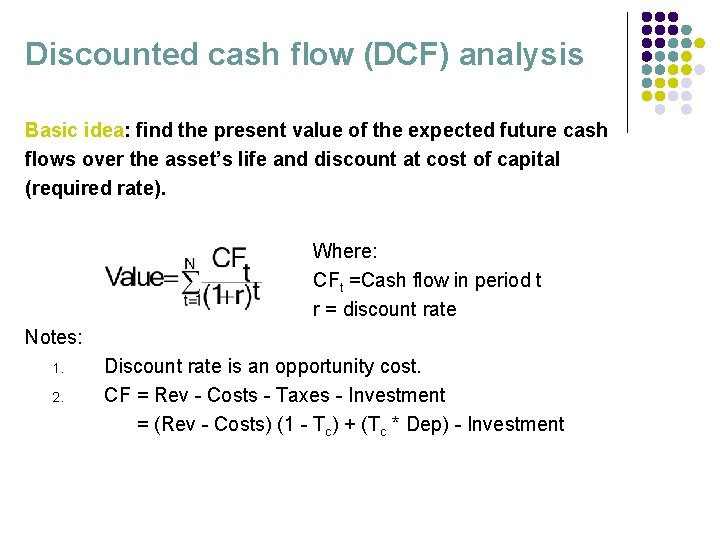
Discounted cash flow (DCF) analysis Basic idea: find the present value of the expected future cash flows over the asset’s life and discount at cost of capital (required rate). Where: CFt =Cash flow in period t r = discount rate Notes: 1. 2. Discount rate is an opportunity cost. CF = Rev - Costs - Taxes - Investment = (Rev - Costs) (1 - Tc) + (Tc * Dep) - Investment
Discounted cash flow (DCF) analysis A DCF model has three parts: l Explicit forecast period l Cash flows are after-tax incremental cash flows l Continuing value or terminal period l Perpetuity l FCF, NOPLAT, NOPAT l Constant growth l Multiples l Discount rates can be determined a number of different ways (e. g. , CAPM, Gordon growth model, APT, etc), but the expected free cash flows are discounted at the rate that reflects the risk of the cash flows. 4
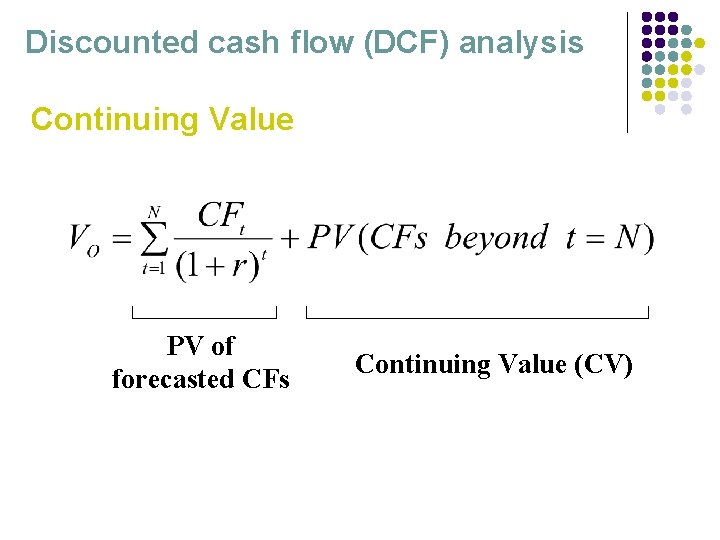
Discounted cash flow (DCF) analysis Continuing Value PV of forecasted CFs Continuing Value (CV)
Discounted cash flow (DCF) analysis Two general approaches are taken: For the continuing value (or terminal value) component, simplifying assumptions are made about future CFs (e. g. , g=3% in perpetuity) or future valuation alignment based on market multiples. Two general approaches: 1) Constant growth rate of CFs. 2) Market-based multiples
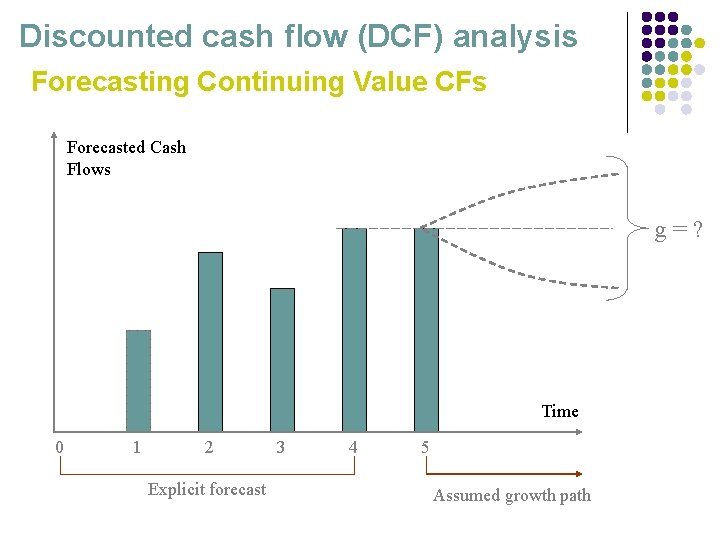
Discounted cash flow (DCF) analysis Forecasting Continuing Value CFs Forecasted Cash Flows g=? Time 0 1 2 Explicit forecast 3 4 5 Assumed growth path
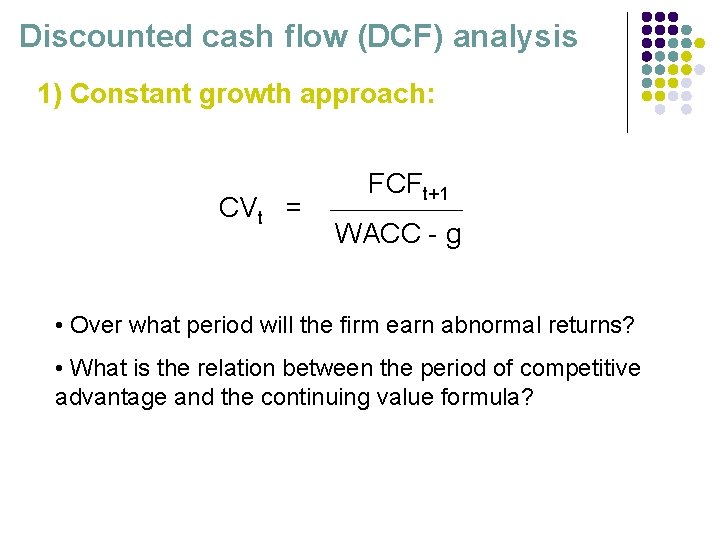
Discounted cash flow (DCF) analysis 1) Constant growth approach: CVt = FCFt+1 WACC - g • Over what period will the firm earn abnormal returns? • What is the relation between the period of competitive advantage and the continuing value formula?
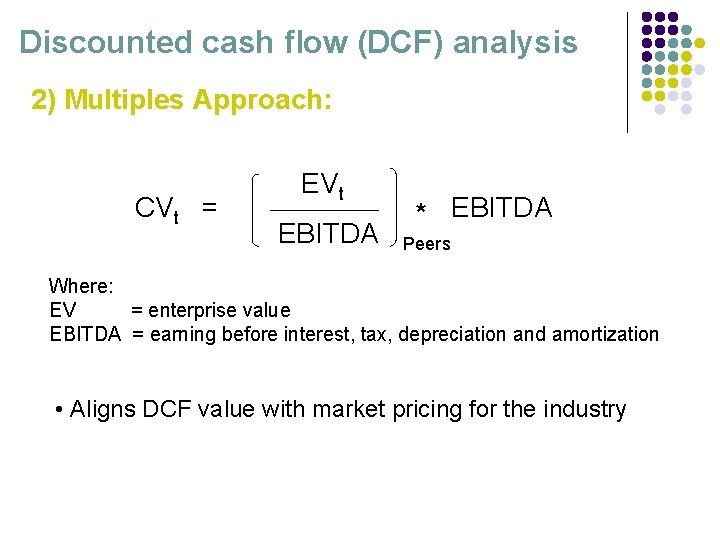
Discounted cash flow (DCF) analysis 2) Multiples Approach: CVt = EVt EBITDA * EBITDA Peers Where: EV = enterprise value EBITDA = earning before interest, tax, depreciation and amortization • Aligns DCF value with market pricing for the industry
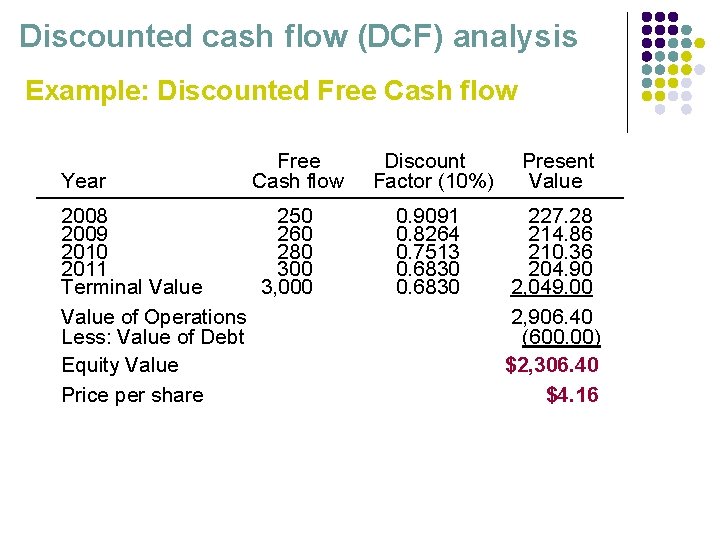
Discounted cash flow (DCF) analysis Example: Discounted Free Cash flow Year Free Cash flow 2008 250 2009 260 2010 280 2011 300 Terminal Value 3, 000 Value of Operations Less: Value of Debt Equity Value Price per share Discount Factor (10%) Present Value 0. 9091 0. 8264 0. 7513 0. 6830 227. 28 214. 86 210. 36 204. 90 2, 049. 00 2, 906. 40 (600. 00) $2, 306. 40 $4. 16
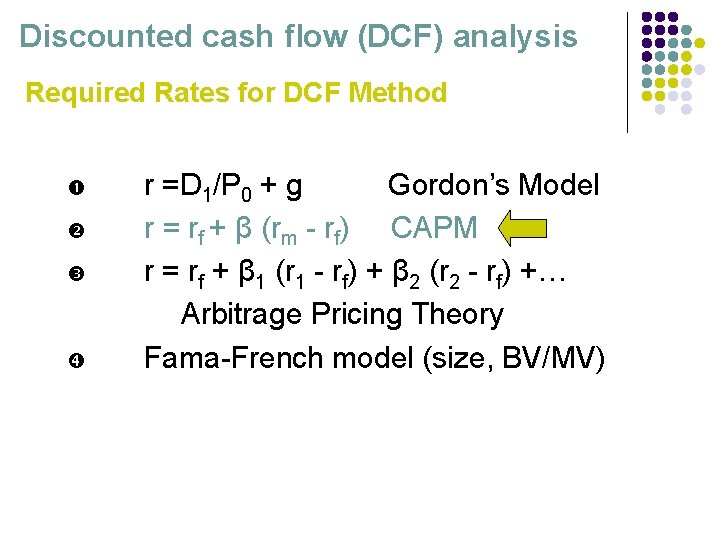
Discounted cash flow (DCF) analysis Required Rates for DCF Method r =D 1/P 0 + g Gordon’s Model r = rf + β (rm - rf) CAPM r = rf + β 1 (r 1 - rf) + β 2 (r 2 - rf) +… Arbitrage Pricing Theory Fama-French model (size, BV/MV)
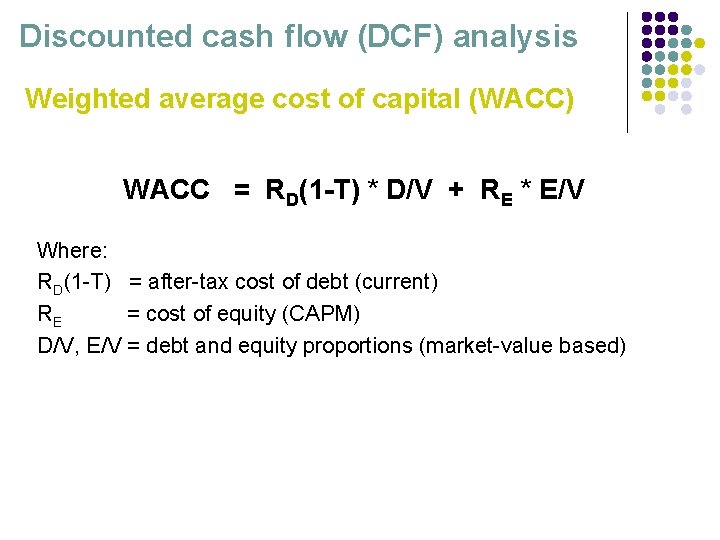
Discounted cash flow (DCF) analysis Weighted average cost of capital (WACC) WACC = RD(1 -T) * D/V + RE * E/V Where: RD(1 -T) = after-tax cost of debt (current) RE = cost of equity (CAPM) D/V, E/V = debt and equity proportions (market-value based)
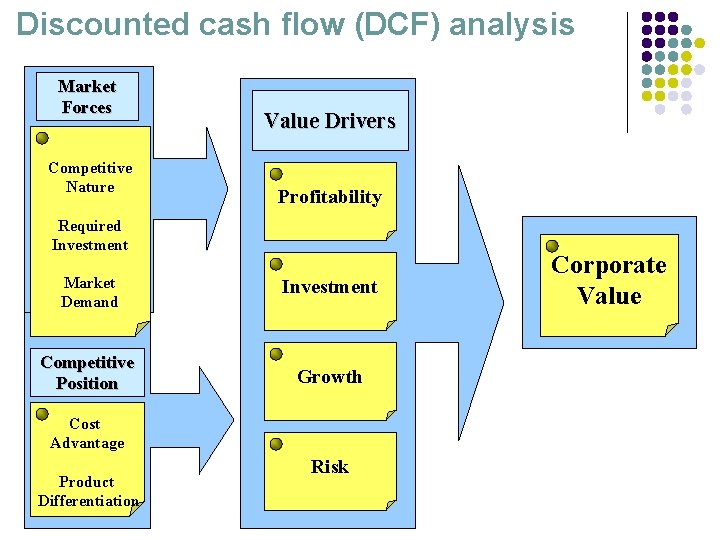
Discounted cash flow (DCF) analysis Market Forces Competitive Nature Value Drivers Profitability Required Investment Market Demand Investment Competitive Position Growth Cost Advantage Product Differentiation Risk Corporate Value
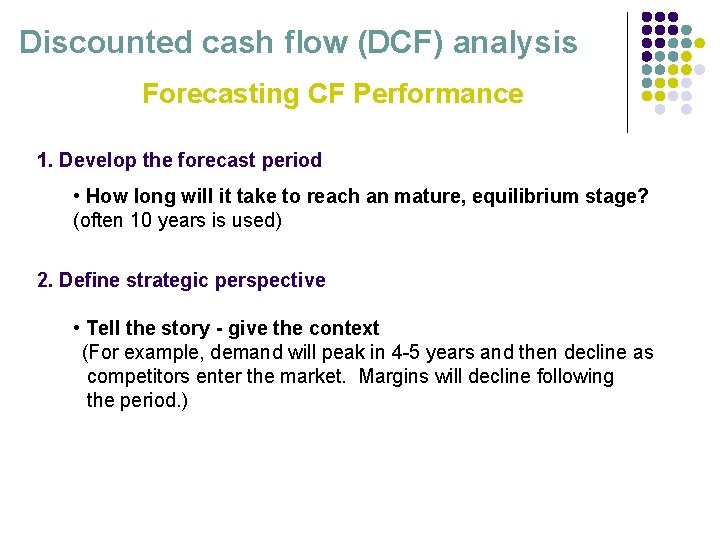
Discounted cash flow (DCF) analysis Forecasting CF Performance 1. Develop the forecast period • How long will it take to reach an mature, equilibrium stage? (often 10 years is used) 2. Define strategic perspective • Tell the story - give the context (For example, demand will peak in 4 -5 years and then decline as competitors enter the market. Margins will decline following the period. )
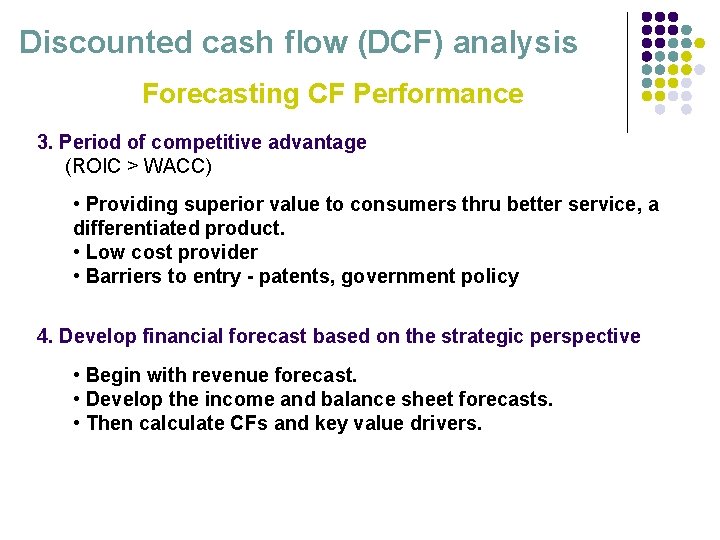
Discounted cash flow (DCF) analysis Forecasting CF Performance 3. Period of competitive advantage (ROIC > WACC) • Providing superior value to consumers thru better service, a differentiated product. • Low cost provider • Barriers to entry - patents, government policy 4. Develop financial forecast based on the strategic perspective • Begin with revenue forecast. • Develop the income and balance sheet forecasts. • Then calculate CFs and key value drivers.
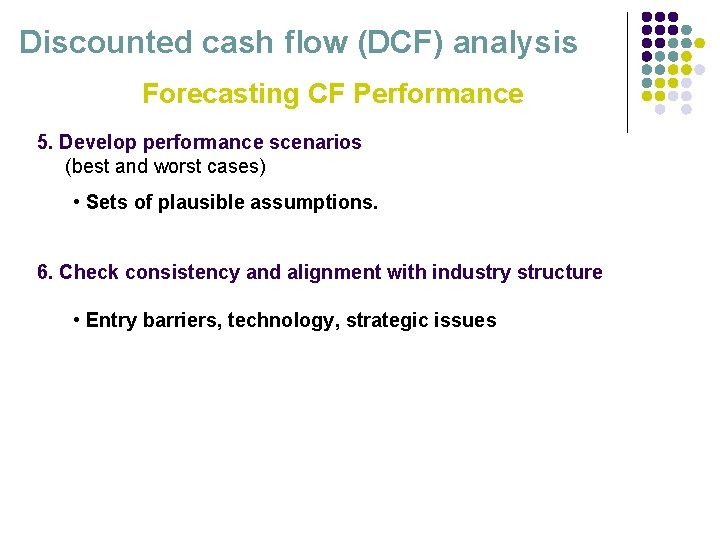
Discounted cash flow (DCF) analysis Forecasting CF Performance 5. Develop performance scenarios (best and worst cases) • Sets of plausible assumptions. 6. Check consistency and alignment with industry structure • Entry barriers, technology, strategic issues
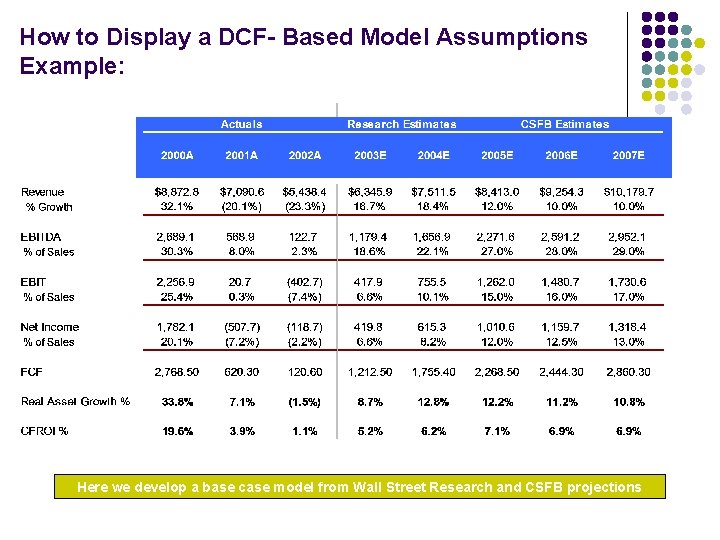
How to Display a DCF- Based Model Assumptions Example: Here we develop a base case model from Wall Street Research and CSFB projections
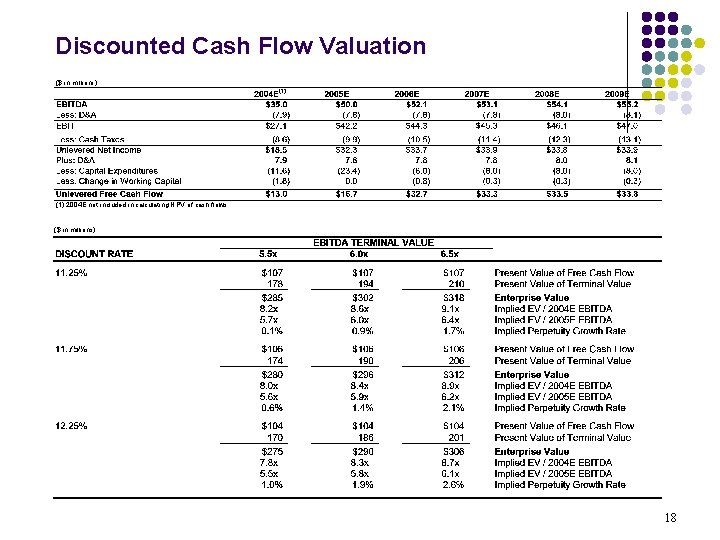
Discounted Cash Flow Valuation ($ in millions) (1) 2004 E not included in calculating NPV of cash flows. ($ in millions) 18
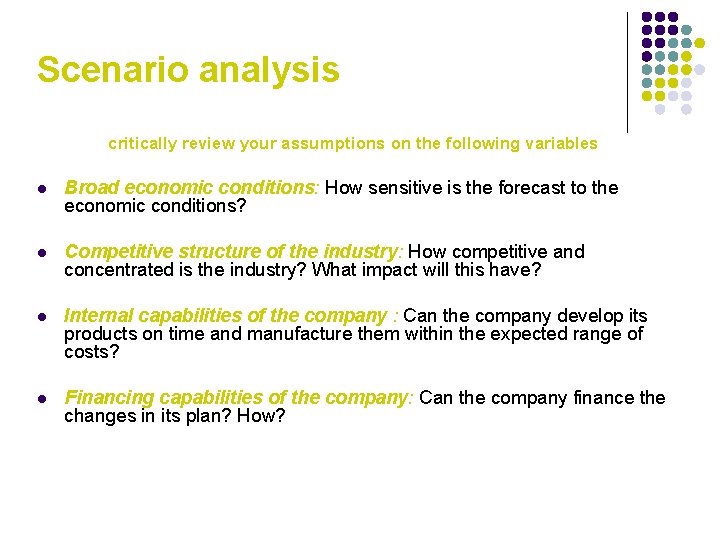
Scenario analysis critically review your assumptions on the following variables l Broad economic conditions: How sensitive is the forecast to the economic conditions? l Competitive structure of the industry: How competitive and concentrated is the industry? What impact will this have? l Internal capabilities of the company : Can the company develop its products on time and manufacture them within the expected range of costs? l Financing capabilities of the company: Can the company finance the changes in its plan? How?
Discounted cash flow (DCF) analysis Pros Widely accepted v Provides a generally reliable and sophisticated approach to valuation by accounting for: § Profitability § Growth § Capital investment/intensity § Capital structure § Risk and opportunity cost Cons v Generally not easy to calculate v Grounded by assumptions v Gives only an absolute valuation, which in isolation is not telling v Loaded with assumptions v 20
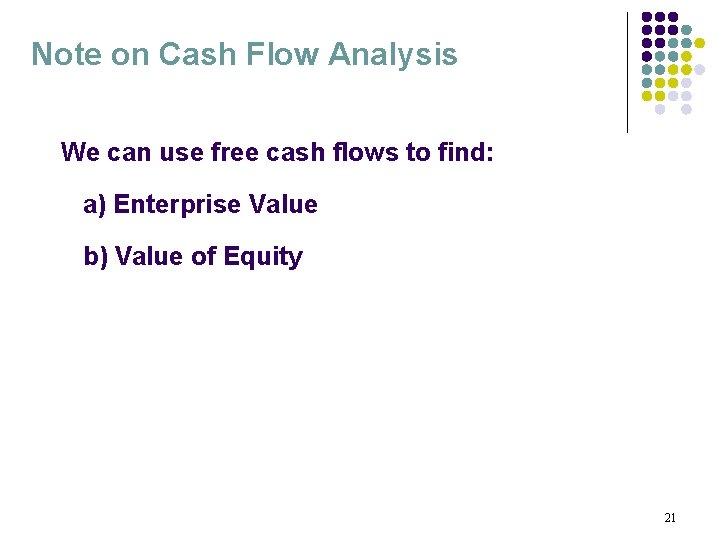
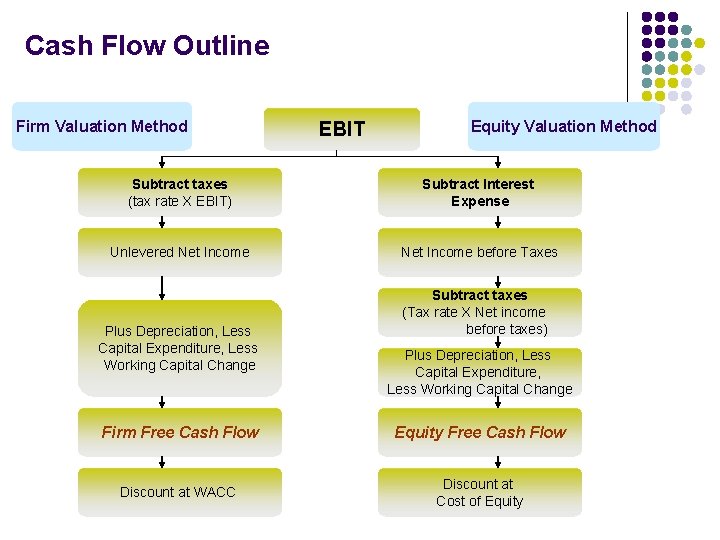
Note on Cash Flow Analysis We can use free cash flows to find: a) Enterprise Value b) Value of Equity 21
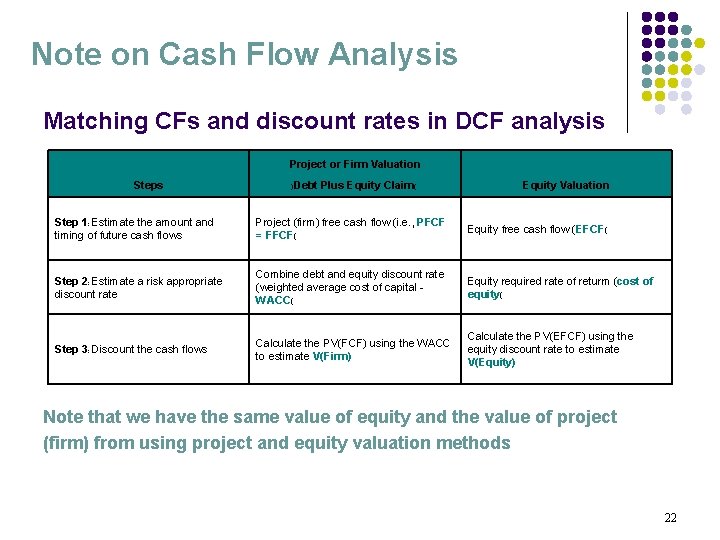
Note on Cash Flow Analysis Matching CFs and discount rates in DCF analysis Project or Firm Valuation Steps )Debt Plus Equity Claim( Equity Valuation Step 1: Estimate the amount and timing of future cash flows Project (firm) free cash flow (i. e. , PFCF = FFCF( Equity free cash flow (EFCF( Step 2: Estimate a risk appropriate discount rate Combine debt and equity discount rate (weighted average cost of capital WACC( Equity required rate of returm (cost of equity( Step 3: Discount the cash flows Calculate the PV(FCF) using the WACC to estimate V(Firm) Calculate the PV(EFCF) using the equity discount rate to estimate V(Equity) Note that we have the same value of equity and the value of project (firm) from using project and equity valuation methods 22
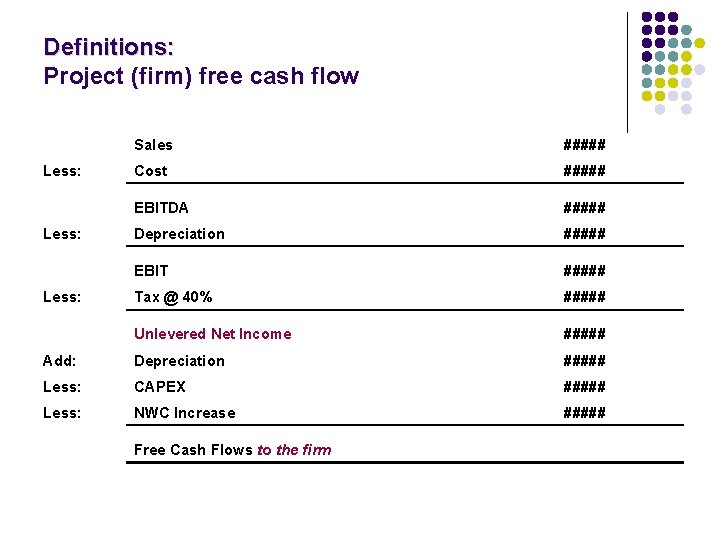
Definitions: Project (firm) free cash flow Sales ##### Cost ##### EBITDA ##### Depreciation ##### EBIT ##### Tax @ 40% ##### Unlevered Net Income ##### Add: Depreciation ##### Less: CAPEX ##### Less: NWC Increase ##### Free Cash Flows to the firm Less:
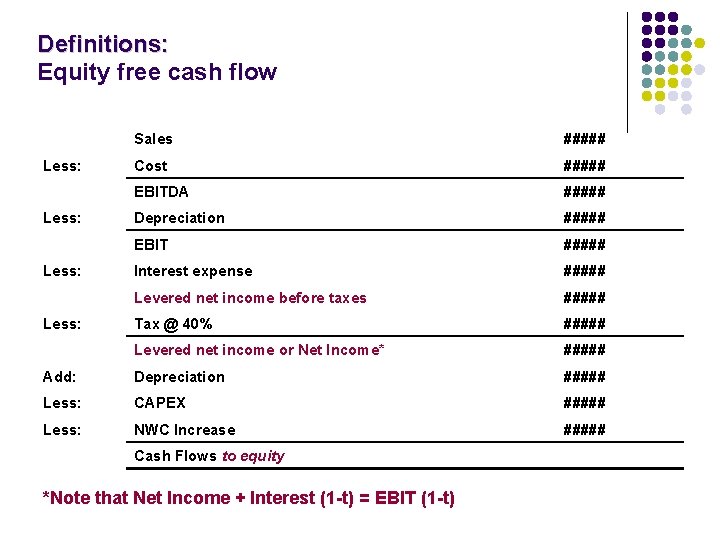
Definitions: Equity free cash flow Sales ##### Cost ##### EBITDA ##### Depreciation ##### EBIT ##### Interest expense ##### Levered net income before taxes ##### Tax @ 40% ##### Levered net income or Net Income* ##### Add: Depreciation ##### Less: CAPEX ##### Less: NWC Increase ##### Cash Flows to equity Less: *Note that Net Income + Interest (1 -t) = EBIT (1 -t)
Cash Flow Outline Firm Valuation Method EBIT Equity Valuation Method Subtract taxes (tax rate X EBIT) Subtract Interest Expense Unlevered Net Income before Taxes Plus Depreciation, Less Capital Expenditure, Less Working Capital Change Subtract taxes (Tax rate X Net income before taxes) Plus Depreciation, Less Capital Expenditure, Less Working Capital Change Firm Free Cash Flow Equity Free Cash Flow Discount at WACC Discount at Cost of Equity
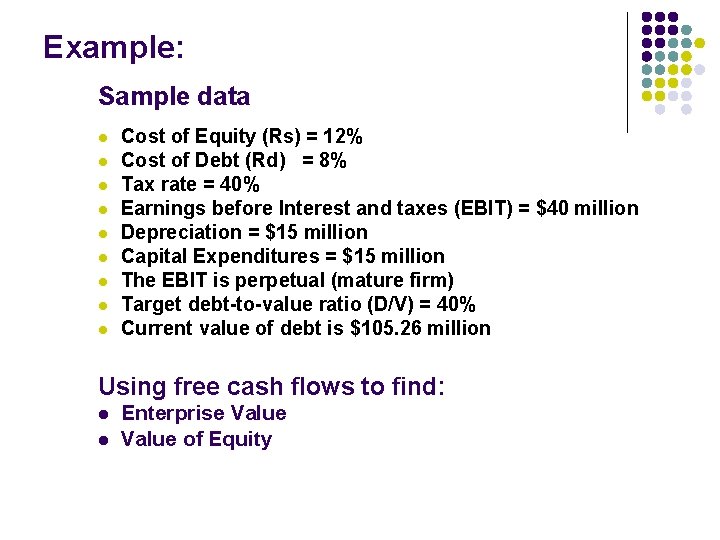
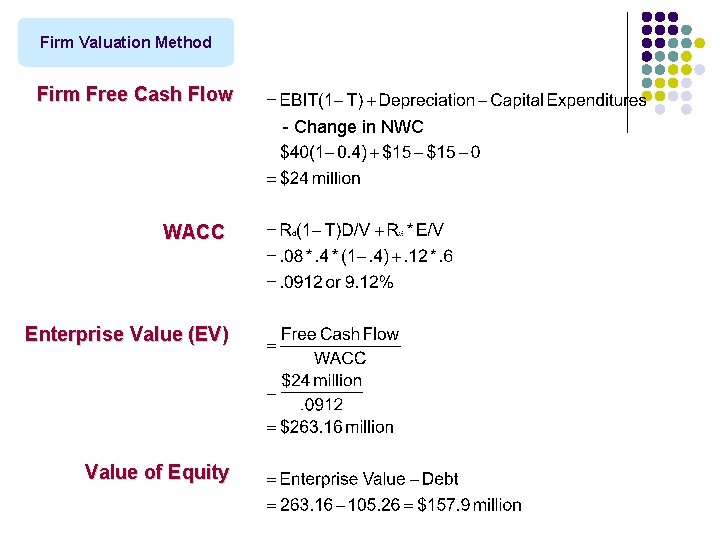
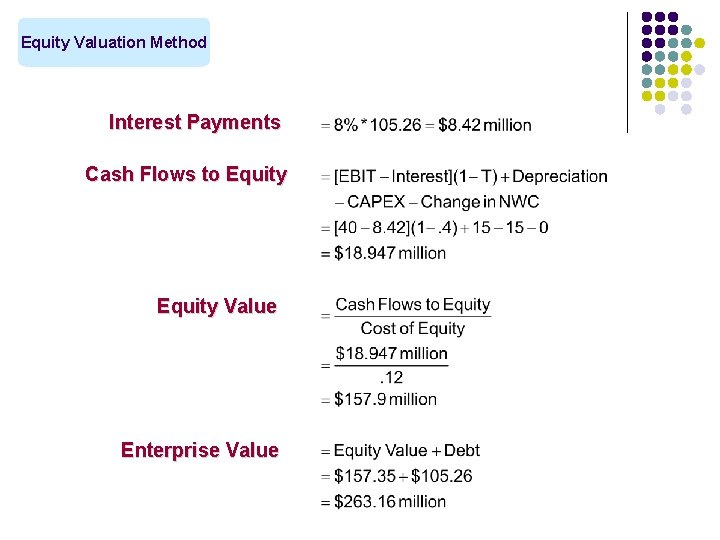
Example: Sample data l l l l l Cost of Equity (Rs) = 12% Cost of Debt (Rd) = 8% Tax rate = 40% Earnings before Interest and taxes (EBIT) = $40 million Depreciation = $15 million Capital Expenditures = $15 million The EBIT is perpetual (mature firm) Target debt-to-value ratio (D/V) = 40% Current value of debt is $105. 26 million Using free cash flows to find: l l Enterprise Value of Equity
Firm Valuation Method Firm Free Cash Flow - Change in NWC WACC Enterprise Value (EV) Value of Equity
Equity Valuation Method Interest Payments Cash Flows to Equity Value Enterprise Value
Relative valuation analysis General thoughts on relative valuations l Most valuations on Wall Street use multiples l Multiples reflect current market perceptions l Relative valuations require fewer explicit assumptions and are easier to use l Relative valuations often find a more receptive audience (easier to understand as there are fewer assumptions) 29
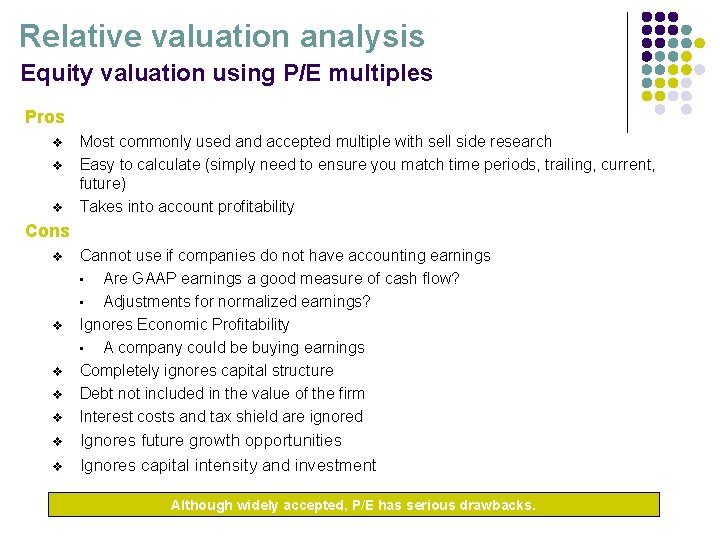
Relative valuation analysis Equity valuation using P/E multiples Pros v v v Most commonly used and accepted multiple with sell side research Easy to calculate (simply need to ensure you match time periods, trailing, current, future) Takes into account profitability Cons v v v v Cannot use if companies do not have accounting earnings • Are GAAP earnings a good measure of cash flow? • Adjustments for normalized earnings? Ignores Economic Profitability • A company could be buying earnings Completely ignores capital structure Debt not included in the value of the firm Interest costs and tax shield are ignored Ignores future growth opportunities Ignores capital intensity and investment Although widely accepted, P/E has serious drawbacks.
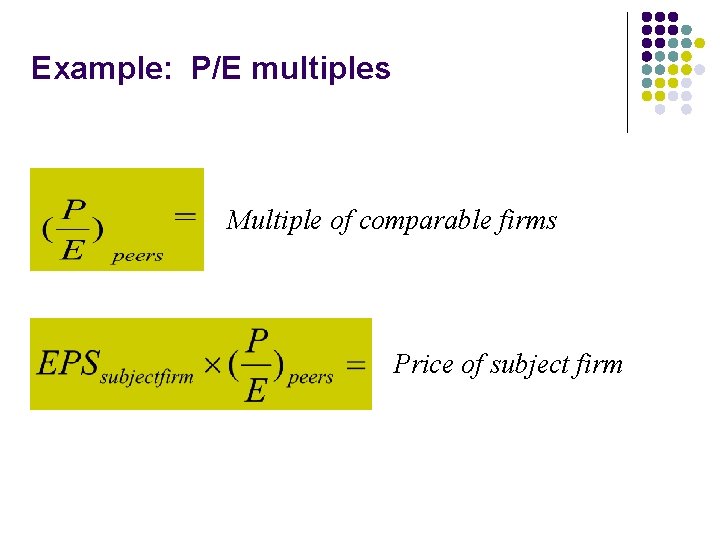
Example: P/E multiples Multiple of comparable firms Price of subject firm
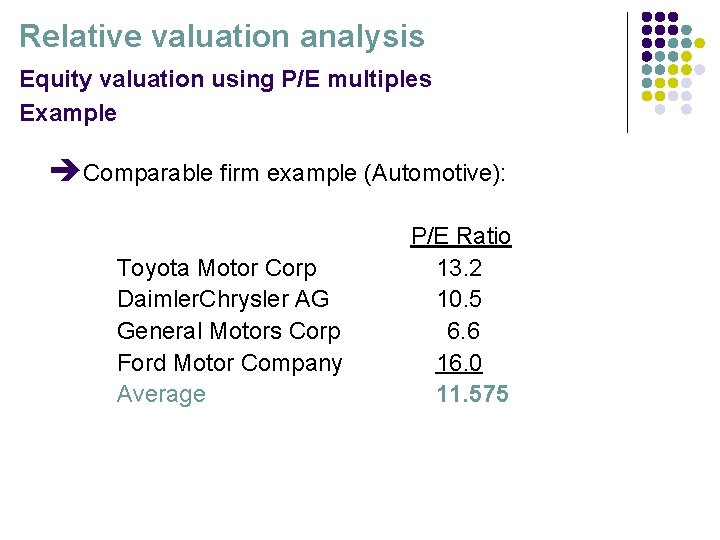
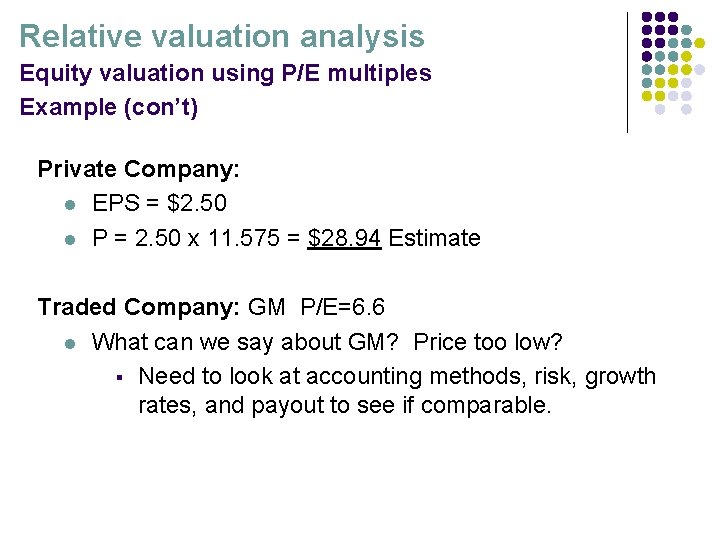
Relative valuation analysis Equity valuation using P/E multiples Example èComparable firm example (Automotive): Toyota Motor Corp Daimler. Chrysler AG General Motors Corp Ford Motor Company Average P/E Ratio 13. 2 10. 5 6. 6 16. 0 11. 575
Relative valuation analysis Equity valuation using P/E multiples Example (con’t) Private Company: l EPS = $2. 50 l P = 2. 50 x 11. 575 = $28. 94 Estimate Traded Company: GM P/E=6. 6 l What can we say about GM? Price too low? § Need to look at accounting methods, risk, growth rates, and payout to see if comparable.
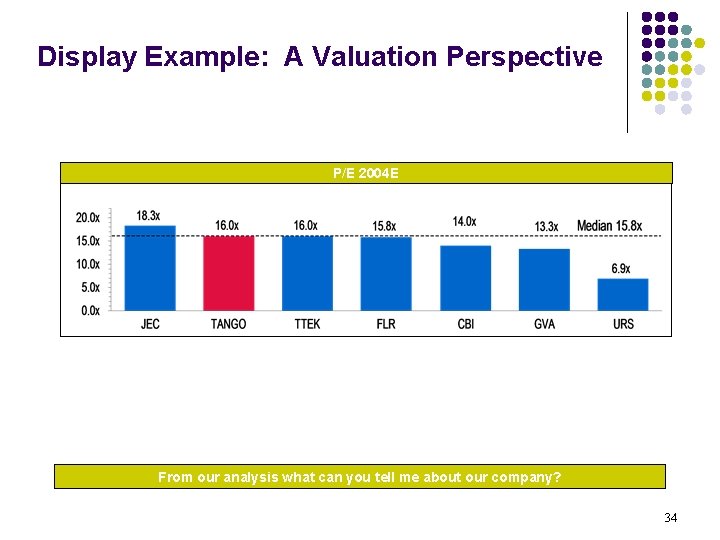
Display Example: A Valuation Perspective P/E 2004 E From our analysis what can you tell me about our company? 34
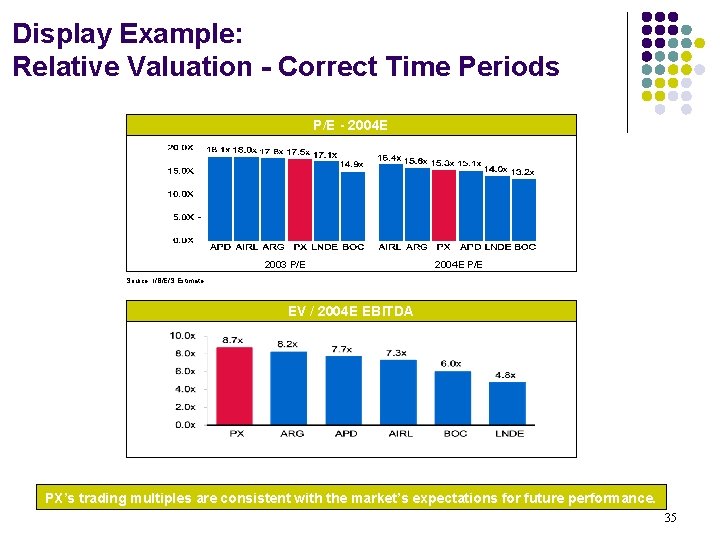
Display Example: Relative Valuation - Correct Time Periods P/E - 2004 E 2003 P/E 2004 E P/E Source: I/B/E/S Estimate. EV / 2004 E EBITDA PX’s trading multiples are consistent with the market’s expectations for future performance. 35
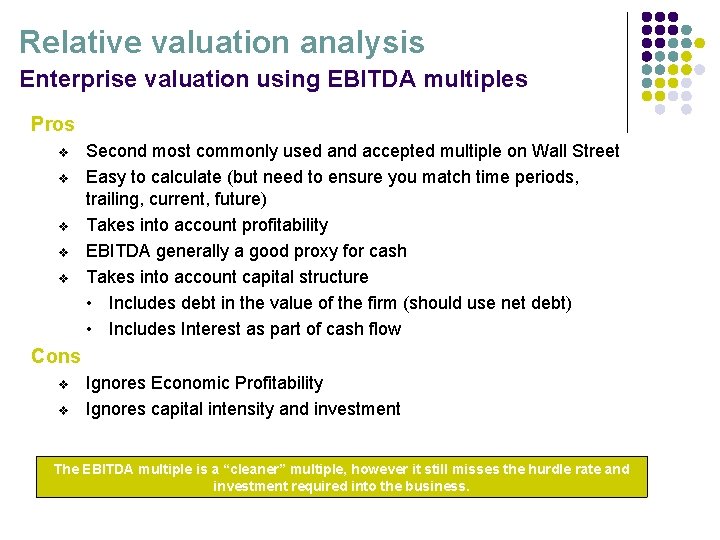
Relative valuation analysis Enterprise valuation using EBITDA multiples Pros v v v Second most commonly used and accepted multiple on Wall Street Easy to calculate (but need to ensure you match time periods, trailing, current, future) Takes into account profitability EBITDA generally a good proxy for cash Takes into account capital structure • Includes debt in the value of the firm (should use net debt) • Includes Interest as part of cash flow Cons v v Ignores Economic Profitability Ignores capital intensity and investment The EBITDA multiple is a “cleaner” multiple, however it still misses the hurdle rate and investment required into the business.
Implementing a Multiples Approach l Define the multiple § There are different definitions for the same multiple (current, trailing, forward). l It is integral to look at the entire distribution of the multiple § Understand the differences between the mean, median and standard deviation § Understand why the outlier are outliers (question relevance of the multiple and the companies inclusion in the peer group) l Understand the fundamentals of the multiple § What are the strengths and weaknesses of the multiple? l Choosing a peer group for Relative Valuation Methods § Why are you trying to determine value?