Ben Letcher USGS Conte Anadromous Fish Research Center

Ben Letcher USGS, Conte Anadromous Fish Research Center, Turners Falls, MA Keith Nislow USFS, Northern Research Station, Amherst, MA Mark Hudy USFS, Fish and Aquatic Ecology Unit, Harrisonburg, VA BROOK TROUT POPULATION PERSISTENCE How does it work?

Threats to population persistence Habitat fragmentation � Isolated populations Climate change � Stream flow and temperature Interaction of habitat fragmentation and climate change

Threats to population persistence Most systems are highly fragmented � Obvious effects for sea run � Less obvious for stream networks How small is too small? Habitat and population size Why are there fish in very small, isolated streams?

Threats to population persistence What are the consequences? � � Small population size (N and Ne) Loss of genetic variation � Genetic drift Evolutionary response? Selection against movers or large fish � � Effects may be similar to fisheryinduced evolutionary responses – loss of fishery value Reversible? Outbreeding depression following repair/reconnection? Loss of anadromous form? Life history shifts Loss of reproductive habitat

Threats to population persistence Fragmentation bad enough, now climate change � Direct effects How do stream flow and temperature affect vital rates? Fragmentation and climate change interaction � Increased importance of GCC with habitat fragmentation?

Overall goal Develop models and tools to forecast population persistence Identify reasons for persistence (mechanisms) Endpoint – probability of persistence after x years � Body size distributions Specificity ↔ Generality Eastern brook trout joint venture, 2007

Approach – working across scales Hierarchical models � Scale up � Propagate error Watershed � Sub-watershed Catchment Among-watershed � Eventual goal
 Westfield River,")
Spatial population genetics – what’s the right scale? Fine scale (10 Km) Westfield River, western MA 100 -m long sample sites 12 microsatellites Pairwise Fst 0. 11 – 0. 24 Assignment tests using Structure Similar results in NH, VT, VA Catchment and subwatershed scales Need detailed data, ~1 km

Approach Outcome Environment Stream Temperature Stream flow Habitat Fish community Population processes Reproduction Body growth Survival Movement Age structure Body size distributions Abundance Ne, N b Density dependence Catchment scale model

Approach Connected catchment scale models Mov eme nt Outcomes Subwatershed abundance and body size Movement t men e v Mo Sub-watershed scale model Movement patterns and catchmentspecific production Movement is observed with repeat sampling and PIT tag antennas

Approach Connected sub-watershed scale models Outcomes Watershedscale abundance and body size Movement Metapopulation and genetic population structure Watershed scale model Movement is observed with radio tagged fish and is inferred with genetic data

Approach – broad questions Do we need a detailed tagging study for each catchment? � Define catchment types � � Apply type to each unstudied catchment Use existing data to tune catchment type model to local conditions (Hierarchical Bayesian modeling) Can we apply models across watersheds? � Size, connectivity Minimum local data needs? Existing studies in MA, ME, NH � Planned for VA, PA/NJ (DEWA) Defining these relationships is key

Data and analysis Sub-watershed model � � � Catchment model � Variation among catchment types (size, connectivity) Movements among catchments Effects of isolation Effects of variation in stream flow and temperature on growth and survival Climate change � Population persistence for a catchment model and a subwatershed model Mov em ent Movement Mo nt e m ve
 � � Study initiated in 1997")
Study site West Brook in Western MA (USA) � � Study initiated in 1997 3 species � � Atlantic salmon, Brook trout, brown trout Study Salmon were stocked as fry (25 mm) 1997 -2004 No stocking of trout, minimal fishing pressure Long-term mark-recapture study � 1 km long mainstem � � 3 tributaries Electro-fished four times a year March, June, September and December Fish are measured and PIT tags are implanted in fish caught for first time > 25, 000 individual tags

Field study site – West Brook 42° 25’ N; 72° 39’ W Avg stream wet width = 4. 5 m

Open. Small Confluence Avg stream wet width = 2 m Top of Reach

Open. Large Confluence Avg stream wet width = 3 m Top of Reach

Isolated Confluence Avg stream wet width = 2 m Top of Reach

Stationary Antenna Locations Antennas detect temporary and permanent emigrants: get closer to estimation of ‘true’ survival

Summary – habitat fragmentation In sub-watershed scale simulations, fragmentation of current open systems can lead to rapid tributary extinction (2 -10 generations) � � � BUT, currently isolated populations can persist � Connectivity supports survival of large fish! Fragmentation means large fish cannot return to tribs Larger, ‘mainstem’ habitat and connectivity critical � � � Strong negative size-dependent survival Generation time in connected twice as long as in Isolated Size-dependent survival suggests selection against larger fish and selection against movement No emigration from isolated trib Ability to survive isolation will depend on the race between adaptation to isolation and reduced survival resulting from fragmentation Is there a common adaptation to isolation strategy � � Similar patterns in other systems Very similar patterns in whitespotted char

Consequences of fragmentation VA populations Average pairwise Fst = 0. 12 Extremely small Nb (# of breeders) Population Genotypes Nb -95% CI +95% CI Area (Ha) Length (km) AS 377 66. 7 57. 4 77. 3 3807 27. 4 BB 36 20. 8 16. 6 26. 2 2438 6. 1 DR 24 9. 3 4. 2 15. 1 1217 8. 1 FG 99 122. 9 89. 9 177. 4 590 6. 2

Multi-species fragmentation effects Greenbrier, WV Comparison of abundances with and without culverts Solid lines = passable culverts
 � Movements")
Data and analysis Sub-watershed model � Variation among catchment types (size, connectivity) � Movements among catchment � Effects of isolation Mov em ent Catchment model � Effects of variation in stream flow and temperature on growth and survival Movement Climate change � Catchment model � Population persistence with GCC Sub-watershed model Population persistence with interaction of GCC and isolation Mo nt e m ve

Seasonal growth rate variation About ¾ of yearly growth occurs in spring

Interactive effect of season Spring and summer � Growth increases with temperature Summer and Fall � Growth decreases with temperature

Interactive effects of flow Spring � Growth increased with temperature at a faster rate with higher flows Summer and fall � Higher flows exacerbated negative effects of temperature on growth High Q Low Q

Survival summary T and F had biggest effects in summer Increase in T led to decreased survival across all size classes Decrease in F led to lower survival for larger fish � Low flow event survival by 17%
 >3, 000 fish genotyped Mating strategies � �")
Parentage assignment using microsatellites (12) >3, 000 fish genotyped Mating strategies � � Age 0 – age 4 Mostly age 1 and age 2 Mostly 1 Iteroparity 100 150 200 Yes, some evidence Family size R 2 = 0. 3451 Female Length (mm) 0. 5 Age at mating 250 230 210 190 170 150 130 110 90 70 50 50 Size-dependent mating Surprisingly little (5% repeat spawners) Proportion Male Length (mm) Reproduction 0. 4 Males 0. 3 0. 2 0. 1 0 1 2 3 4 5 6 Number of families contributed to 250

Simulation – climate change Uses processes and parameter estimates from field Simulate abundance over time 100 years � 100 replicates � Record years to extinction � Input variables - GCC Temperature � Steam flow �

Forecasting climate change effects on population persistence Problem: can get incorrect process estimates for predictions outside the range of input variables Observed range Range for prediction → Solution: restrict range of observed input variables to approximate forecasts Rates of change – 100 years Observed range Gradual change (lose lower 0. 25) Gradual change (lose lower 0. 5) Gradual change (lose lower 1) Observed range Range for prediction Conservative, but reliable forecasts IPCC forecast for our stream 1 0. 5 0. 25

Simulation – climate change T F 73 yrs 105 yrs T F 174 yrs T F Linear change in T over 100 years

Simulations – climate change Control T x Control F = 174 yrs 1 0. 5 0. 25 T only Conservative time to extinction < 1/3 of control
 � To")
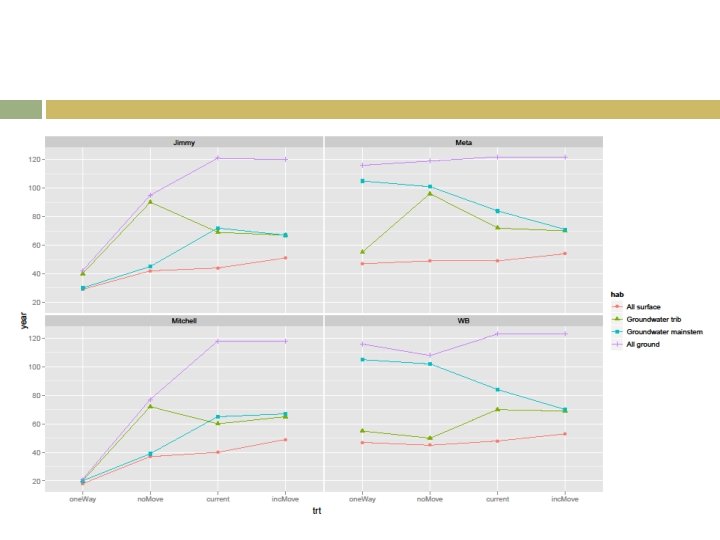
Simulation - climate change Combined effects of connectivity and habitat quality (temperature) � To what extent does groundwater buffer climate change effects? � How does connectivity influence the buffering capacity of groundwater? WB OL OS

Simulation - climate change Under current movement conditions, � All surface, persist for ~ 40 yrs � Mainstem or tributaries groundwater ~ 60 yrs � All groundwater ~ 120 yrs But, groundwater cannot compensate for climate change effects with one-way movement out of tributaries ( ~ 20 yrs) Restoring connectivity will have biggest effect in tributaries with ‘all-groundwater’ condition ( 6 -fold increase in persistence time)

Decision support Good understanding of catchment and subwatershed population persistence models in MA USFWS LCC and TNC funding to � Scale up to watershed models � Identify minimum data needs to scale up to amongwatershed models � Develop tools for managers to use Not limited to well-studied systems Apply to specific sites to address management needs Can we apply models range-wide? Need test sites Better local data = more realistic simulations

Decision support How would the DSS work? � Identify management question � Identify space and time scales � Pick stream segments on web-based map � Load local data Environmental conditions, size distributions, community, genetics, movement data, etc � Simulation will automatically fine-tune model to local conditions � Run simulations � Evaluate alternatives

Temperature and Growth in Brook Trout Growth Positive 23. 5 – Upper Limit for Growth Cortisol and Heat Shock Proteins as Biomarkers of High Temperature Exposure Negative Growth Stress Hormone (Cortisol) Heat Shock Protein 70 Chadwick & Mc. Cormick unpublished

Acknowledgements USFS � USGS/UMass � � Dr Scott Davidson, Dr Cailin Xu Krzysztof Sakrejda-Leavitt, Paul Schueller, Jason Coombs, Todd Dubreuil, Matt O’Donnell, Aimee Varady, Gregg Horton, Doug Sigourney, Stephanie Carlson and the many other people who have helped sample the stream USGS LCC program USFWS � � Northern research station for partial funding LCC program Connecticut River Coordinators Office The Nature Conservancy � Connecticut River Program


Big questions Where are brook trout? � What is the minimum patch size for persistence? � Adaptation to isolation? How will brook trout populations respond to climate change? � � � Strongholds or hopeless? How do populations with very low effective population size persist? � Occupancy model Range contraction Effects of stream flow and temperature Interactions between fragmentation and GCC What are the best strategies to mitigate future challenges?

Big questions Where are brook trout? � What is the minimum patch size for persistence? � Working with Mark Hudy (USFS), Jason Coombs (USFS), Andrew Whiteley (UMass) How do populations with very low effective population size persist? How will brook trout populations respond to climate change? � � � Need comprehensive study Range contraction Effects of stream flow and temperature Interactions between fragmentation and GCC What are the best strategies to mitigate future challenges?

Overall goal Challenges � Scale How to scale up? Space Time Can we apply short-term studies (1 -15 years) to longrange forecasts (>50 years)? Timing of local adaptation? At what organizational level do we collect data? � Define a population – how big? Where are the fish? Importance of local adaptation? Can we apply models to unstudied or poorly studied systems? Population Individual Genotype Uncertainty How propagate across scales? For example, downscaled predictions of temperature and precipitation are uncertain in space and time Need an approach to propagate this (and other) uncertainty all the way to projections of population persistence Eastern brook trout joint venture, 2007

Approach Synthetic data collection and analysis to: � Account for multiple sources of uncertainty � Allow error propagation � Provide answers in form of statistical distribution � How certain are we of result? Data Analysis Model Simulation Management tool

Approach Fine-scale data collection at multiple sites � � � Model dynamics and uncertainty using Bayesian estimation � � Growth Survival Reproduction Movement Combine statistical models into simulations � ~ 1 km Seasonal Tagged individuals Link growth and survival - interactions Develop management tool - DSS � � Web-based Evaluate alternate management strategies Data Analysis Model Simulation Management tool

What questions can we address? Habitat fragmentation � Water withdrawal � How does extent of groundwater input affect persistence? Climate change forecasts � How much water can be extracted? Importance of water source � Which barriers do we prioritize for removal/repair? What are the effects of variation in stream flow, temperature? Interactions � How much will effects of isolation and water supply be magnified under GCC?


Overview Data collection Individual tags, 3 species, Multiple rivers Multiple cohorts � Body growth, Survival, Movement Predict population size/persistence Develop DSS for brook trout / salmonids Develop general approach Approach � Simulation models Goal � Statistical models Data-driven models of population persistence on the landscape Products � � � Detailed models of population persistence Web page Workshops Watershedscale movement models Genetics Radio-tags Decision support Apply models to management ? s Working groups Web page

Progress/funding to date 1 st version complete USGS - Climate Data collection Individual tags, 3 species, Multiple rivers Multiple cohorts Tagged > 25, 000 fish [1997 - ] US Forest Service USFWS Statistical models Simulation models Body growth, Survival, Movement Predict population size/persistence Models published [2008 - ] TNC USFWS USGS - Climate Watershedscale movement models Genetics Radio-tags Decision support Apply models to management ? s Working groups Web page Proposals LCC, USGS-climate Data collected [2008 - ] TNC

Progress/funding to date Data collection Individual tags, 3 species, Multiple rivers Multiple cohorts Statistical models Simulation models Body growth, Survival, Movement Predict population size/persistence Current team � Ben Letcher, Keith Nislow (USFS) � 1 post-doc - TNC � 2 Ph. D students – USGS, TNC � 1 technician - TNC Watershedscale movement models Genetics Radio-tags Decision support Apply models to management ? s Working groups Web page

What needs to be done? Data collection Individual tags, 3 species, Multiple rivers Multiple cohorts Body growth, Survival, Movement Predict population size/persistence Incorporate watershed-scale movement models Apply models to unstudied watersheds � � Simulation models Apply models to management ? s Working groups Web page Scale up models to landscape � Statistical models Decision support Develop ‘hierarchical models’ � Apply models to less-well-studied regions Explicitly account for uncertainty through all modeling steps � Provide estimate of uncertainty for decisions Develop web page / interactive platform for scenario testing Watershedscale movement models Genetics Radio-tags Expand to the landscape

What’s the spatial range/scale? Data collection Individual tags, 3 species, Multiple rivers Multiple cohorts Simulation models Body growth, Survival, Movement Predict population size/persistence Brook trout and Atlantic salmon cover most of LCC � � Statistical models Brook trout – Appalachians to Maine Atlantic salmon – Primarily Maine Spatial resolution � � � Targeted appraoch Finest – 20 -m Coarsest – entire watershed (supercomputer) Watershedscale movement models Genetics Radio-tags Decision support Apply models to management ? s Working groups Web page

What questions can be answered? Data collection Individual tags, 3 species, Multiple rivers Multiple cohorts � � Simulation models Body growth, Survival, Movement Predict population size/persistence Prioritize streams or reaches as management target � Statistical models Identify at-risk regions Prioritize barriers for replacement/repair Evaluate effects of water withdrawals on population persistence Use whole approach as model for other systems Evaluate landuse/landchange effects on stream fish � In ‘phase II’, combine with terrestrial modeling Watershedscale movement models Genetics Radio-tags Decision support Apply models to management ? s Working groups Web page

What’s the timeline? Data collection Watershed-scale Individual tags, movement models 3 species, Multiple rivers Multiple cohorts Hierarchical model development Web page development Model use/application workshops Year 1 Year 2 Statistical Ph. D Student, models programmer Simulation Ph. D Student, models programmer Body growth, Survival, Movement Post-doc, programmer Predict population size/persistence Year 3 Decision support Apply models to management ? s Working groups Web page Post-doc, programmer All Watershed. Programmer scale movement models Genetics Radio-tags All

What are the products? Data collection Individual tags, 3 species, Multiple rivers Multiple cohorts � Body growth, Survival, Movement Predict population size/persistence General approach - scaling up, uncertainty, applying across the landscape, minimal data needs Computer code Scientific journal articles � Simulation models Models � Statistical models Scaling up, Hierarchical models for conservation, Approaches to developing models for DSS Interactive web page � � Primary tool for DSS Workshops: community of modelers/resource managers Watershedscale movement models Genetics Radio-tags Decision support Apply models to management ? s Working groups Web page

Approach Catchment scale model Among catchments Outcome Abundance and body size Movement Fish community Geomorphology Sub-watershed scale model Movement patterns and catchmentspecific production

Approach Sub-watershed scale model Among sub-watershed Outcome Abundance and body size Connectivity Local climate Metapopulation and genetic population structure Watershed scale model

Approach Sub-watershed scale model Among sub-watershed Outcome Abundance and body size Connectivity Local climate Metapopulation and genetic population structure Among-watershed scale model

Data - isolation Three cohorts � 2524 tagged individuals � 2001, 2002, 2003 12 mm PIT tags (fish length >60 mm) 16 sampling occasions � Two-pass electrofishing (20 -m sections)
 Emigration from tributaries 0. 3 Open. Small 0. 25 WB")
Probability of emigrating (∙Mo-1) Emigration from tributaries 0. 3 Open. Small 0. 25 WB Open. Large OL 0. 2 0. 15 OS 0. 1 Isolated 0. 05 0 1 2 3 Size state 4 Recolonization is key for persistence of currently connected tributaries

 3 Locations West Brook (WB) Open. Large (OL)")
State variables 4 Sizes (FL, mm) 3 Locations West Brook (WB) Open. Large (OL) Isolated Estimate separately, 4 size states only 1. 2. 3. 4. 60 -95 [0+] 96 -115 [~1+] 116 -135 [~2+] >135 [~3+] Open. Small (OS) No seasonality, no density-dependence Details in Letcher et al. PLo. S One 2007

Isolation 1. 2. One-way trip out Isolation = Block entry to tributaries Or, = mainstem habitat lethal Tributary extinction times West Brook + tributary extinction times Extinction: <2 individuals in a tributary WB OL OS Isolated

Open system tributary extinction times Large Block Open Both 10. 1 yrs Bloc k Block Open Small 2. 9 yrs Generation time = 1. 9 years

How can the naturally-isolated tributary population persist? NO immigration OR emigration for isolated tributary Selection against movers? Genes for moving lost? 1. Genetic population structure Spatial variation? 2. WB Identify demographic differences between Isolated tributary and Open system Matrix modeling OL OS Isolated

Population genetics 100 Isolated tributary Open. Large tributary 85 Open. Small tributary Nei’s Genetic Distance 0. 05 Based on 12 microsatellite loci West Brook Very strong evidence for reproductive isolation
")
Nominal matrices Open System WB Fix λ = 1 Early survival (emergence to tag) = 0. 0336 Generation time 1. 90 years Isolated tributary Fix λ = 1 Early survival = 0. 0488 (45% higher) Generation time 0. 83 years OL OS Isolated
 Isolated � Open. Small � Size-dependence:")
Size-dependent survival � 1 Probability of survival (∙Mo-1) Isolated � Open. Small � Size-dependence: Yes Poor survival of large fish Fish do not move out 0. 95 Isolated Open. Small � 0. 9 � � 0. 85 0. 8 1 2 3 Size state 4 Size-dependence: Yes Large fish move out of Open. Small WB a ‘refuge’ for large fish from tributaries Open. Large, West Brook � Size-dependence: No
 Isolated 0. 95 WB � Open.")
Size-dependent survival � 1 Probability of survival (∙Mo-1) Isolated 0. 95 WB � Open. Small � Open. Large Isolated Open. Small � 0. 9 � � 0. 85 0. 8 1 2 3 Size state 4 Size-dependence: Yes Poor survival of large fish Fish do not move out Size-dependence: Yes Large fish move out of Open. Small WB a ‘refuge’ for large fish from tributaries Open. Large, West Brook � Size-dependence: No

Stable stage distribution 0. 16 Open system 0. 14 More small fish in Isolated More large fish in Open system Isolated 0. 12 0. 1 0. 08 0. 06 0. 04 0. 02 0 1 2 3 Size state 4
 on lambda Similar pattern to")
Elasticity Effect of a proportional change in matrix parameter(s) on lambda Similar pattern to SSD 60 Open System Summed elasticity 50 Isolated 40 30 20 10 0 1 2 3 Size state 4

Elasticity 35 WB Open. Small 30 Similar pattern to SSD Large fish particularly important in WB Open. Large Elasticity 25 Isolated 20 15 10 5 0 1 2 3 Size state 4

Elasticities Persistence of small tributaries Open small persists because large fish can leave and return to spawn � Isolated persists because smaller fish are more abundant , reproduce earlier and contribute more to lambda Ratio of elasticities of Largest/Smallest size � 4. 5 4 3. 5 3 2. 5 2 1. 5 Isolated 1 Open. Small Open. Large 2 3 4 WB Why don’t big fish leave? ? ?
 rescue Open. Small and Open.")
Demographic ‘rescue’ Can early survival in Isolated (45% higher) rescue Open. Small and Open. Large from isolation? No, λ 0. 88 0. 95 Open. Large � OL Open. Small � WB Yes, λ 0. 94 0. 99 If novel isolation could select for higher early survival, isolated populations could persist � � How fast could pops evolve? Is isolation itself the selective agent? OS Isolated

Big concerns � Small Too many confounding factors � Loss of genetic variation � Life Up Allelic diversity could be used, but confounding factors Would need landscape genetics approach to frame problem Evolutionary response? Down x Genetic drift population size Selection against movers or large fish SNPs for movement/growth/age of maturity? Promising, but longterm history shifts Age at maturity – consistent enough? Not easy to measure Growth rate – confounding factors, common environment studies difficult
- Slides: 75