
Fun with Numbers 101 Debbie Scholl Owner Fundamentally
Fun with Numbers 101 Debbie Scholl, Owner Fundamentally Toys fundamentally@sbcglobal. net #ASTRATOY © 2016 American Specialty Toy Retailing Association
Math can help us understand maximize our retail performance • Today’s Focus • Margin • Turn • Stock to Sales • Sales per Square Foot • Sales Analysis #ASTRATOY © 2016 American Specialty Toy Retailing Association
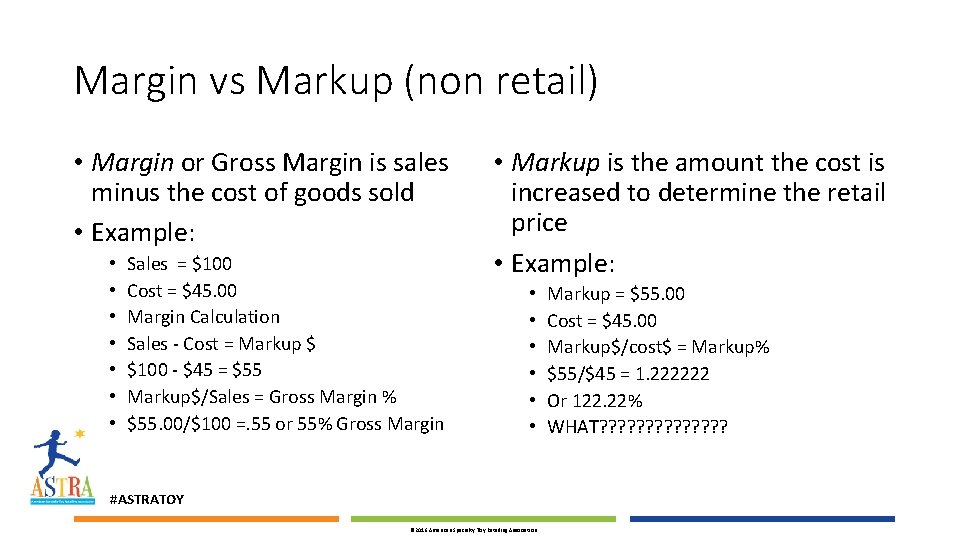
Margin vs Markup (non retail) • Margin or Gross Margin is sales minus the cost of goods sold • Example: • • Sales = $100 Cost = $45. 00 Margin Calculation Sales - Cost = Markup $ $100 - $45 = $55 Markup$/Sales = Gross Margin % $55. 00/$100 =. 55 or 55% Gross Margin • Markup is the amount the cost is increased to determine the retail price • Example: • • • #ASTRATOY © 2016 American Specialty Toy Retailing Association Markup = $55. 00 Cost = $45. 00 Markup$/cost$ = Markup% $55/$45 = 1. 222222 Or 122. 22% WHAT? ? ? ?
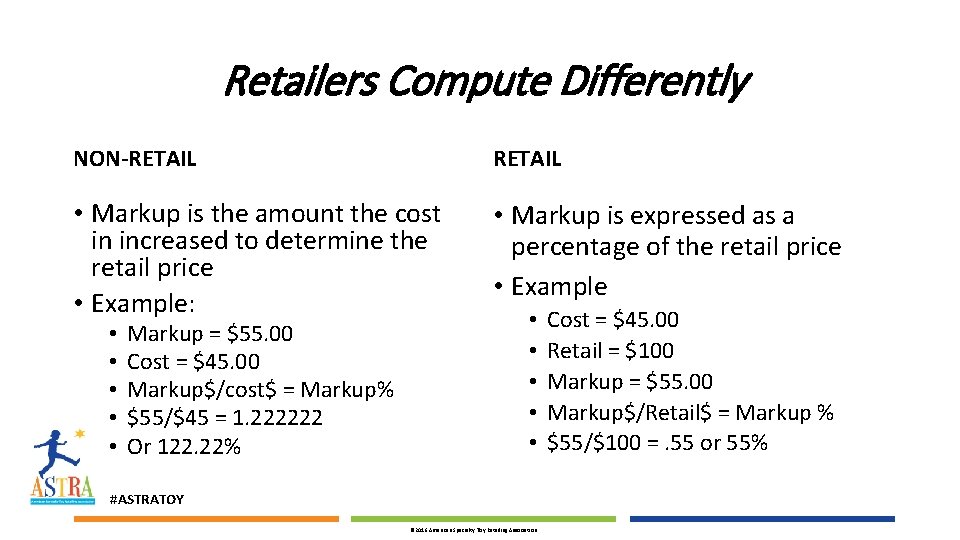
Retailers Compute Differently NON-RETAIL • Markup is the amount the cost in increased to determine the retail price • Example: • Markup is expressed as a percentage of the retail price • Example • • • Markup = $55. 00 Cost = $45. 00 Markup$/cost$ = Markup% $55/$45 = 1. 222222 Or 122. 22% • • • #ASTRATOY © 2016 American Specialty Toy Retailing Association Cost = $45. 00 Retail = $100 Markup = $55. 00 Markup$/Retail$ = Markup % $55/$100 =. 55 or 55%
Profit-Based Pricing • Retail markup takes retail store operations into consideration • There is more to consider than cost of goods sold • Price with consideration to your overall expense structure • Somewhere along the way the concept of doubling cost became a standard practice - Keystone • Not all products are created equal • Create a mix of pricing structures in your assortment • Every store/market is different #ASTRA 17 #ASTRATOY © 2016 American Specialty Toy Retailing Association
MARK-UP MIX • Seek out unique or somewhat exclusive vendors • Manufacturers with limited exposure in your area • Take HIGHER mark-up on their products 55% to 60% • Develop a good working relationship with these vendors • Bring in a limited selection of mass items • • Price items to be somewhat competitive 25% to 40% mark up Don’t send the customer elsewhere to get what they want Take advantage of Toy R Us closing Up-sell, make them want what you have • Keystone plus + • Double, plus a dollar or two 50% to 55% #ASTRATOY © 2016 American Specialty Toy Retailing Association
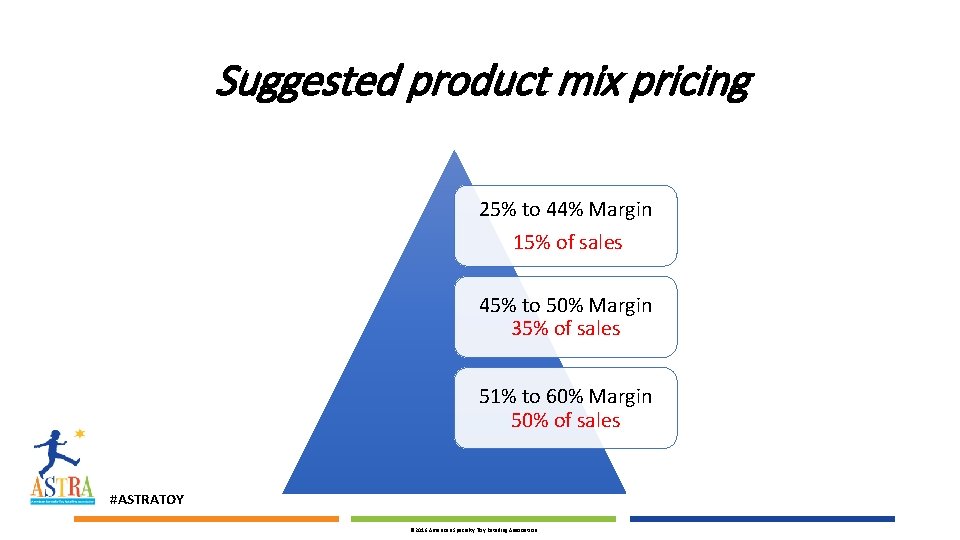
Suggested product mix pricing 25% to 44% Margin 15% of sales 45% to 50% Margin 35% of sales 51% to 60% Margin 50% of sales #ASTRATOY © 2016 American Specialty Toy Retailing Association
Markup Effect of Profits • Example $400, 000 to invest in inventory • Retail Sales @ 45% GM = ($400, 000/. 55)(reciprocal) = $727, 273 • $727, 273 - $400, 000 = $327, 273 profit $ • Retail Sales @ 50% GM = ($400, 000/. 50) = $800, 000 • $800, 000 -$400, 000 = $400, 000 profit $ +$72, 727 vs 45% • Retail Sales @ 55% GM = ($400, 000/. 45) = $888, 889 • $888, 889 - $400, 000 = $488, 889 profit $ +161, 616 vs 45% $88, 889 vs 50% • EVERY MARGIN POINT IS EXPONENTIONALLY BETTER #ASTRATOY © 2016 American Specialty Toy Retailing Association
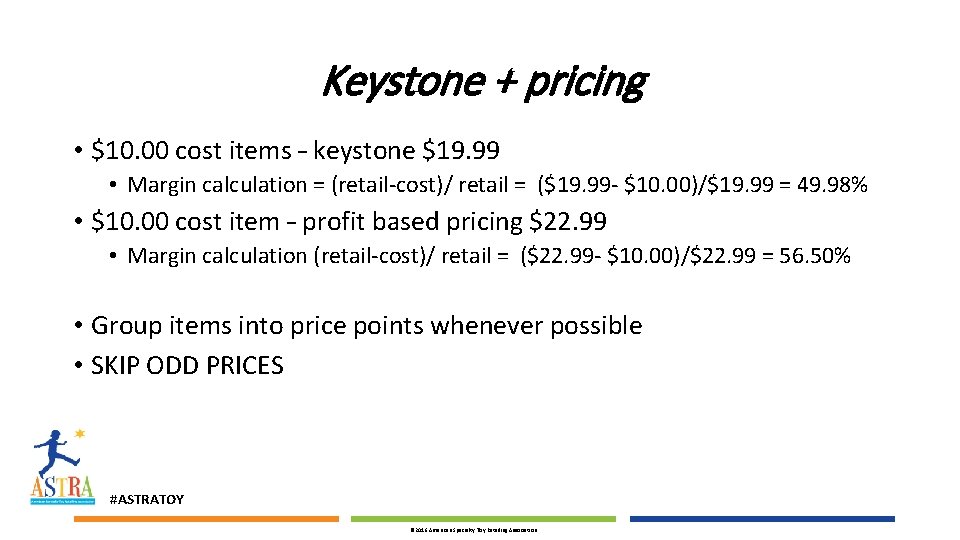
Keystone + pricing • $10. 00 cost items – keystone $19. 99 • Margin calculation = (retail-cost)/ retail = ($19. 99 - $10. 00)/$19. 99 = 49. 98% • $10. 00 cost item – profit based pricing $22. 99 • Margin calculation (retail-cost)/ retail = ($22. 99 - $10. 00)/$22. 99 = 56. 50% • Group items into price points whenever possible • SKIP ODD PRICES #ASTRATOY © 2016 American Specialty Toy Retailing Association
Plan for Margin Reduction • Aim for an overall initial markup of 55% or better • Maintain markup around 48% to 52% • Allow for promotions and markdowns • Take Freight charges into consideration #ASTRATOY © 2016 American Specialty Toy Retailing Association
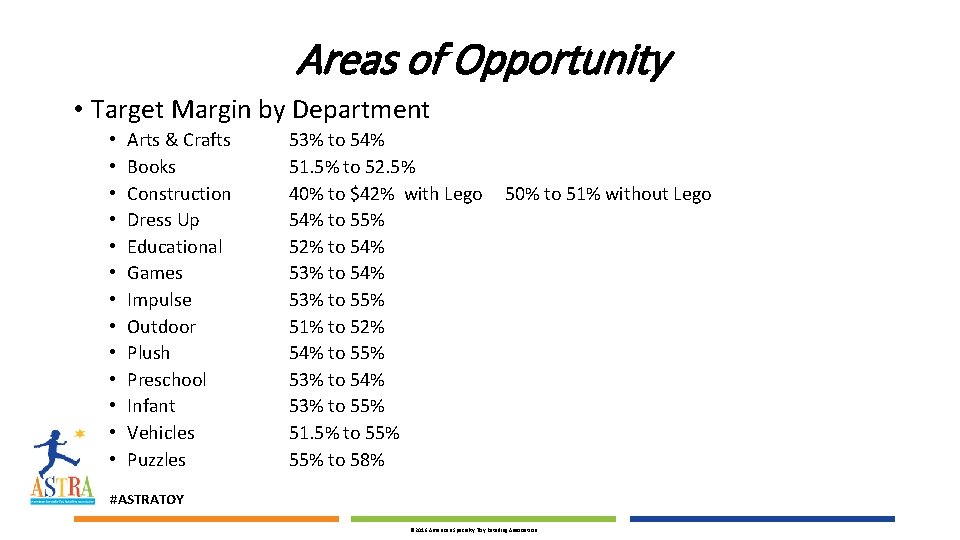
Areas of Opportunity • Target Margin by Department • • • • Arts & Crafts Books Construction Dress Up Educational Games Impulse Outdoor Plush Preschool Infant Vehicles Puzzles 53% to 54% 51. 5% to 52. 5% 40% to $42% with Lego 54% to 55% 52% to 54% 53% to 55% 51% to 52% 54% to 55% 53% to 54% 53% to 55% 51. 5% to 55% to 58% 50% to 51% without Lego #ASTRATOY © 2016 American Specialty Toy Retailing Association
TURN = CA$H • Turn is the number of times inventory is sold (turned into cash) in a year • Equation = Cost of Goods sold/Average inventory at cost • OR Retail Sales/Average inventory at retail • Stock levels vary each month so an average is used • Use 13 inventory numbers to get the most accurate average • 12 months BOM (Beginning of Month) plus last month’s ending inventory • Don’t mix cost numbers with retail numbers • A good overall turn number is 3. 5 to 4 times #ASTRATOY © 2016 American Specialty Toy Retailing Association
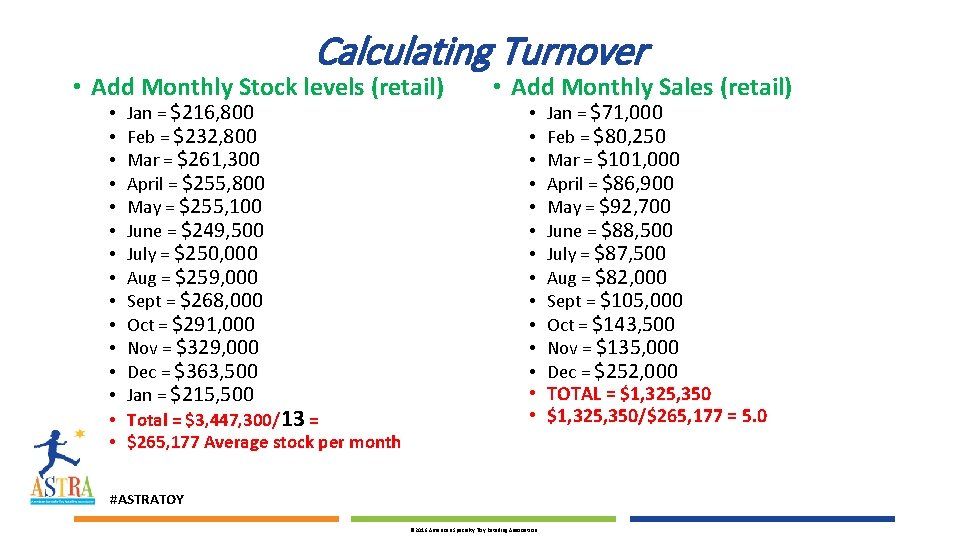
Calculating Turnover • Add Monthly Stock levels (retail) • • • • Jan = $216, 800 Feb = $232, 800 Mar = $261, 300 April = $255, 800 May = $255, 100 June = $249, 500 July = $250, 000 Aug = $259, 000 Sept = $268, 000 Oct = $291, 000 Nov = $329, 000 Dec = $363, 500 Jan = $215, 500 Total = $3, 447, 300/13 = $265, 177 Average stock per month • Add Monthly Sales (retail) • • • Jan = $71, 000 Feb = $80, 250 Mar = $101, 000 April = $86, 900 May = $92, 700 June = $88, 500 July = $87, 500 Aug = $82, 000 Sept = $105, 000 Oct = $143, 500 Nov = $135, 000 Dec = $252, 000 • TOTAL = $1, 325, 350 • $1, 325, 350/$265, 177 = 5. 0 #ASTRATOY © 2016 American Specialty Toy Retailing Association
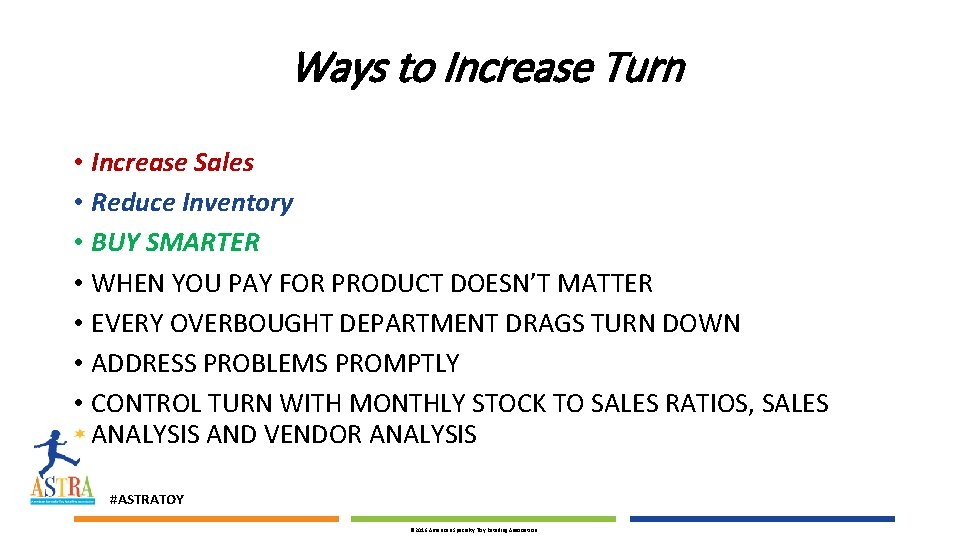
Ways to Increase Turn • Increase Sales • Reduce Inventory • BUY SMARTER • WHEN YOU PAY FOR PRODUCT DOESN’T MATTER • EVERY OVERBOUGHT DEPARTMENT DRAGS TURN DOWN • ADDRESS PROBLEMS PROMPTLY • CONTROL TURN WITH MONTHLY STOCK TO SALES RATIOS, SALES ANALYSIS AND VENDOR ANALYSIS #ASTRATOY © 2016 American Specialty Toy Retailing Association
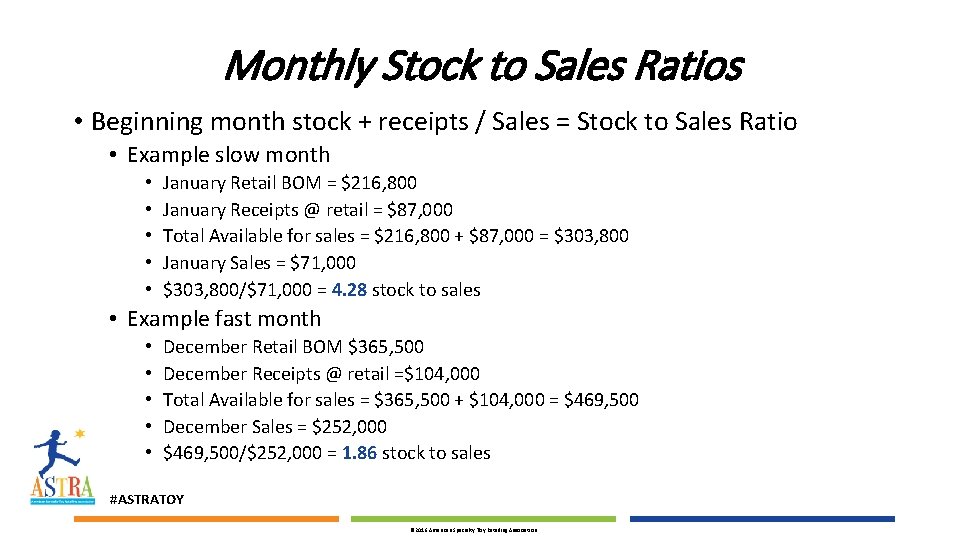
Monthly Stock to Sales Ratios • Beginning month stock + receipts / Sales = Stock to Sales Ratio • Example slow month • • • January Retail BOM = $216, 800 January Receipts @ retail = $87, 000 Total Available for sales = $216, 800 + $87, 000 = $303, 800 January Sales = $71, 000 $303, 800/$71, 000 = 4. 28 stock to sales • Example fast month • • • December Retail BOM $365, 500 December Receipts @ retail =$104, 000 Total Available for sales = $365, 500 + $104, 000 = $469, 500 December Sales = $252, 000 $469, 500/$252, 000 = 1. 86 stock to sales #ASTRATOY © 2016 American Specialty Toy Retailing Association
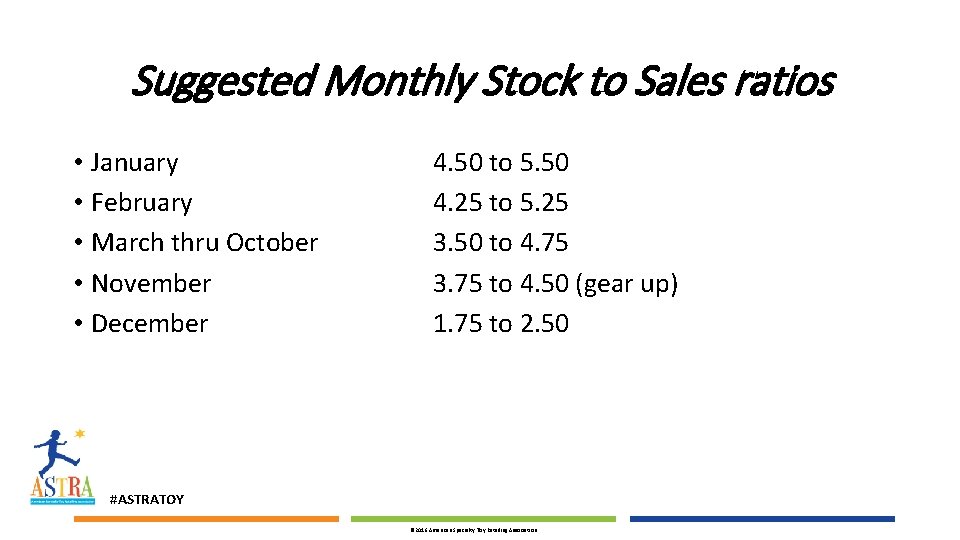
Suggested Monthly Stock to Sales ratios • January • February • March thru October • November • December 4. 50 to 5. 50 4. 25 to 5. 25 3. 50 to 4. 75 3. 75 to 4. 50 (gear up) 1. 75 to 2. 50 #ASTRATOY © 2016 American Specialty Toy Retailing Association
Proactive vs Reactive • Plan ahead • Create an annual buying plan complete with projected sales, receipts, and inventory levels for EVERY DEPARTMENT and EVERY MONTH • Track monthly with actual performance • Adjust as needed • Get a Point of Sale system that gives you accurate information • Stop emotional buying #ASTRATOY © 2016 American Specialty Toy Retailing Association
Know where your Gold Mines Are • Look at your sales verses allotted square footage • Review by department • Review by key vendors • See what areas/vendors are producing $$$$$$$ • Analyze and adjust • Understand the nuances of each department/vendor #ASTRATOY © 2016 American Specialty Toy Retailing Association
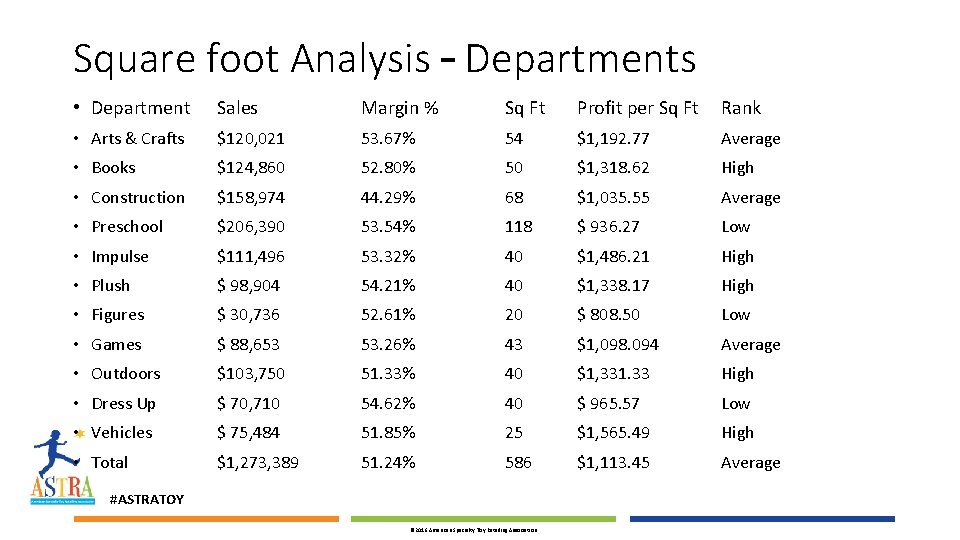
Square foot Analysis – Departments • Department Sales Margin % Sq Ft Profit per Sq Ft Rank • Arts & Crafts $120, 021 53. 67% 54 $1, 192. 77 Average • Books $124, 860 52. 80% 50 $1, 318. 62 High • Construction $158, 974 44. 29% 68 $1, 035. 55 Average • Preschool $206, 390 53. 54% 118 $ 936. 27 Low • Impulse $111, 496 53. 32% 40 $1, 486. 21 High • Plush $ 98, 904 54. 21% 40 $1, 338. 17 High • Figures $ 30, 736 52. 61% 20 $ 808. 50 Low • Games $ 88, 653 53. 26% 43 $1, 098. 094 Average • Outdoors $103, 750 51. 33% 40 $1, 331. 33 High • Dress Up $ 70, 710 54. 62% 40 $ 965. 57 Low • Vehicles $ 75, 484 51. 85% 25 $1, 565. 49 High • Total $1, 273, 389 51. 24% 586 $1, 113. 45 Average #ASTRATOY © 2016 American Specialty Toy Retailing Association
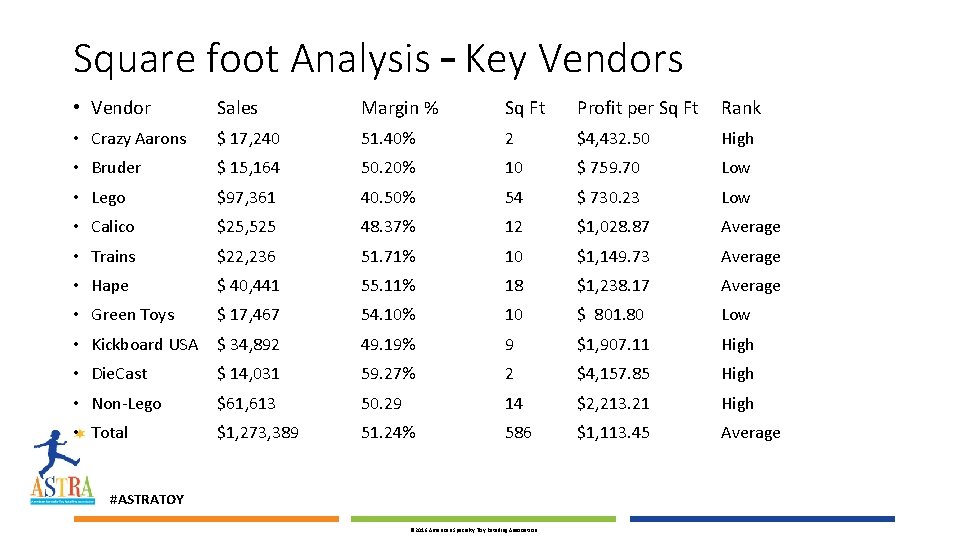
Square foot Analysis – Key Vendors • Vendor Sales Margin % Sq Ft Profit per Sq Ft Rank • Crazy Aarons $ 17, 240 51. 40% 2 $4, 432. 50 High • Bruder $ 15, 164 50. 20% 10 $ 759. 70 Low • Lego $97, 361 40. 50% 54 $ 730. 23 Low • Calico $25, 525 48. 37% 12 $1, 028. 87 Average • Trains $22, 236 51. 71% 10 $1, 149. 73 Average • Hape $ 40, 441 55. 11% 18 $1, 238. 17 Average • Green Toys $ 17, 467 54. 10% 10 $ 801. 80 Low • Kickboard USA $ 34, 892 49. 19% 9 $1, 907. 11 High • Die. Cast $ 14, 031 59. 27% 2 $4, 157. 85 High • Non-Lego $61, 613 50. 29 14 $2, 213. 21 High • Total $1, 273, 389 51. 24% 586 $1, 113. 45 Average #ASTRATOY © 2016 American Specialty Toy Retailing Association
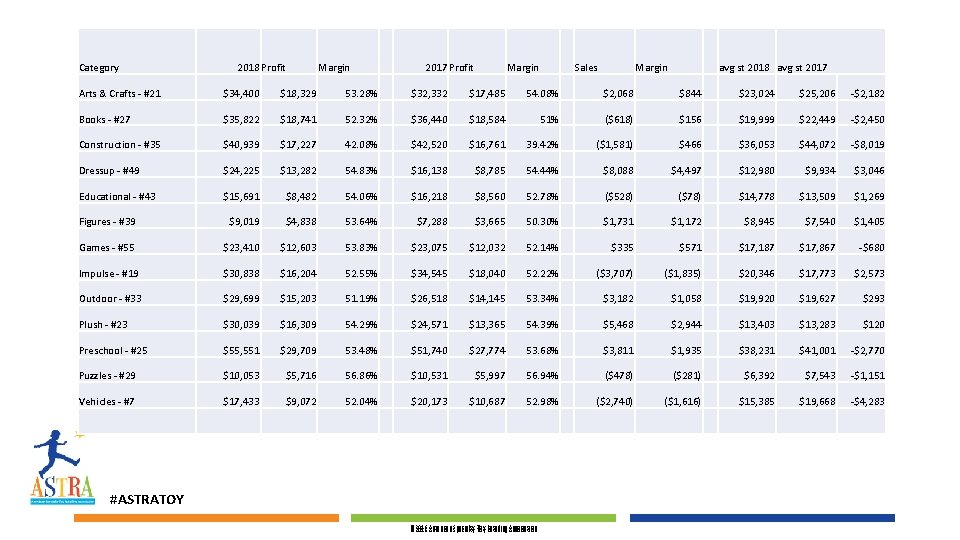
Category 2018 Profit Margin 2017 Profit Margin Sales Margin avg st 2018 avg st 2017 Arts & Crafts - #21 $34, 400 $18, 329 53. 28% $32, 332 $17, 485 54. 08% $2, 068 $844 $23, 024 $25, 206 -$2, 182 Books - #27 $35, 822 $18, 741 52. 32% $36, 440 $18, 584 51% ($618) $156 $19, 999 $22, 449 -$2, 450 Construction - #35 $40, 939 $17, 227 42. 08% $42, 520 $16, 761 39. 42% ($1, 581) $466 $36, 053 $44, 072 -$8, 019 Dressup - #49 $24, 225 $13, 282 54. 83% $16, 138 $8, 785 54. 44% $8, 088 $4, 497 $12, 980 $9, 934 $3, 046 Educational - #43 $15, 691 $8, 482 54. 06% $16, 218 $8, 560 52. 78% ($528) ($78) $14, 778 $13, 509 $1, 269 Figures - #39 $9, 019 $4, 838 53. 64% $7, 288 $3, 665 50. 30% $1, 731 $1, 172 $8, 945 $7, 540 $1, 405 Games - #55 $23, 410 $12, 603 53. 83% $23, 075 $12, 032 52. 14% $335 $571 $17, 187 $17, 867 -$680 Impulse - #19 $30, 838 $16, 204 52. 55% $34, 545 $18, 040 52. 22% ($3, 707) ($1, 835) $20, 346 $17, 773 $2, 573 Outdoor - #33 $29, 699 $15, 203 51. 19% $26, 518 $14, 145 53. 34% $3, 182 $1, 058 $19, 920 $19, 627 $293 Plush - #23 $30, 039 $16, 309 54. 29% $24, 571 $13, 365 54. 39% $5, 468 $2, 944 $13, 403 $13, 283 $120 Preschool - #25 $55, 551 $29, 709 53. 48% $51, 740 $27, 774 53. 68% $3, 811 $1, 935 $38, 231 $41, 001 -$2, 770 Puzzles - #29 $10, 053 $5, 716 56. 86% $10, 531 $5, 997 56. 94% ($478) ($281) $6, 392 $7, 543 -$1, 151 Vehicles - #7 $17, 433 $9, 072 52. 04% $20, 173 $10, 687 52. 98% ($2, 740) ($1, 616) $15, 385 $19, 668 -$4, 283 #ASTRATOY © 2016 American Specialty Toy Retailing Association
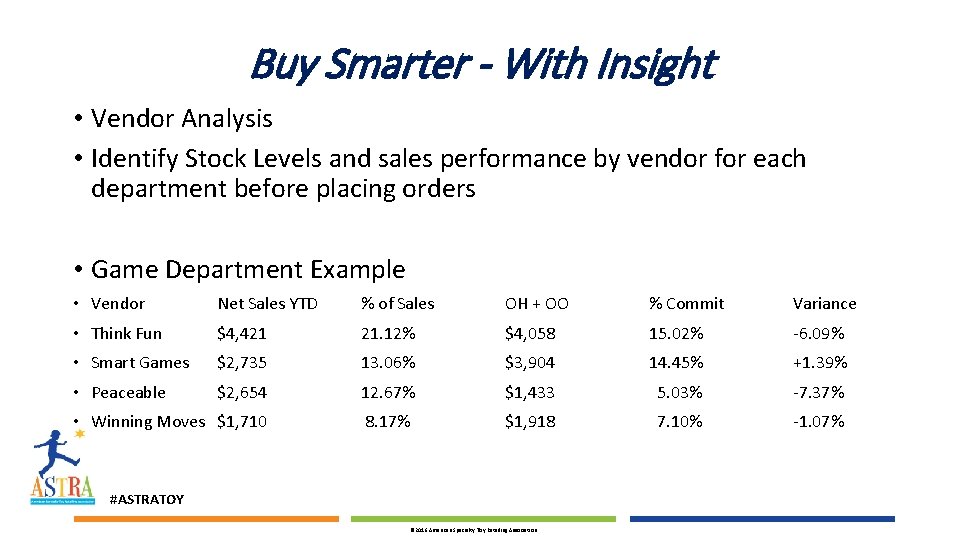
Buy Smarter - With Insight • Vendor Analysis • Identify Stock Levels and sales performance by vendor for each department before placing orders • Game Department Example • Vendor Net Sales YTD % of Sales OH + OO % Commit Variance • Think Fun $4, 421 21. 12% $4, 058 15. 02% -6. 09% • Smart Games $2, 735 13. 06% $3, 904 14. 45% +1. 39% • Peaceable $2, 654 12. 67% $1, 433 5. 03% -7. 37% • Winning Moves $1, 710 8. 17% $1, 918 7. 10% -1. 07% #ASTRATOY © 2016 American Specialty Toy Retailing Association
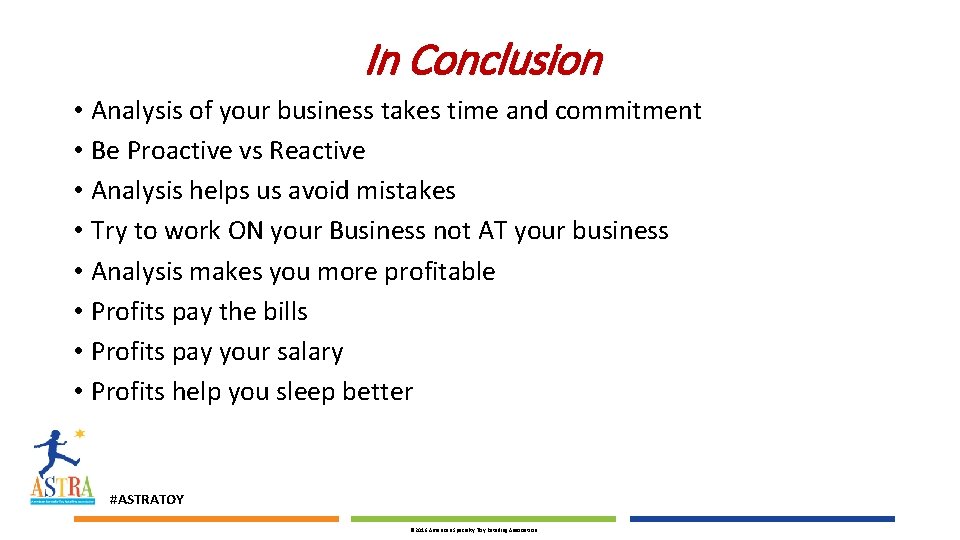
In Conclusion • Analysis of your business takes time and commitment • Be Proactive vs Reactive • Analysis helps us avoid mistakes • Try to work ON your Business not AT your business • Analysis makes you more profitable • Profits pay the bills • Profits pay your salary • Profits help you sleep better #ASTRATOY © 2016 American Specialty Toy Retailing Association
THANK YOU FOR ATTENDING! Do you have ideas for Marketplace & Academy? Sign up for the Planning Committee at Booth 919! SAVE THE DATE ASTRA’s 2019 Marketplace & Academy June 9 -12, 2019 Pittsburgh, PA For questions or comments, contact ASTRA at info@astratoy. org or call (312) 222 -0984 #ASTRATOY © 2016 American Specialty Toy Retailing Association
- Slides: 24