COMPLETE COLLEGE AMERICA Launching Dr Risa E Dickson

- Slides: 21
COMPLETE COLLEGE AMERICA Launching Dr. Risa E. Dickson Vice President for Academic Planning and Policy University of Hawai‘i System
2
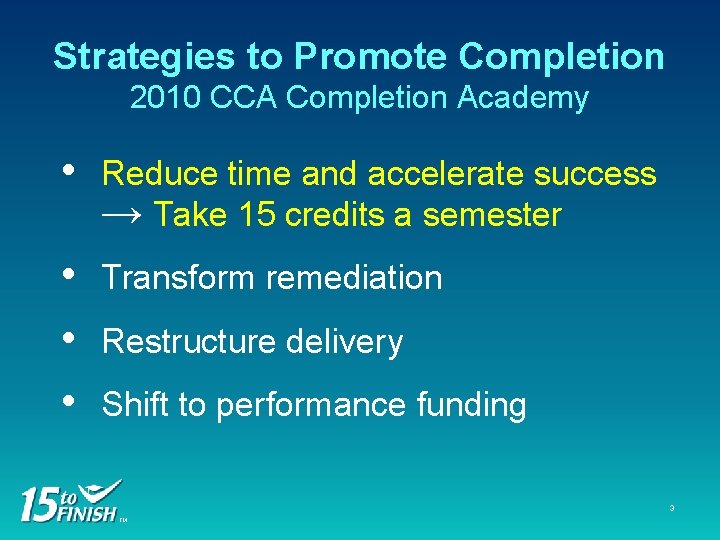
Strategies to Promote Completion 2010 CCA Completion Academy • Reduce time and accelerate success → Take 15 credits a semester • • • Transform remediation Restructure delivery Shift to performance funding 3 TM
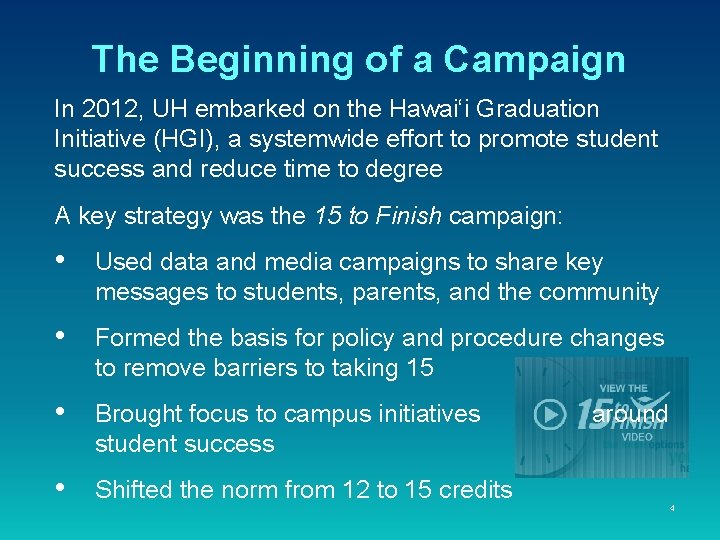
The Beginning of a Campaign In 2012, UH embarked on the Hawai‘i Graduation Initiative (HGI), a systemwide effort to promote student success and reduce time to degree A key strategy was the 15 to Finish campaign: • Used data and media campaigns to share key messages to students, parents, and the community • Formed the basis for policy and procedure changes to remove barriers to taking 15 • Brought focus to campus initiatives student success • Shifted the norm from 12 to 15 credits around 4
Initial Questions about 15 Credits • What was our current situation? • Would taking 15 credits a semester make a difference in retention and graduation rates? • Would it work for all students, including at risk populations? • Could we shift to a culture where taking 15 credits was the norm, not 12? • Could we remove existing barriers to taking 15 credits? 5
What was Our Current Situation and Would Taking 15 Make a Difference? • Studied fall 2009 -11 first-time freshmen cohorts • 55 -78% took 12 to 14 credits, including those at the community colleges • Those who completed at least 30 credit hours within their 1 st academic year had better grades and retention and graduation rates 6
Will 15 Work for All Students: Conducted an In Depth Analysis Analyzed various measures of success of first-time freshmen taking <15 credits and ≥ 15 credits per semester by: • Academic preparation – Created a score of 1 to 4 (with 4 being the highest) based on SAT/ACT, HS GPA/rank, etc. • Demographics (gender, ethnicity, Pell) 7
Measures of Academic Success • • • 1 st semester grade point average 1 st semester GPA “B” or better Credit completion ≥ 80% Course withdrawals ≥ 20% Persistence 8 TM
Results of Our Analysis Students who took 15 or more credits tended to be better prepared and to have greater academic success. More importantly, at all but the lowest levels of academic preparation, students who took 15 or more credits generally had greater academic success. This held for Pell and URM students as well. 9
Post-Campaign Results 10 TM
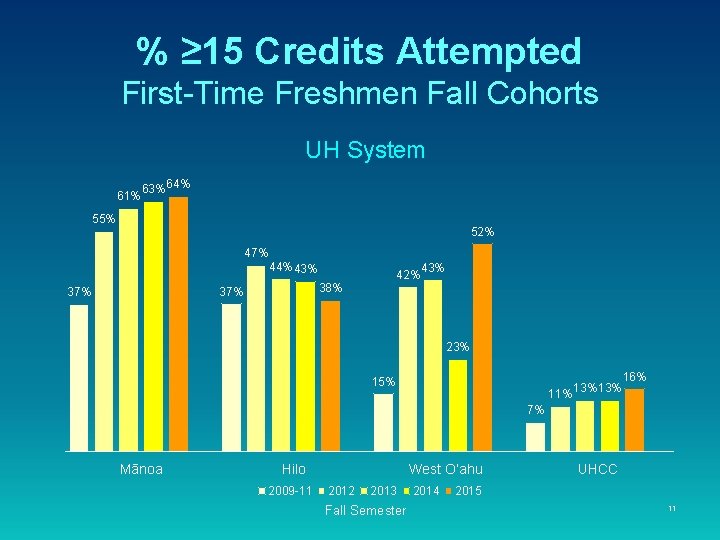
% ≥ 15 Credits Attempted First-Time Freshmen Fall Cohorts UH System 61% 63% 64% 55% 52% 47% 44% 43% 38% 37% 42% 43% 23% 15% 11% 13% 16% 7% Mānoa Hilo 2009 -11 West O‘ahu 2012 2013 Fall Semester 2014 UHCC 2015 11
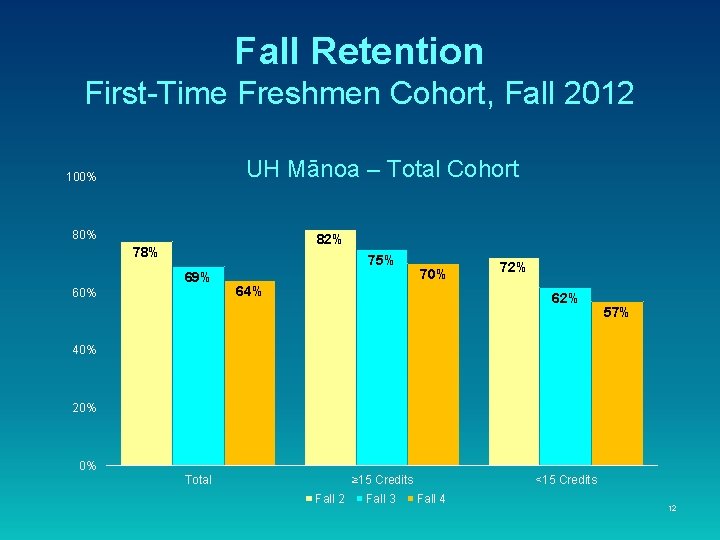
Fall Retention First-Time Freshmen Cohort, Fall 2012 UH Mānoa – Total Cohort 100% 82% 78% 75% 69% 60% 70% 64% 72% 62% 57% 40% 20% 0% Total ≥ 15 Credits Fall 2 Fall 3 <15 Credits Fall 4 12
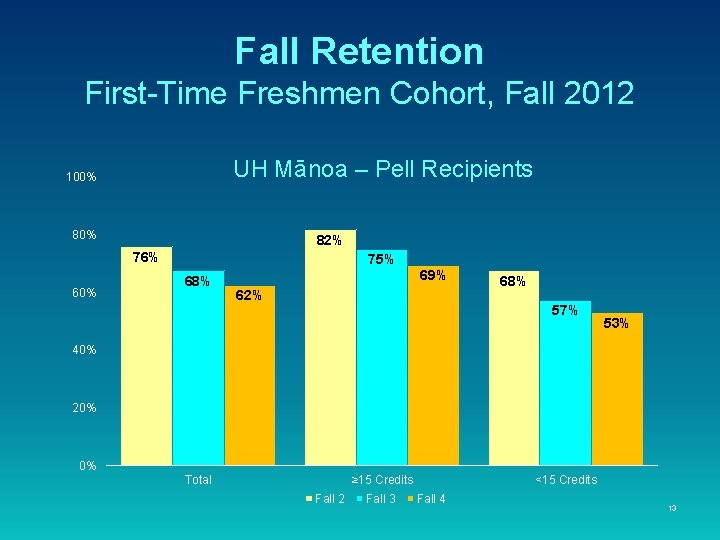
Fall Retention First-Time Freshmen Cohort, Fall 2012 UH Mānoa – Pell Recipients 100% 82% 76% 60% 75% 68% 69% 62% 68% 57% 53% 40% 20% 0% Total ≥ 15 Credits Fall 2 Fall 3 <15 Credits Fall 4 13
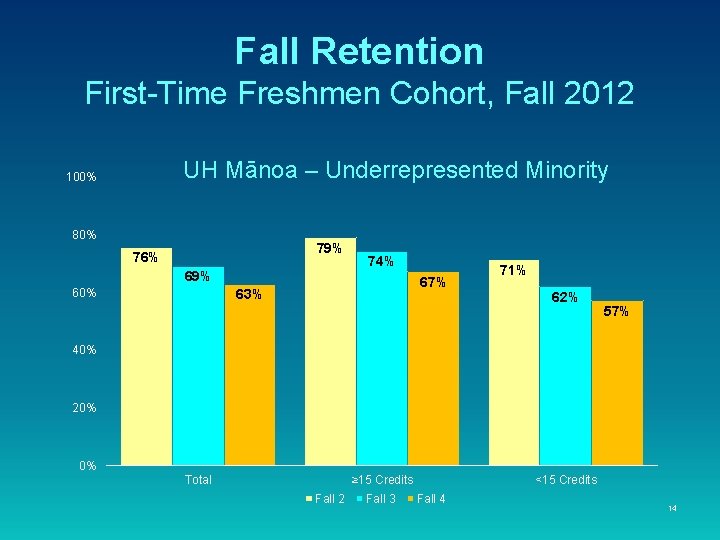
Fall Retention First-Time Freshmen Cohort, Fall 2012 UH Mānoa – Underrepresented Minority 100% 80% 79% 76% 69% 60% 74% 67% 63% 71% 62% 57% 40% 20% 0% Total ≥ 15 Credits Fall 2 Fall 3 <15 Credits Fall 4 14
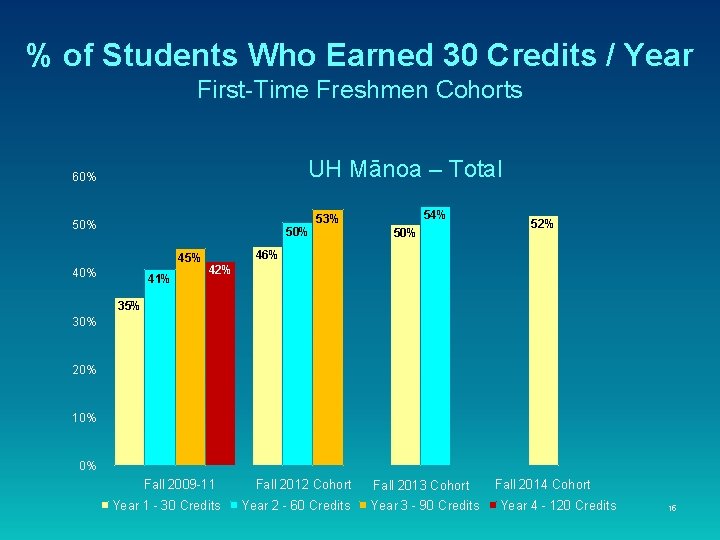
% of Students Who Earned 30 Credits / Year First-Time Freshmen Cohorts UH Mānoa – Total 60% 50% 45% 40% 41% 54% 53% 50% 52% 46% 42% 35% 30% 20% 10% 0% Fall 2009 -11 Year 1 - 30 Credits Fall 2012 Cohort Year 2 - 60 Credits Fall 2013 Cohort Year 3 - 90 Credits Fall 2014 Cohort Year 4 - 120 Credits 15
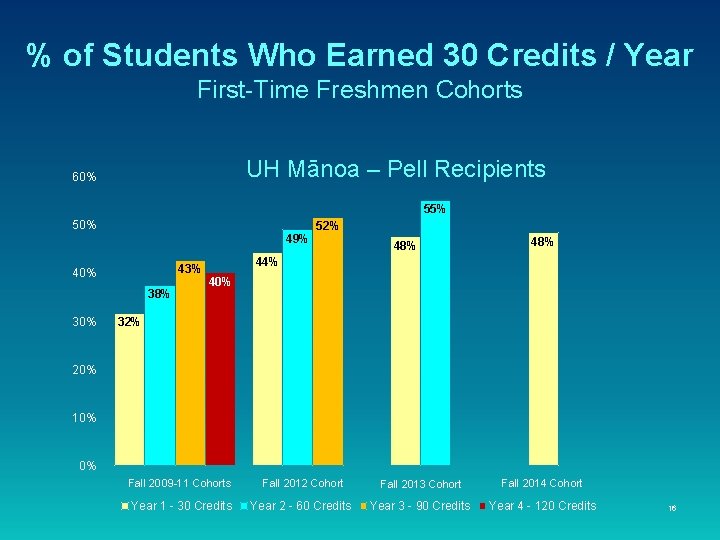
% of Students Who Earned 30 Credits / Year First-Time Freshmen Cohorts UH Mānoa – Pell Recipients 60% 55% 50% 49% 43% 40% 38% 30% 52% 48% 44% 40% 32% 20% 10% 0% Fall 2009 -11 Cohorts Fall 2012 Cohort Fall 2013 Cohort Fall 2014 Cohort Year 1 - 30 Credits Year 2 - 60 Credits Year 3 - 90 Credits Year 4 - 120 Credits 16
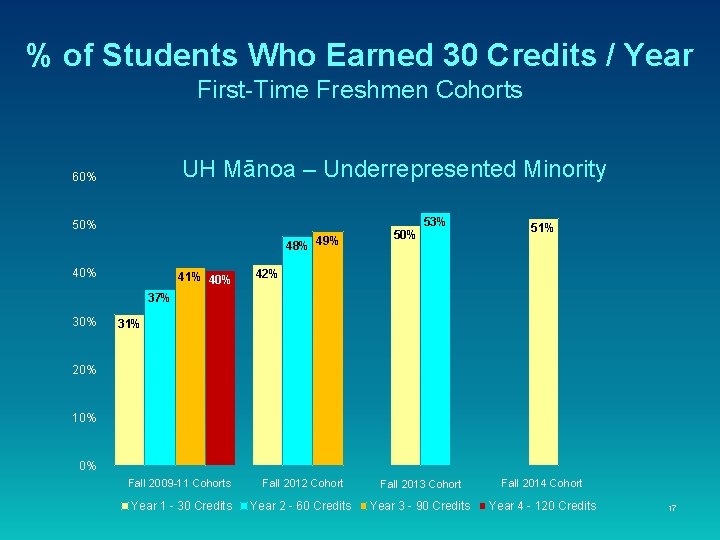
% of Students Who Earned 30 Credits / Year First-Time Freshmen Cohorts UH Mānoa – Underrepresented Minority 60% 50% 48% 49% 40% 41% 40% 53% 51% 42% 37% 30% 31% 20% 10% 0% Fall 2009 -11 Cohorts Fall 2012 Cohort Fall 2013 Cohort Fall 2014 Cohort Year 1 - 30 Credits Year 2 - 60 Credits Year 3 - 90 Credits Year 4 - 120 Credits 17
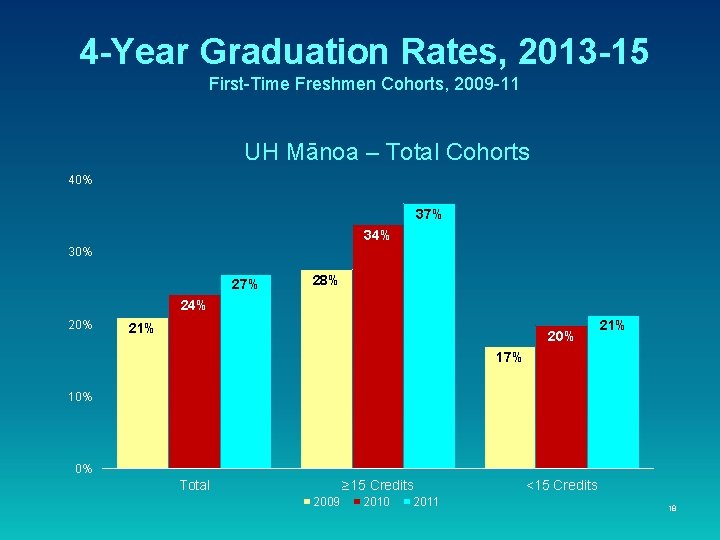
4 -Year Graduation Rates, 2013 -15 First-Time Freshmen Cohorts, 2009 -11 UH Mānoa – Total Cohorts 40% 37% 34% 30% 27% 28% 24% 20% 21% 17% 10% 0% Total ≥ 15 Credits 2009 2010 2011 <15 Credits 18
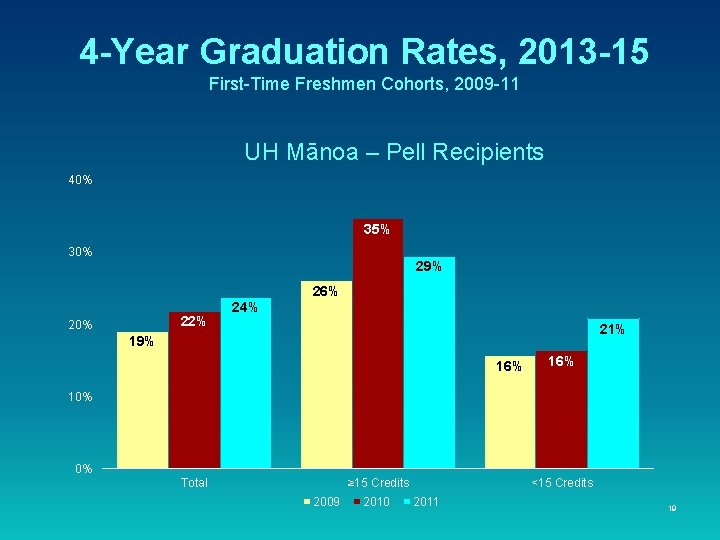
4 -Year Graduation Rates, 2013 -15 First-Time Freshmen Cohorts, 2009 -11 UH Mānoa – Pell Recipients 40% 35% 30% 29% 26% 22% 20% 24% 21% 19% 16% 10% 0% Total ≥ 15 Credits 2009 2010 <15 Credits 2011 19
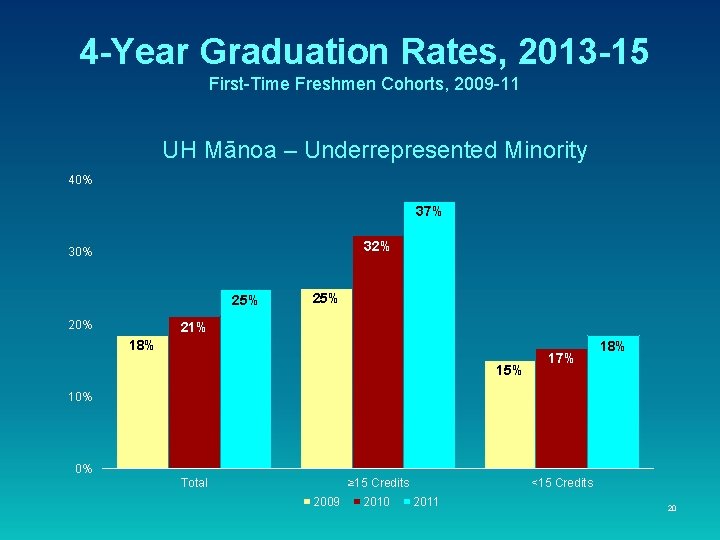
4 -Year Graduation Rates, 2013 -15 First-Time Freshmen Cohorts, 2009 -11 UH Mānoa – Underrepresented Minority 40% 37% 32% 30% 25% 21% 18% 15% 17% 18% 10% 0% Total ≥ 15 Credits 2009 2010 <15 Credits 2011 20
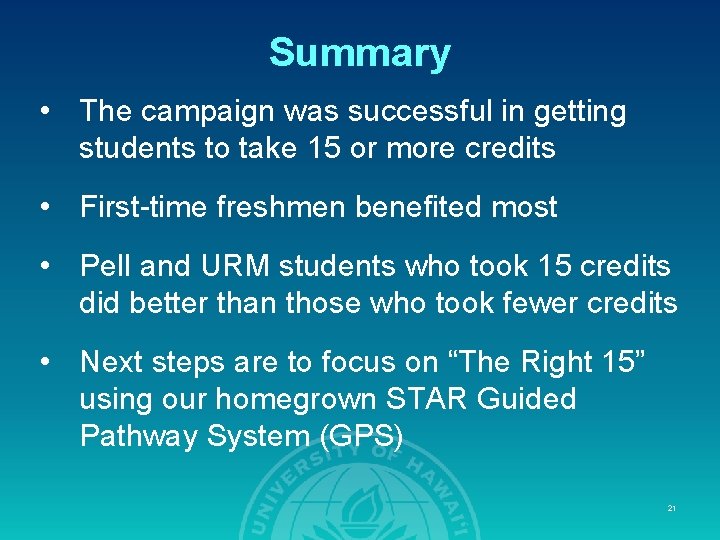
Summary • The campaign was successful in getting students to take 15 or more credits • First-time freshmen benefited most • Pell and URM students who took 15 credits did better than those who took fewer credits • Next steps are to focus on “The Right 15” using our homegrown STAR Guided Pathway System (GPS) 21