
Current market situation for Sisal Fibre Kenya By

Current market situation for Sisal Fibre - Kenya By Dickson Kibata Agriculture & Food Authority- Fibre Crops Directorate Kenya
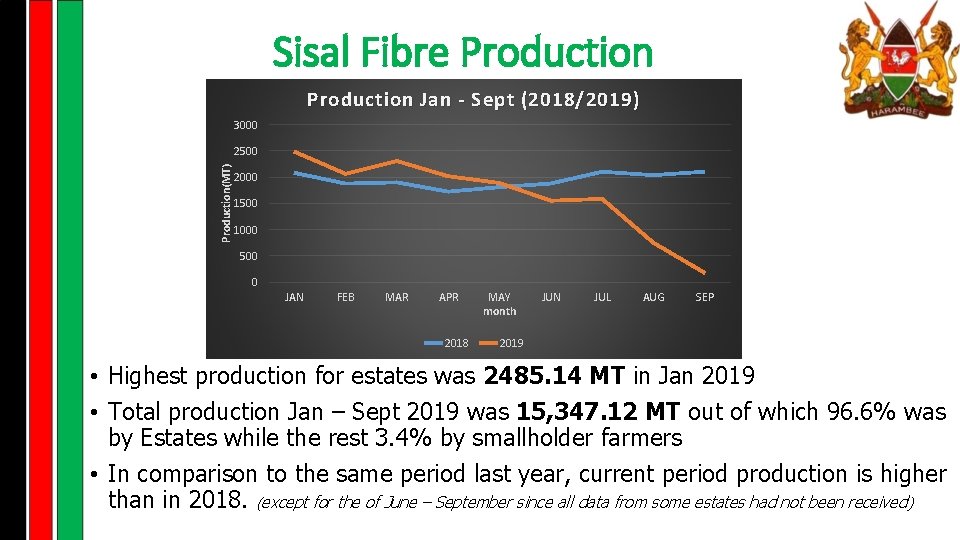
Sisal Fibre Production Jan - Sept (2018/2019) 3000 Production(MT) 2500 2000 1500 1000 500 0 JAN FEB MAR APR 2018 MAY month JUN JUL AUG SEP 2019 • Highest production for estates was 2485. 14 MT in Jan 2019 • Total production Jan – Sept 2019 was 15, 347. 12 MT out of which 96. 6% was by Estates while the rest 3. 4% by smallholder farmers • In comparison to the same period last year, current period production is higher than in 2018. (except for the of June – September since all data from some estates had not been received )
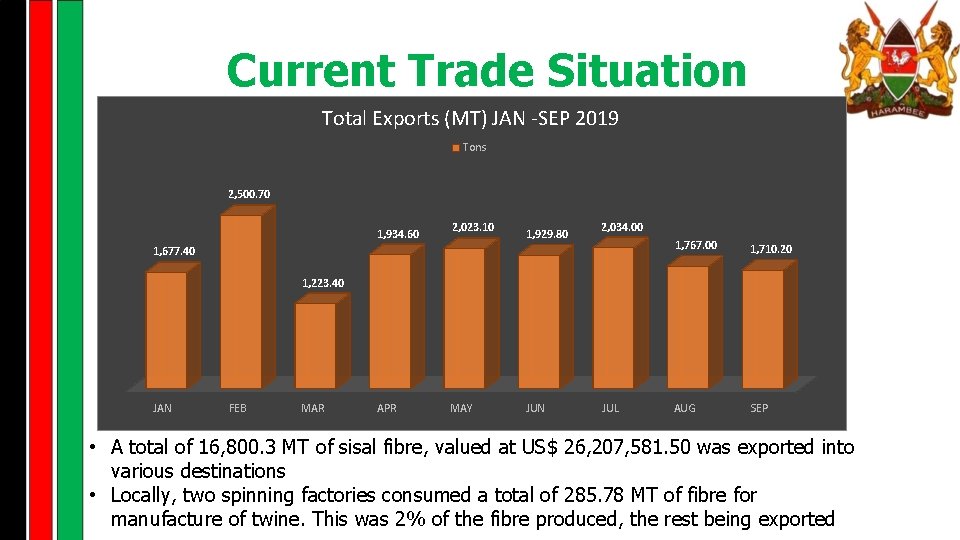
Current Trade Situation Total Exports (MT) JAN -SEP 2019 Tons 2, 500. 70 1, 934. 60 2, 023. 10 1, 929. 80 2, 034. 00 1, 677. 40 1, 767. 00 1, 710. 20 AUG SEP 1, 223. 40 JAN FEB MAR APR MAY JUN JUL • A total of 16, 800. 3 MT of sisal fibre, valued at US$ 26, 207, 581. 50 was exported into various destinations • Locally, two spinning factories consumed a total of 285. 78 MT of fibre for manufacture of twine. This was 2% of the fibre produced, the rest being exported
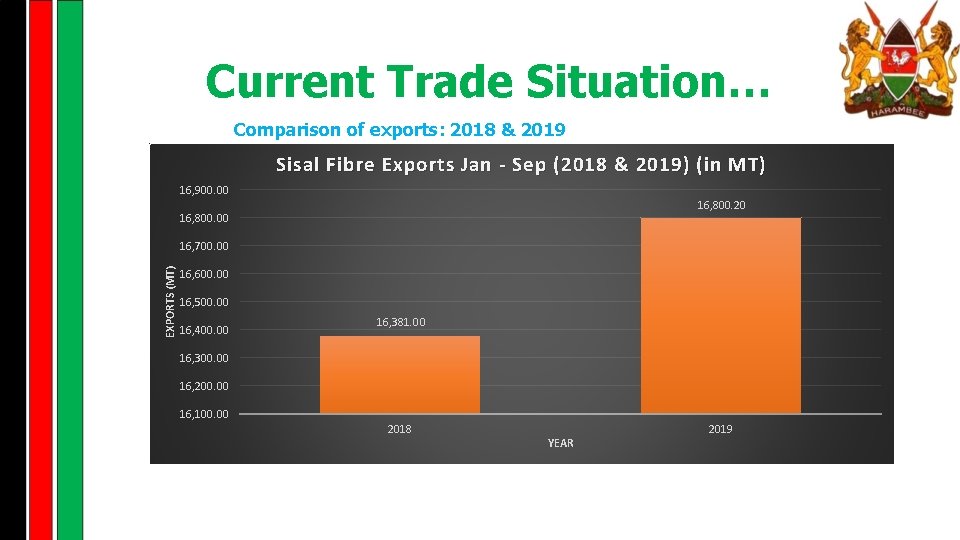
Current Trade Situation… Comparison of exports: 2018 & 2019 Sisal Fibre Exports Jan - Sep (2018 & 2019) (in MT) 16, 900. 00 16, 800. 20 16, 800. 00 EXPORTS (MT) 16, 700. 00 16, 600. 00 16, 500. 00 16, 400. 00 16, 381. 00 16, 300. 00 16, 200. 00 16, 100. 00 2018 YEAR 2019
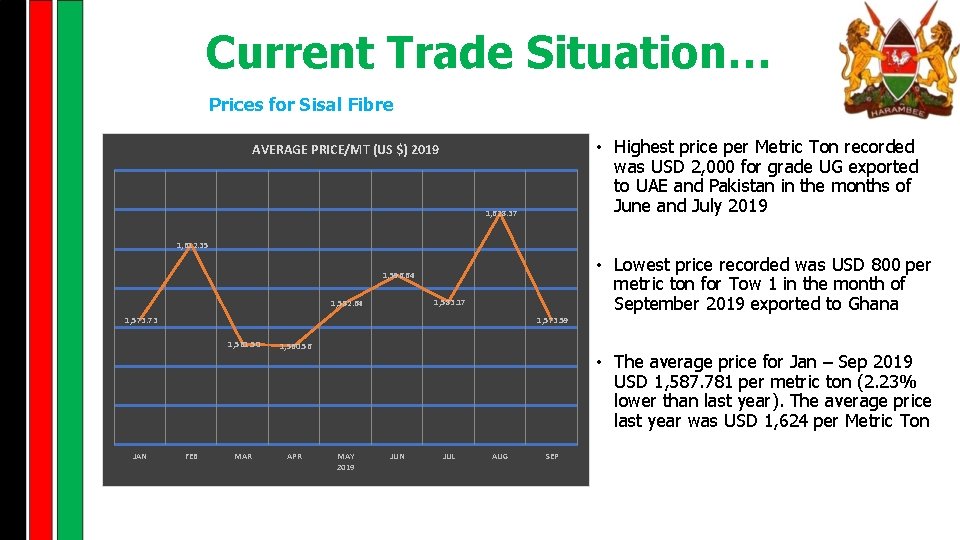
Current Trade Situation… Prices for Sisal Fibre • Highest price per Metric Ton recorded was USD 2, 000 for grade UG exported to UAE and Pakistan in the months of June and July 2019 AVERAGE PRICE/MT (US $) 2019 1, 628. 37 1, 612. 35 • Lowest price recorded was USD 800 per metric ton for Tow 1 in the month of September 2019 exported to Ghana 1, 596. 64 1, 583. 17 1, 582. 64 1, 573. 73 1, 573. 59 1, 561. 50 JAN FEB MAR 1, 560. 56 APR • The average price for Jan – Sep 2019 USD 1, 587. 781 per metric ton (2. 23% lower than last year). The average price last year was USD 1, 624 per Metric Ton MAY 2019 JUN JUL AUG SEP
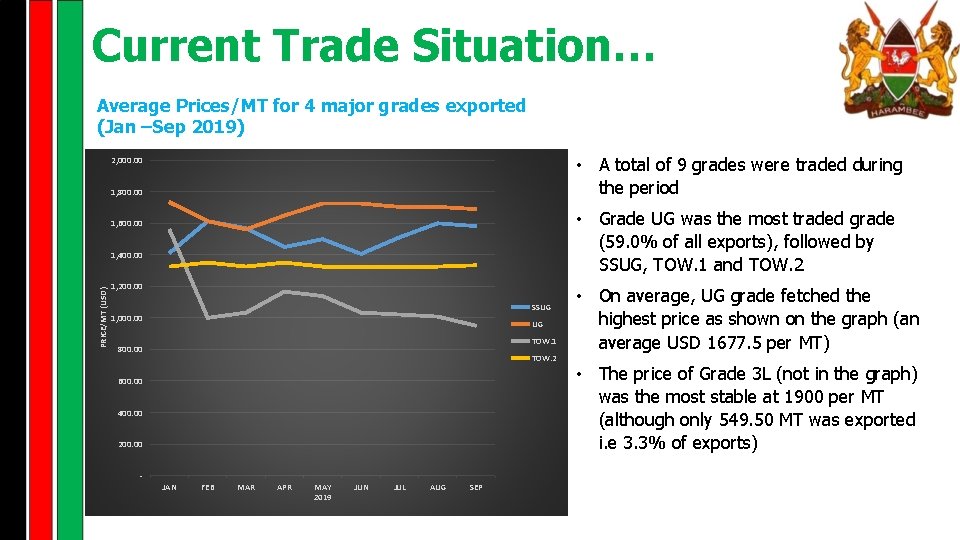
Current Trade Situation… Average Prices/MT for 4 major grades exported (Jan –Sep 2019) • A total of 9 grades were traded during the period 2, 000. 00 1, 800. 00 • Grade UG was the most traded grade (59. 0% of all exports), followed by SSUG, TOW. 1 and TOW. 2 1, 600. 00 PRICE/MT (USD) 1, 400. 00 1, 200. 00 SSUG 1, 000. 00 UG TOW. 1 800. 00 TOW. 2 600. 00 400. 00 200. 00 - JAN FEB MAR APR MAY 2019 JUN JUL AUG SEP • On average, UG grade fetched the highest price as shown on the graph (an average USD 1677. 5 per MT) • The price of Grade 3 L (not in the graph) was the most stable at 1900 per MT (although only 549. 50 MT was exported i. e 3. 3% of exports)
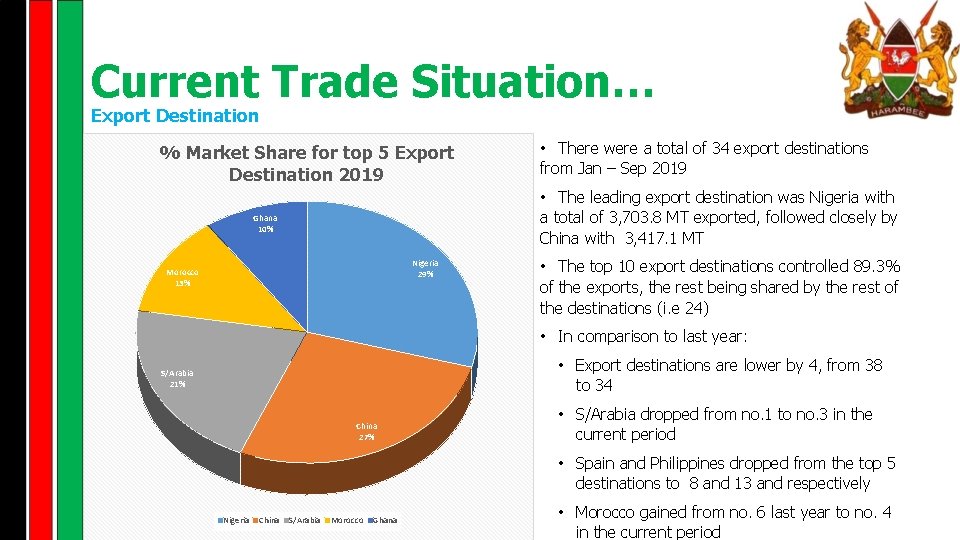
Current Trade Situation… Export Destination % Market Share for top 5 Export Destination 2019 • There were a total of 34 export destinations from Jan – Sep 2019 • The leading export destination was Nigeria with a total of 3, 703. 8 MT exported, followed closely by China with 3, 417. 1 MT Ghana 10% Nigeria 29% Morocco 13% • The top 10 export destinations controlled 89. 3% of the exports, the rest being shared by the rest of the destinations (i. e 24) • In comparison to last year: • Export destinations are lower by 4, from 38 to 34 S/Arabia 21% China 27% • S/Arabia dropped from no. 1 to no. 3 in the current period • Spain and Philippines dropped from the top 5 destinations to 8 and 13 and respectively Nigeria China S/Arabia Morocco Ghana • Morocco gained from no. 6 last year to no. 4 in the current period

- Slides: 8