CHAPTER 5 Modeling and Analysis 1 Modeling and


 n Key element in most DSS n Necessity in")

 環境分析 確認變數 預測 多模式組合 模式分類與選擇 (Table")
 n 靜態 Analysis – Single snapshot n 動態")
 n 確定性狀況 n 不確定壯況 n 風險性(機率) Decision")
 n n n Graphical representations of a model Model of")

")
 (Courtesy of Lumina Decision Systems, Los Altos,")
 (Courtesy of Lumina Decision Systems, Los Altos,")
 n n n Spreadsheet: most popular end-user modeling tool")

(p 178) Single Goal Situations n")


")

 n 悲觀準則(小中取大) Decision Support Systems and Intelligent Systems, Efraim Turban")
 n Risk analysis: compute expected")


 n Linear programming (LP) Used extensively in DSS")


 BUDGET) MARKET 1) MARKET 2) SLACK OR SURPLUS. 000000 1666667. 000000 233.")


")
 Solution Report >> Global optimal solution found at step: Objective value:")
 LABOR, CC 8) BUDGET,")


- Slides: 58
CHAPTER 5 Modeling and Analysis 1
Modeling and Analysis n n n Major DSS component Model base and model management CAUTION - Difficult Topic Ahead – – Familiarity with major ideas Basic concepts and definitions Tool--influence diagram Model directly in spreadsheets Decision Support Systems and Intelligent Systems, Efraim Turban and Jay E. Aronson, 6 th edition Copyright 2001, Prentice Hall, Upper Saddle River, NJ 2
Modeling and Analysis n Structure of some successful models and methodologies – – – 決策分析 決策樹 最佳化方法 啟發式方法 模擬 n New developments in modeling tools / techniques n Important issues in model base management Decision Support Systems and Intelligent Systems, Efraim Turban and Jay E. Aronson, 6 th edition Copyright 2001, Prentice Hall, Upper Saddle River, NJ 3
Modeling and Analysis Topics n n n n Modeling for MSS Static and dynamic models Treating certainty, uncertainty, and risk Influence diagrams MSS modeling in spreadsheets Decision analysis of a few alternatives (decision tables and trees) Optimization via mathematical programming Heuristic programming Simulation Multidimensional modeling -OLAP Visual interactive modeling and visual interactive simulation Quantitative software packages - OLAP Model base management Decision Support Systems and Intelligent Systems, Efraim Turban and Jay E. Aronson, 6 th edition Copyright 2001, Prentice Hall, Upper Saddle River, NJ 4
Modeling for MSS (p 167) n Key element in most DSS n Necessity in a model-based DSS n Can lead to massive cost reduction / revenue increases Decision Support Systems and Intelligent Systems, Efraim Turban and Jay E. Aronson, 6 th edition Copyright 2001, Prentice Hall, Upper Saddle River, NJ 5
Good Examples of MSS Models n n Du. Pont rail system simulation model (opening vignette) Procter & Gamble optimization supply chain restructuring models (case application 5. 1) Scott Homes AHP select a supplier model (case application 5. 2) IMERYS optimization clay production model (case application 5. 3) Decision Support Systems and Intelligent Systems, Efraim Turban and Jay E. Aronson, 6 th edition Copyright 2001, Prentice Hall, Upper Saddle River, NJ 6
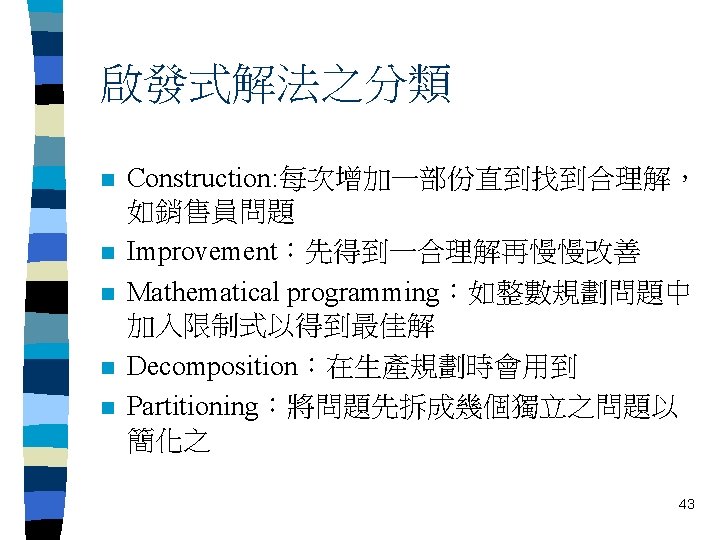
Major Modeling Issues n n n n 問題指認(確認問題) 環境分析 確認變數 預測 多模式組合 模式分類與選擇 (Table 5. 1) 模式管理 Knowledge-based modeling Decision Support Systems and Intelligent Systems, Efraim Turban and Jay E. Aronson, 6 th edition Copyright 2001, Prentice Hall, Upper Saddle River, NJ 7
Static and Dynamic Models (p 170) n 靜態 Analysis – Single snapshot n 動態 Analysis – Dynamic models – Evaluate scenarios that change over time – Time dependent – Trends and patterns over time – Extend static models Decision Support Systems and Intelligent Systems, Efraim Turban and Jay E. Aronson, 6 th edition Copyright 2001, Prentice Hall, Upper Saddle River, NJ 8
Treating Certainty, Uncertainty, and Risk (p 171) n 確定性狀況 n 不確定壯況 n 風險性(機率) Decision Support Systems and Intelligent Systems, Efraim Turban and Jay E. Aronson, 6 th edition Copyright 2001, Prentice Hall, Upper Saddle River, NJ 9
Influence Diagrams (p 172) n n n Graphical representations of a model Model of a model Visual communication Some packages create and solve the mathematical model Framework for expressing MSS model relationships Rectangle = a decision variable Circle = uncontrollable or intermediate variable Oval = result (outcome) variable: intermediate or final Variables connected with arrows Example (Figure 5. 1) Decision Support Systems and Intelligent Systems, Efraim Turban and Jay E. Aronson, 6 th edition Copyright 2001, Prentice Hall, Upper Saddle River, NJ 10
Decision Support Systems and Intelligent Systems, Efraim Turban and Jay E. Aronson, 6 th edition Copyright 2001, Prentice Hall, Upper Saddle River, NJ 11
Analytica Influence Diagram of a Marketing Problem: The Marketing Model (Figure 5. 2 a) (Courtesy of Lumina Decision Systems, Los Altos, CA) Decision Support Systems and Intelligent Systems, Efraim Turban and Jay E. Aronson, 6 th edition Copyright 2001, Prentice Hall, Upper Saddle River, NJ 12
Analytica: Price Submodel (Figure 5. 2 b) (Courtesy of Lumina Decision Systems, Los Altos, CA) Decision Support Systems and Intelligent Systems, Efraim Turban and Jay E. Aronson, 6 th edition Copyright 2001, Prentice Hall, Upper Saddle River, NJ 13
Analytica: Sales Submodel (Figure 5. 2 c) (Courtesy of Lumina Decision Systems, Los Altos, CA) Decision Support Systems and Intelligent Systems, Efraim Turban and Jay E. Aronson, 6 th edition Copyright 2001, Prentice Hall, Upper Saddle River, NJ 14
MSS Modeling in Spreadsheets(p 176) n n n Spreadsheet: most popular end-user modeling tool Powerful functions Add-in functions and solvers Important for analysis, planning, modeling Programmability (macros) (More) Decision Support Systems and Intelligent Systems, Efraim Turban and Jay E. Aronson, 6 th edition Copyright 2001, Prentice Hall, Upper Saddle River, NJ 15
n n n What-if analysis Goal seeking Simple database management Seamless integration Microsoft Excel Lotus 1 -2 -3 n Excel spreadsheet static model example of a simple loan calculation of monthly payments (Figure 5. 3) n Excel spreadsheet dynamic model example of a simple loan calculation of monthly payments and effects of prepayment (Figure 5. 4) Decision Support Systems and Intelligent Systems, Efraim Turban and Jay E. Aronson, 6 th edition Copyright 2001, Prentice Hall, Upper Saddle River, NJ 16
Decision Analysis of Few Alternatives (Decision Tables and Trees)(p 178) Single Goal Situations n Decision tables n Decision trees Decision Support Systems and Intelligent Systems, Efraim Turban and Jay E. Aronson, 6 th edition Copyright 2001, Prentice Hall, Upper Saddle River, NJ 17
Decision Tables n Investment example n One goal: maximize the yield after one year n Yield depends on the status of the economy (the state of nature) – Solid growth – Stagnation – Inflation Decision Support Systems and Intelligent Systems, Efraim Turban and Jay E. Aronson, 6 th edition Copyright 2001, Prentice Hall, Upper Saddle River, NJ 18
Possible Situations 1. If solid growth in the economy, bonds yield 12%; stocks 15%; time deposits 6. 5% 2. If stagnation, bonds yield 6%; stocks 3%; time deposits 6. 5% 3. If inflation, bonds yield 3%; stocks lose 2%; time deposits yield 6. 5% Decision Support Systems and Intelligent Systems, Efraim Turban and Jay E. Aronson, 6 th edition Copyright 2001, Prentice Hall, Upper Saddle River, NJ 19
View Problem as a Two-Person Game Payoff Table 5. 2 n Decision variables (alternatives) n Uncontrollable variables (states of economy) n Result variables (projected yield) Decision Support Systems and Intelligent Systems, Efraim Turban and Jay E. Aronson, 6 th edition Copyright 2001, Prentice Hall, Upper Saddle River, NJ 20
Table 5. 2: Investment Problem Decision Table Model States of Nature Solid Stagnation Inflation Alternatives Growth Bonds 12% 6% 3% Stocks 15% 3% -2% CDs 6. 5% Decision Support Systems and Intelligent Systems, Efraim Turban and Jay E. Aronson, 6 th edition Copyright 2001, Prentice Hall, Upper Saddle River, NJ 21
Treating Uncertainty n 樂觀準則(大中取大) n 悲觀準則(小中取大) Decision Support Systems and Intelligent Systems, Efraim Turban and Jay E. Aronson, 6 th edition Copyright 2001, Prentice Hall, Upper Saddle River, NJ 22
Treating Risk n Use known probabilities (Table 5. 3) n Risk analysis: compute expected values n Can be dangerous Decision Support Systems and Intelligent Systems, Efraim Turban and Jay E. Aronson, 6 th edition Copyright 2001, Prentice Hall, Upper Saddle River, NJ 23
Table 5. 3: Decision Under Risk and Its Solution Solid Stagnation Growth Inflation Expected Value Alternatives . 5 . 3 . 2 Bonds 12% 6% 3% Stocks 15% 3% -2% 8. 0% CDs 6. 5% Decision Support Systems and Intelligent Systems, Efraim Turban and Jay E. Aronson, 6 th edition Copyright 2001, Prentice Hall, Upper Saddle River, NJ 8. 4% * 24
n Decision Trees n Other methods of treating risk – Simulation – Certainty factors – Fuzzy logic n Multiple goals n Yield, safety, and liquidity (Table 5. 4) Decision Support Systems and Intelligent Systems, Efraim Turban and Jay E. Aronson, 6 th edition Copyright 2001, Prentice Hall, Upper Saddle River, NJ 25
Table 5. 4: Multiple Goals Alternatives Yield Safety Liquidity Bonds 8. 4% High Stocks 8. 0% Low High CDs 6. 5% Very High Decision Support Systems and Intelligent Systems, Efraim Turban and Jay E. Aronson, 6 th edition Copyright 2001, Prentice Hall, Upper Saddle River, NJ 26
Optimization via Mathematical Programming (p 182) n Linear programming (LP) Used extensively in DSS n Mathematical Programming Family of tools to solve managerial problems in allocating scarce resources among various activities to optimize a measurable goal Decision Support Systems and Intelligent Systems, Efraim Turban and Jay E. Aronson, 6 th edition Copyright 2001, Prentice Hall, Upper Saddle River, NJ 27
LP Allocation Problem Characteristics 1. Limited quantity of economic resources 2. Resources are used in the production of products or services 3. Two or more ways (solutions, programs) to use the resources 4. Each activity (product or service) yields a return in terms of the goal 5. Allocation is usually restricted by constraints Decision Support Systems and Intelligent Systems, Efraim Turban and Jay E. Aronson, 6 th edition Copyright 2001, Prentice Hall, Upper Saddle River, NJ 28
LP Allocation Model n Rational economic assumptions 1. Returns from allocations can be compared in a common unit 2. Independent returns 3. Total return is the sum of different activities’ returns 4. All data are known with certainty 5. The resources are to be used in the most economical manner n Optimal solution: the best, found algorithmically Decision Support Systems and Intelligent Systems, Efraim Turban and Jay E. Aronson, 6 th edition Copyright 2001, Prentice Hall, Upper Saddle River, NJ 29
Linear Programming n n n Line Decision variables Objective function coefficients Constraints Capacities Input-output (technology) coefficients Decision Support Systems and Intelligent Systems, Efraim Turban and Jay E. Aronson, 6 th edition Copyright 2001, Prentice Hall, Upper Saddle River, NJ 30
Lindo LP Product-Mix Model DSS in Focus 5. 4 << The Lindo Model: >> MAX 8000 X 1 + 12000 X 2 SUBJECT TO LABOR) 300 X 1 + 500 X 2 <= 200000 BUDGET) 10000 X 1 + 15000 X 2 <= 8000000 MARKET 1) X 1 >= 100 MARKET 2) X 2 >= 200 END Decision Support Systems and Intelligent Systems, Efraim Turban and Jay E. Aronson, 6 th edition Copyright 2001, Prentice Hall, Upper Saddle River, NJ 31
<< Generated Solution Report >> LP OPTIMUM FOUND AT STEP 3 OBJECTIVE FUNCTION VALUE 1) VARIABLE X 1 X 2 5066667. 00 VALUE 333300 200. 000000 REDUCED COST. 000000 Decision Support Systems and Intelligent Systems, Efraim Turban and Jay E. Aronson, 6 th edition Copyright 2001, Prentice Hall, Upper Saddle River, NJ 32
ROW LABOR) BUDGET) MARKET 1) MARKET 2) SLACK OR SURPLUS. 000000 1666667. 000000 233. 333300. 000000 NO. ITERATIONS= DUAL PRICES 26. 666670. 000000 -1333. 333000 3 Decision Support Systems and Intelligent Systems, Efraim Turban and Jay E. Aronson, 6 th edition Copyright 2001, Prentice Hall, Upper Saddle River, NJ 33
RANGES IN WHICH THE BASIS IS UNCHANGED: VARIABLE X 1 X 2 OBJ COEFFICIENT RANGES CURRENT ALLOWABLE COEF INCREASE DECREASE 8000. 000 INFINITY 799. 9998 12000. 000 1333. 333 INFINITY RIGHTHAND SIDE RANGES ROW CURRENT RHS LABOR 200000. 000 BUDGET 8000000. 000 MARKET 1 100. 000 MARKET 2 200. 000 ALLOWABLE INCREASE 50000. 000 INFINITY 233. 333 140. 000 ALLOWABLE DECREASE 70000. 000 1666667. 000 INFINITY 200. 000 Decision Support Systems and Intelligent Systems, Efraim Turban and Jay E. Aronson, 6 th edition Copyright 2001, Prentice Hall, Upper Saddle River, NJ 34
Lingo LP Product-Mix Model DSS in Focus 5. 5 << The Model >>> MODEL: ! The Product-Mix Example; SETS: COMPUTERS /CC 7, CC 8/ : PROFIT, QUANTITY, MARKETLIM ; RESOURCES /LABOR, BUDGET/ : AVAILABLE ; RESBYCOMP(RESOURCES, COMPUTERS) : UNITCONSUMPTION ; ENDSETS DATA: PROFIT MARKETLIM = 8000, 12000, 200; AVAILABLE = 200000, 8000000 ; Decision Support Systems and Intelligent Systems, Efraim Turban and Jay E. Aronson, 6 th edition Copyright 2001, Prentice Hall, Upper Saddle River, NJ 35
UNITCONSUMPTION = 300, 500, 10000, 15000 ; ENDDATA MAX = @SUM(COMPUTERS: PROFIT * QUANTITY) ; @FOR( RESOURCES( I): @SUM( COMPUTERS( J): UNITCONSUMPTION( I, J) * QUANTITY(J)) <= AVAILABLE( I)); @FOR( COMPUTERS( J): QUANTITY(J) >= MARKETLIM( J)); ! Alternative @FOR( COMPUTERS( J): @BND(MARKETLIM(J), QUANTITY(J), 1000000)); Decision Support Systems and Intelligent Systems, Efraim Turban and Jay E. Aronson, 6 th edition Copyright 2001, Prentice Hall, Upper Saddle River, NJ 36
<< (Partial ) Solution Report >> Global optimal solution found at step: Objective value: 5066667. Variable PROFIT( CC 7) PROFIT( CC 8) QUANTITY( CC 7) QUANTITY( CC 8) MARKETLIM( CC 7) MARKETLIM( CC 8) AVAILABLE( LABOR) AVAILABLE( BUDGET) Value 8000. 000 12000. 00 3333 200. 0000 100. 0000 200000. 0 8000000. 2 Reduced Cost 0. 0000 0. 0000 Decision Support Systems and Intelligent Systems, Efraim Turban and Jay E. Aronson, 6 th edition Copyright 2001, Prentice Hall, Upper Saddle River, NJ 37
UNITCONSUMPTION( Row 1 2 3 4 5 LABOR, CC 7) LABOR, CC 8) BUDGET, CC 7) BUDGET, CC 8) Slack or Surplus 5066667. 0. 0000000 1666667. 233. 3333 0. 0000000 300. 00 500. 00 10000. 15000. 0. 00 Dual Price 1. 000000 26. 66667 0. 0000000 -1333. 333 Decision Support Systems and Intelligent Systems, Efraim Turban and Jay E. Aronson, 6 th edition Copyright 2001, Prentice Hall, Upper Saddle River, NJ 38
Generated Image of Traffic at an Intersection from the Orca Visual Simulation Environment (Figure 5. 7) (Courtesy Orca Computer, Inc. ) Decision Support Systems and Intelligent Systems, Efraim Turban and Jay E. Aronson, 6 th edition Copyright 2001, Prentice Hall, Upper Saddle River, NJ 53