August 2018 IU DSTUG Meeting August 28 2018


 – Section 508 Americans with")

 Developed by the World Wide Web Consortium (W 3")


 The visual presentation of text")


- Slides: 65
August 2018 IU DSTUG Meeting August 28, 2018 Please add your name to the DSTUG mailing list. Send a blank email from your IU email address to: dstug-l-subscribe@indiana. edu
Agenda for Today I. III. IV. V. Welcome Quick Poll: Tableau Conference 2018 General Announcements Poll Results Report Accessibility A. Creating Accessible Dashboards in Tableau: Kyle Gupton, Director of Product Management at Tableau Software B. General Discussion on Report Accessibility at IU: Moderated by Cheryl Stine VI. Working Group Updates VII. Questions
Welcome
Keep Informed Please add your name to the DSTUG mailing list. Send a blank email from your IU email address to: dstug-l-subscribe@indiana. edu
Report Accessibility
Creating Accessible Dashboards in Tableau Kyle Gupton, Director of Product Management at Tableau Software
Creating Accessible Dashboards with Tableau Kyle Gupton Director of Product Management Tableau Software
Agenda Accessibility Basics Web Accessibility Standards Creating Accessible Dashboards Case Study Demo
Accessibility Basics Accessibility is the usability of a system by people with disabilities. Each type of disability requires a different type of accommodation in the system. Different degrees of impairment require different levels of accommodation. Assistive technologies (AT) are mechanisms for making computer systems accessible.
Assistive Technologies – Limited Movement
Assistive Technologies – Vision Impairments
Vision Impairments Vision impairments exist on a wide scale. Some impairments are very common (red-green colorblindness in males); others are quite rare. But wait, isn’t Tableau a visual product?
Simulation of Visual Impairments – No Simulation
Simulation of Visual Impairments – Deuteranopia Simulation
Simulation of Visual Impairments – Achromatopsia
Simulation of Visual Impairments – Contrast Sensitivity Loss
Simulation of Visual Impairments – Low Vision
Simulation of Visual Impairments – Complete Blindness
Vision Impairments and Tableau Our mission is to help people see and understand data. Tableau leverages our most powerful sense, vision, to help us understand data. Accessible Tableau content will help more people with vision impairments benefit from Tableau AND provide access to the same information to everyone.
Accessibility Laws and Regulations Rehabilitation Act of 1973 (USA) – Section 508 Americans with Disabilities Act (USA) Equality Act 2010 (UK) Mandate 376 (European Union) – EN 301 549
Why Care About Accessibility? You care about helping people with disabilities. You want to reach the largest possible audience. Many accessibility practices are also good usability practices. Your organization may have its own requirements. It may be the law.
Web Content Accessibility Guidelines (WCAG) Developed by the World Wide Web Consortium (W 3 C). Recommendations for making Web content more accessible. Establish technical standards for how web content and Assistive Technologies (AT) interact. Section 508 adopted the WCAG for web content beginning January 2018.
WCAG 2. 0 Principles and Guidelines Perceivable Information and user interface components must be presentable to users in ways they can perceive. Operable User interface components and navigation must be operable.
WCAG 2. 0 Principles and Guidelines Understandable Information and the operation of user interface must be understandable. Robust Content must be robust enough that it can be interpreted reliably by a wide variety of user agents, including assistive technologies.
WCAG 2. 0 Levels A Minimum standard for accessibility. AA Most important level to target. Satisfies current laws. AAA Most stringent level of accessibility. Not broadly used as it imposes significant design constraints.
Use Only Accessible Dashboard Elements • Titles • View Data Window • Captions (when visible) • List and Dropdown List Filters • • • Categorical Legends Text Objects Web Page Objects Workbook Tabs Toolbar
Publish Dashboard and Embed in Accessible Web Page <script type='text/javascript' src='https: //10 az. online. tableau. com/javascripts/api/viz_v 1. js'></script> <div class='tableau. Placeholder' style='width: 1350 px; height: 997 px; ’> <object class='tableau. Viz' width='1350' height='997' style='display: none; ’> <param name='host_url' value='https%3 A%2 F%2 F 10 az. online. tableau. com%2 F' /> <param name='embed_code_version' value='3' /> <param name='site_root' value='/ t/ kylegupton' /> <param name='name' value='Authoring. Tableau. Contentfor. Accessibility. Demo/ SATPerformanceof. Admitted. Students' /> <param name='tabs' value='no' /> <param name='toolbar' value='no' /> <param name='show. App. Banner' value='false' /> <param name='filter' value='iframe. Sized. To. Window=true' /> </object> </div>
WCAG 2. 0 Level AA Guidelines for Tableau Authors Perceivable 1. 1 Text Alternatives 1. 3 Adaptable 1. 4 Distinguishable Operable 2. 4 Navigable Understandable 3. 3 Input Assistance
Guideline 1. 1 Text Alternatives 1. 1. 1 Non-text Content All non-text content that is presented to the user has a text alternative that serves the equivalent purposes. Best Practices • Use View Data page to get underlying data in a crosstab. • Provide textual description of visualization content in a caption or text zone in dashboard. Even default Captions can be useful. • Create HTML table of data external to dashboard.
Guideline 1. 3 Adaptable 1. 3. 1 Information and Relationships Information, structure, and relationships conveyed through presentation can be programmatically determined or are available in text. 1. 3. 3 Sensory Characteristics Instructions provided for understanding and operating content do not rely solely on sensory characteristics of components such as shape, size, visual location, orientation, or sound. Best Practices • Provide text explaining how various components of a visualization relate. • Keep instructions simple, clear, textual, and refer to controls by label. x ✓
Guideline 1. 4 Distinguishable 1. 4. 1 Use of Color is not used as the only visual means of conveying information, indicating an action, prompting a response, or distinguishing a visual element. Best Practices • Use color blind color palette for marks. • Ensure that there are ways to distinguish marks other than color: Add shapes to line marks, use begin/end caps or labels.
Guideline 1. 4 Distinguishable 1. 4. 3 Contrast (Minimum) The visual presentation of text and images of text has a contrast ratio of at least 4. 5: 1 (large text 3: 1). Best Practices • Use contrast analyzer tools to choose text colors and backgrounds with sufficient contrast ratios. Accessibility x ✓
Guideline 2. 4 Navigable 2. 4. 6 Headings and Labels Headings and labels describe topic or purpose. Best Practices • Ensure that visualizations, filters, and legends have titles that are clear and self explanatory.
Guideline 3. 3 Input Assistance 3. 3. 2 Labels or Instructions Labels or instructions are provided when content requires user input. Best Practices • Label controls (filters, highlighters, parameters) in a way that describes their purpose. • Provide instructions for using content in text zone on dashboard.
Simulation of Visual Impairments – No Simulation
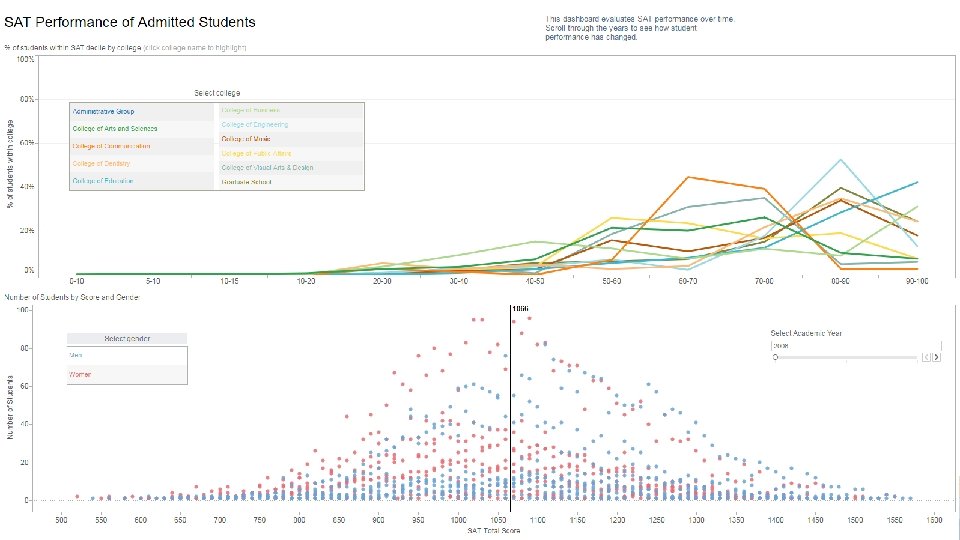
1. Marks are distinguishable only by color.
2. Contrast ratio for text is too low in some cases.
3. Insufficient or missing descriptions, instructions, and captions.
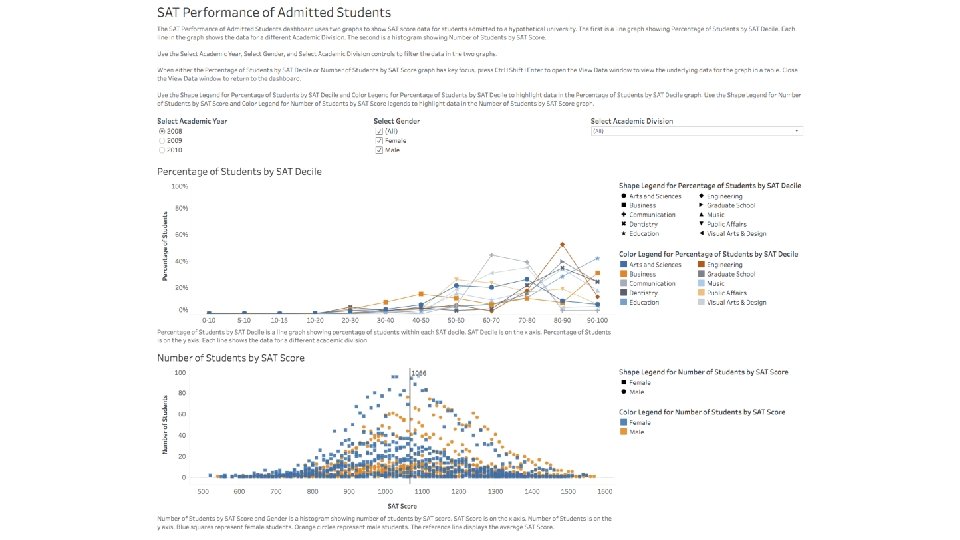
1. Used text color that meets minimum contrast guideline.
2. Used accessible filters.
3. Added descriptive text and instructions for dashboard.
4. Added descriptive captions for charts.
5. Titles for filters indicate function. Instructions refer to filters by name.
6. Titles for legends reference associated charts.
7. Used shape marks encoded with color.
8. Used Color Blind color palette for all marks.
9. Simplified text to remove redundancies.
References Standards and Laws • • • WCAG 2. 0 Section 508 Mandate 376 Tools and Tips • • • Build Data View for Accessibility Color Contrast Tips and Tools Colour Contrast Analyser Creating HTML Tables From Tableau Data Creating Custom Combined Legends
References Natural Language Generation • Automated Insights • Narrative Science • Yseop Assistive Technology • JAWS • NVDA • Voice. Over
Additional Accessibility Resources
Additional Resources • Tableau Accessibility Conformance Report Version 2018. 2 Embedded Views (from Kyle—saved to Box) • “Remember that the Tableau Public UI is not accessible, so this dashboard needs to be embedded in an accessible web page. You can see an example of this here, which is a page on Tableau’s accessibility consultant's web site” (from Kyle): https: //equalentry. com/tableau-accessibility-demo/ • “How to create and publish accessible dashboards with Tableau, ” a blog post written by Kyle Gupton. • Web. AIM Color Contrast Checker • WCAG Guidelines
General Discussion: Report Accessibility at IU Cheryl Stine, Moderator
Report Accessibility at IU: Guiding Questions PLEASE NOTE: This discussion was moved to the #tableauaccessibility channel in the DSTUG Slack Workspace. • What general guidelines are IU report developers following for accessibility? • Have developers focused more on public facing reports versus internal/restricted reports? • Are developers using disclaimers with contact information if a user has trouble accessing a report? • How are you delivering accessible reports currently?
How Do I Get Involved? • Join the DSTUG Mailing list. Send a blank email to dstug-lsubscribe@indiana. edu • Have an idea for a future meeting? Email Richard, Bob, and Ben. • Box Folder (Request to be added to folder): https: //iu. box. com/v/dstug • Join DSTUG on Slack (requires Box Folder access): DSTUG Slack Invitation • Blog: https: //blogs. iu. edu/dstug/