Advanced Developmental Psychology PSY 620 P Domains of
- Slides: 40
Advanced Developmental Psychology PSY 620 P
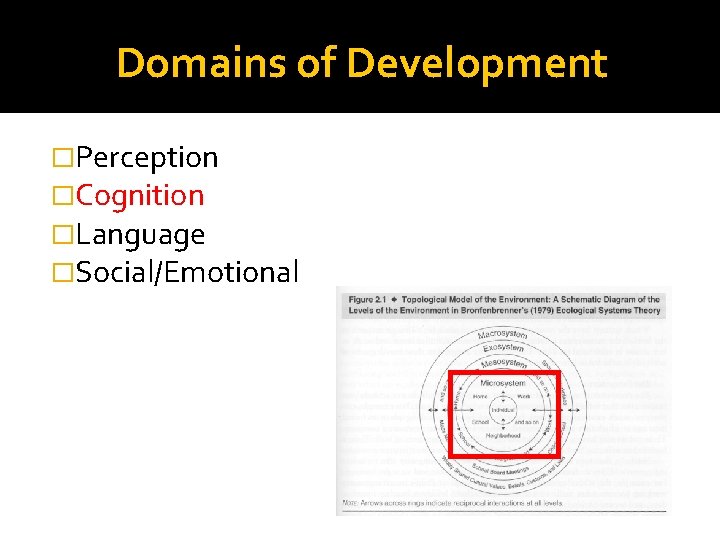
Domains of Development �Perception �Cognition �Language �Social/Emotional
Cognition � From ppt 11 (last time) Habituation (slides 47 -62) Piaget (slides 63 -82) � Brain networks and experience � Infant intelligence Assessments versus tests ACE � Genes (Tucker-Drob) in the USA � Genes (Tucker-Drob) in the world � Intervention Deprivation as the control Early intervention counts most ▪ Infant versus chimp intelligence structure
�Cognition and behavior results from interconnected structural and functional brain networks �Changing brain connectivity causes AND results from developmental changes in behavior
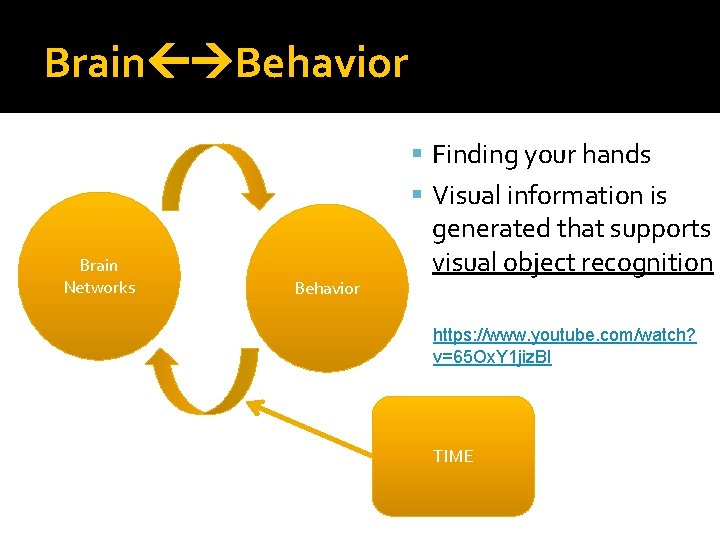
Brain Behavior Finding your hands Visual information is Brain Networks Behavior generated that supports visual object recognition https: //www. youtube. com/watch? v=65 Ox. Y 1 jiz. BI TIME
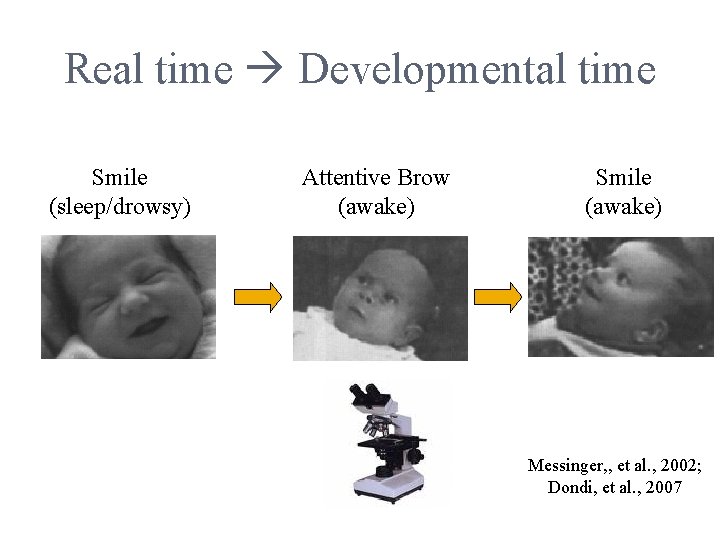
Real time Developmental time Smile (sleep/drowsy) Attentive Brow (awake) Smile (awake) Messinger, , et al. , 2002; Dondi, et al. , 2007
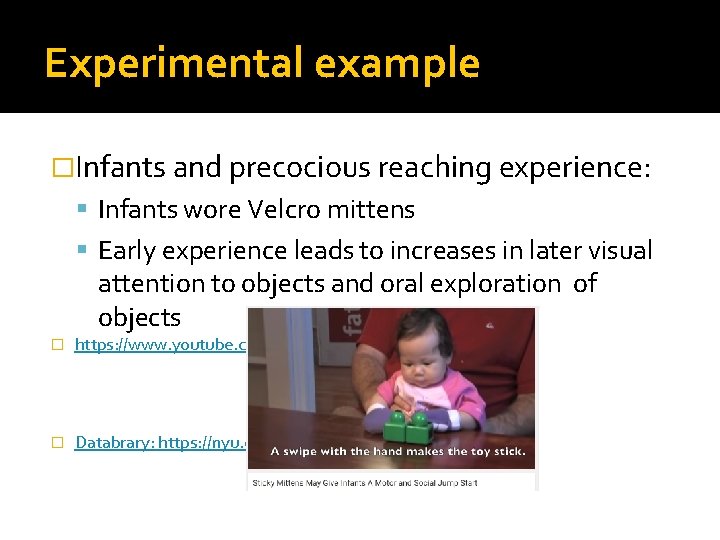
Experimental example �Infants and precocious reaching experience: Infants wore Velcro mittens Early experience leads to increases in later visual attention to objects and oral exploration of objects � https: //www. youtube. com/watch? v=h. JGRM 4 LFJj. U � Databrary: https: //nyu. databrary. org/search? q=mittens
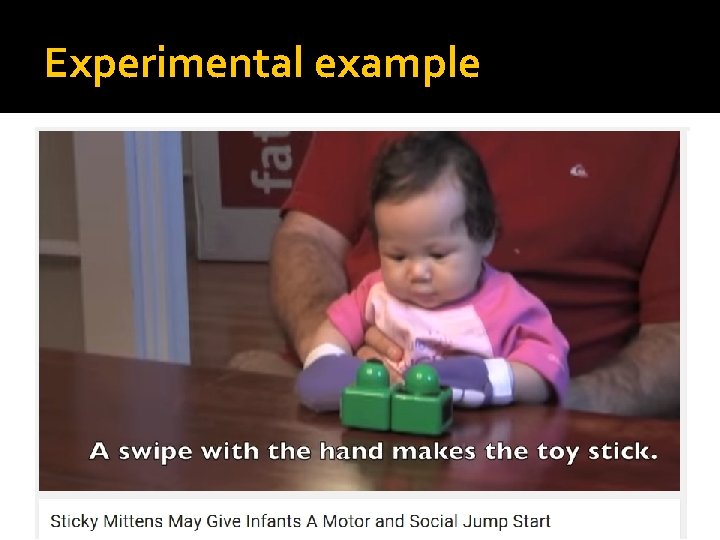
Experimental example �Infants and precocious reaching experience: Infants wore Velcro mittens Early experience leads to increases in later visual attention to objects and oral exploration of objects �https: //www. youtube. com/watch? v=h. JGRM 4 LFJj. U
Fagan Test of Infant Intelligence � Assesses cognitive development in infancy. � Composed of habituation-dishabituation items. “a “novelty score” -- amount of fixation during the test phase devoted to the novel picture ▪ divided by the total fixation time to both the novel and familiar picture. ” ▪ http: //infantest. com/ftii. pdf � Used for research studies—index of the relative level of functioning in group being studied Does not determine an individual child’s performance relative to children in the norming sample – like in the Bayley 17
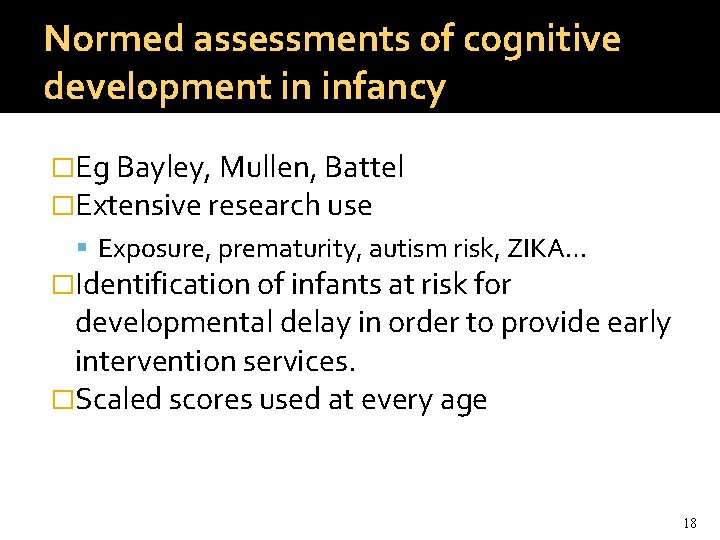
Normed assessments of cognitive development in infancy �Eg Bayley, Mullen, Battel �Extensive research use Exposure, prematurity, autism risk, ZIKA… �Identification of infants at risk for developmental delay in order to provide early intervention services. �Scaled scores used at every age 18
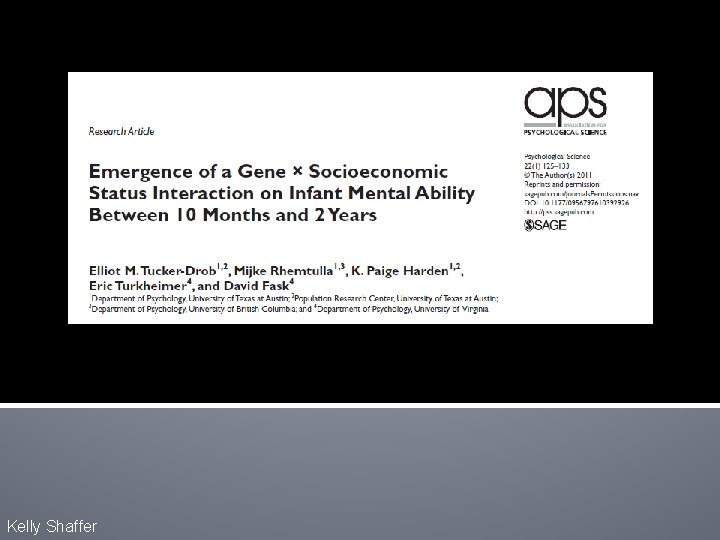
Kelly Shaffer
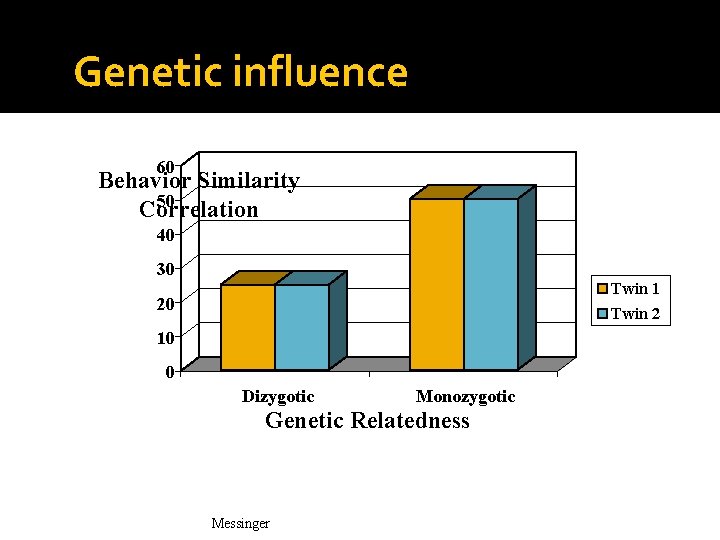
Genetic influence 60 Behavior Similarity 50 Correlation 40 30 Twin 1 20 Twin 2 10 0 Dizygotic Monozygotic Genetic Relatedness Messinger
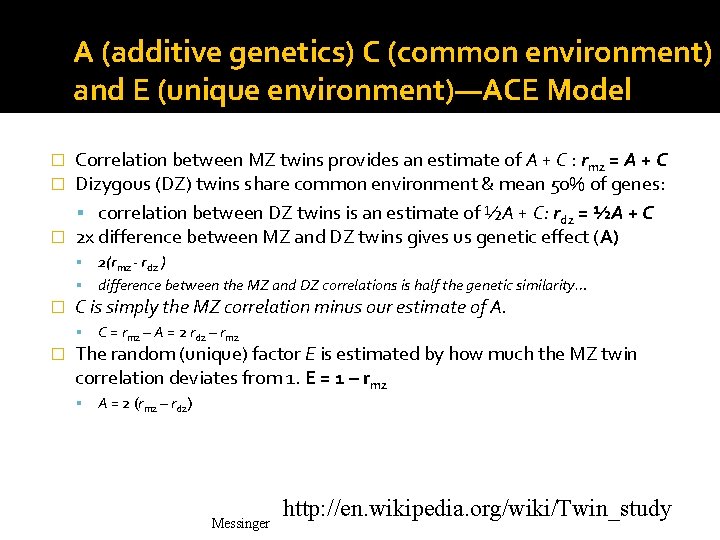
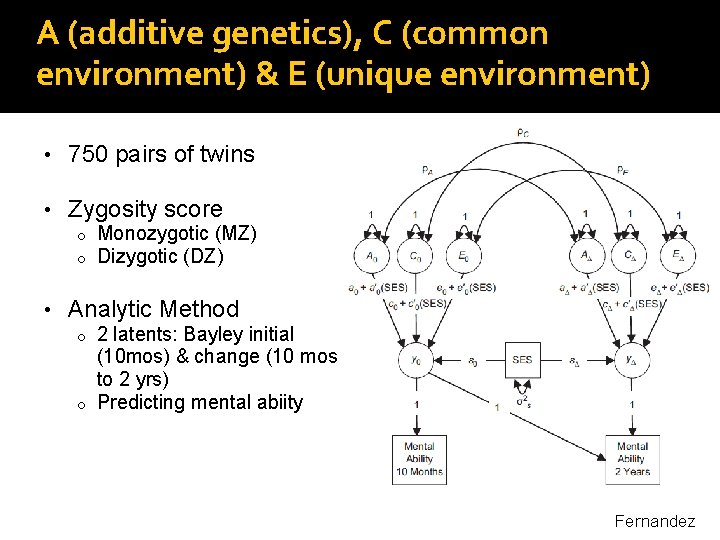
A (additive genetics) C (common environment) and E (unique environment)—ACE Model Correlation between MZ twins provides an estimate of A + C : rmz = A + C Dizygous (DZ) twins share common environment & mean 50% of genes: correlation between DZ twins is an estimate of ½A + C: rdz = ½A + C � 2 x difference between MZ and DZ twins gives us genetic effect (A) � � 2(rmz - rdz ) difference between the MZ and DZ correlations is half the genetic similarity… � C is simply the MZ correlation minus our estimate of A. C = rmz – A = 2 rdz – rmz � The random (unique) factor E is estimated by how much the MZ twin correlation deviates from 1. E = 1 – rmz A = 2 (rmz – rdz) Messinger http: //en. wikipedia. org/wiki/Twin_study
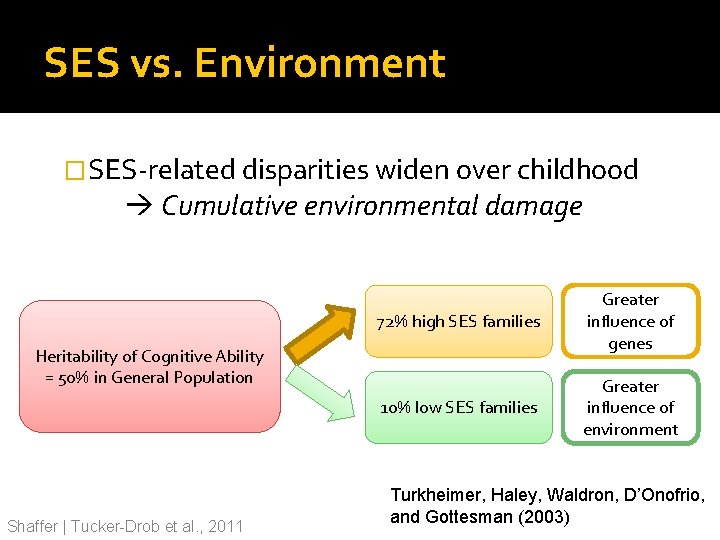
SES vs. Environment �SES-related disparities widen over childhood Cumulative environmental damage 72% high SES families Greater influence of genes 10% low SES families Greater influence of environment Heritability of Cognitive Ability = 50% in General Population Shaffer | Tucker-Drob et al. , 2011 Turkheimer, Haley, Waldron, D’Onofrio, and Gottesman (2003)
A (additive genetics), C (common environment) & E (unique environment) • 750 pairs of twins • Zygosity score o o Monozygotic (MZ) Dizygotic (DZ) • Analytic Method 2 latents: Bayley initial (10 mos) & change (10 mos to 2 yrs) o Predicting mental abiity o Fernandez
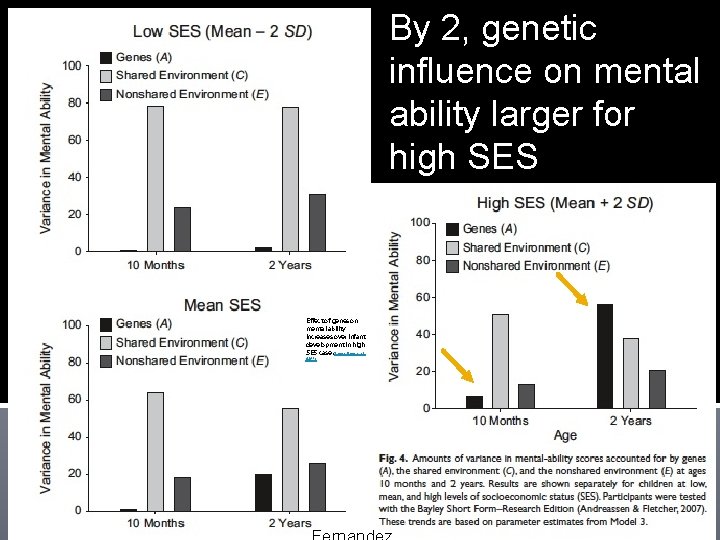
By 2, genetic influence on mental ability larger for high SES Effect of genes on mental ability increases over infant development in high SES case (Tucker-Drob, et al. . (2011)
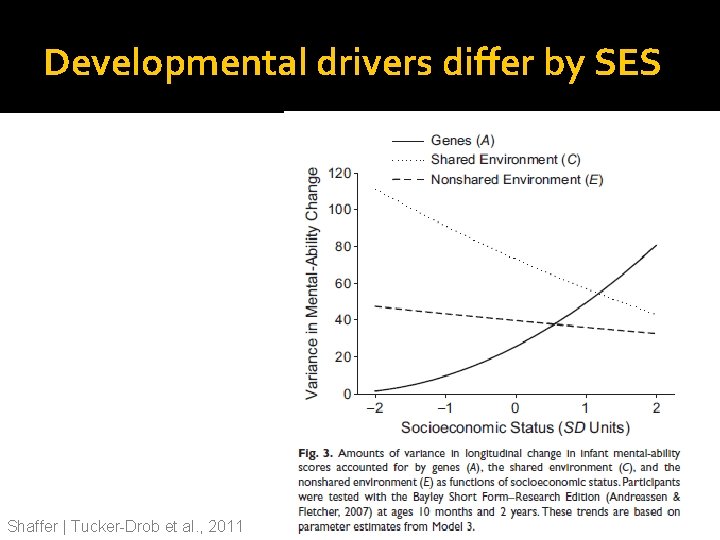
Developmental drivers differ by SES Shaffer | Tucker-Drob et al. , 2011
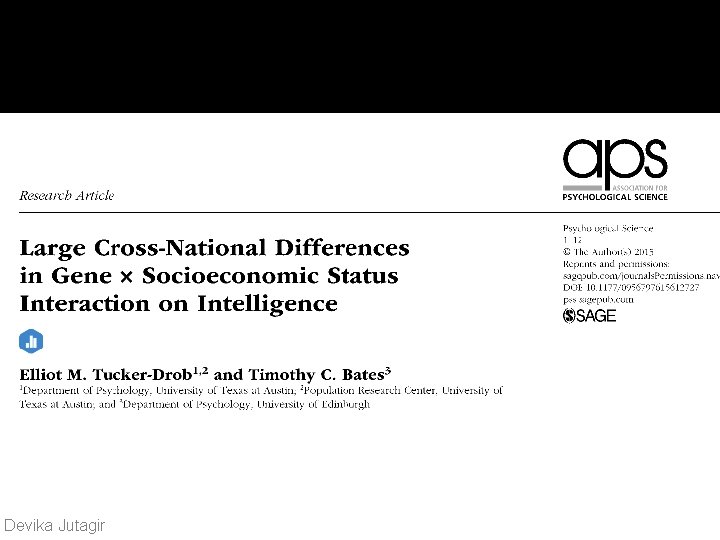
Devika Jutagir
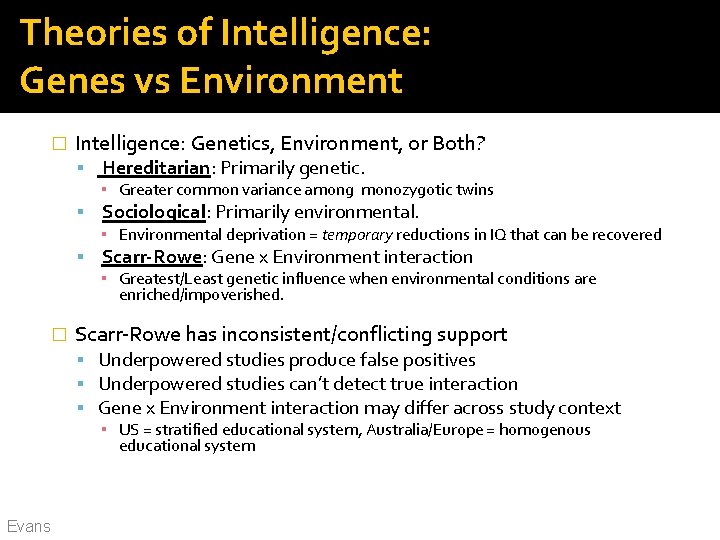
Theories of Intelligence: Genes vs Environment � Intelligence: Genetics, Environment, or Both? Hereditarian: Primarily genetic. ▪ Greater common variance among monozygotic twins Sociological: Primarily environmental. ▪ Environmental deprivation = temporary reductions in IQ that can be recovered Scarr-Rowe: Gene x Environment interaction ▪ Greatest/Least genetic influence when environmental conditions are enriched/impoverished. � Scarr-Rowe has inconsistent/conflicting support Underpowered studies produce false positives Underpowered studies can’t detect true interaction Gene x Environment interaction may differ across study context ▪ US = stratified educational system, Australia/Europe = homogenous educational system Evans
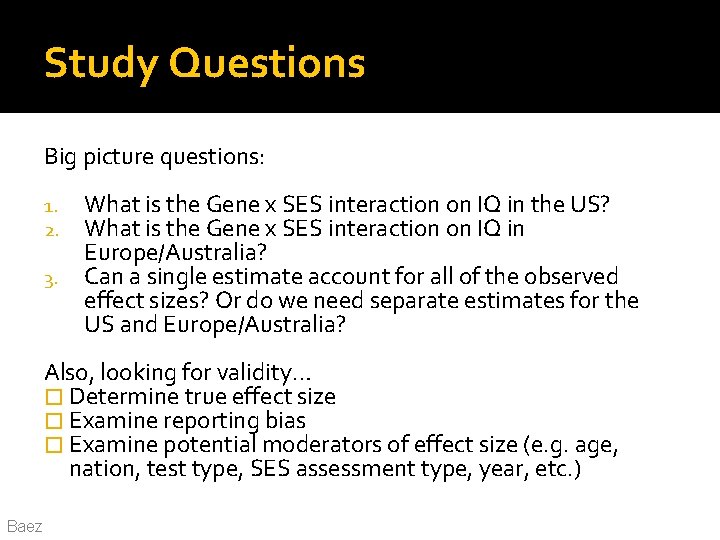
Study Questions Big picture questions: 1. 2. 3. What is the Gene x SES interaction on IQ in the US? What is the Gene x SES interaction on IQ in Europe/Australia? Can a single estimate account for all of the observed effect sizes? Or do we need separate estimates for the US and Europe/Australia? Also, looking for validity… � Determine true effect size � Examine reporting bias � Examine potential moderators of effect size (e. g. age, nation, test type, SES assessment type, year, etc. ) Baez
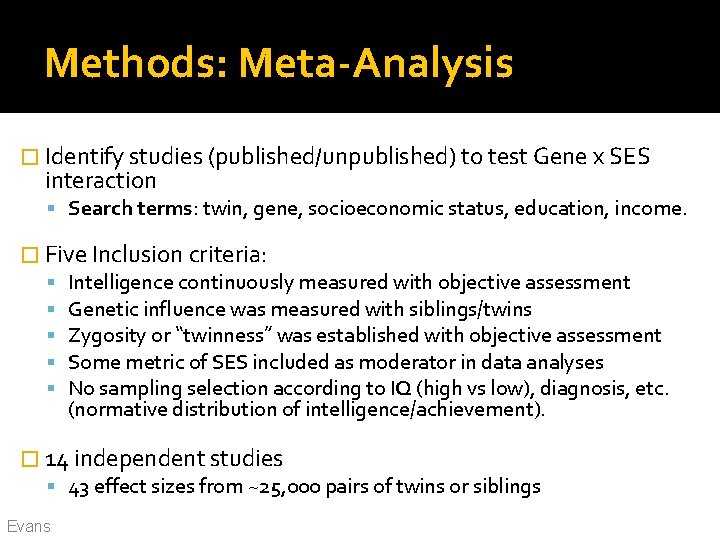
Methods: Meta-Analysis � Identify studies (published/unpublished) to test Gene x SES interaction Search terms: twin, gene, socioeconomic status, education, income. � Five Inclusion criteria: Intelligence continuously measured with objective assessment Genetic influence was measured with siblings/twins Zygosity or “twinness” was established with objective assessment Some metric of SES included as moderator in data analyses No sampling selection according to IQ (high vs low), diagnosis, etc. (normative distribution of intelligence/achievement). � 14 independent studies 43 effect sizes from ~25, 000 pairs of twins or siblings Evans
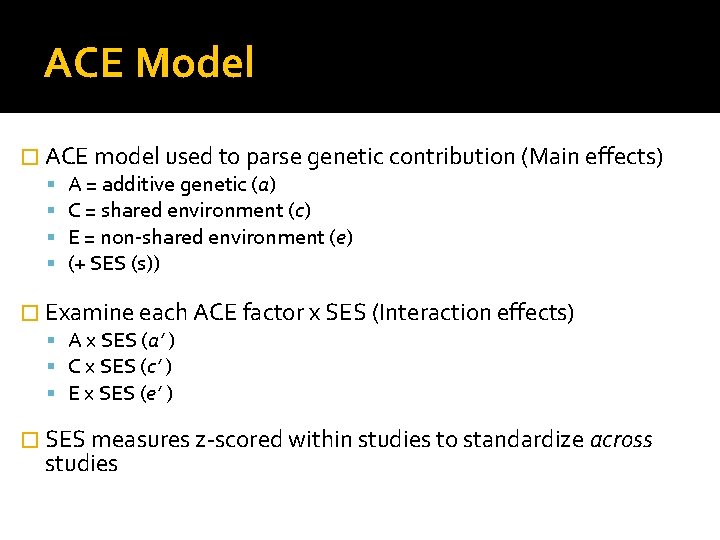
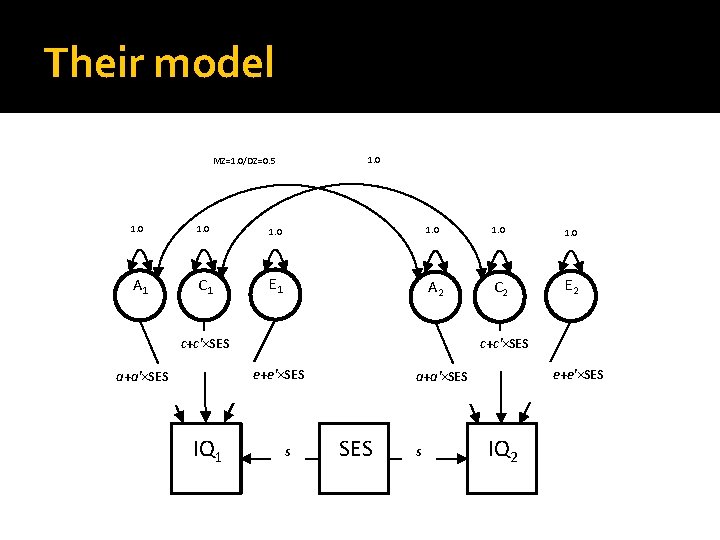
ACE Model � ACE model used to parse genetic contribution (Main effects) A = additive genetic (a) C = shared environment (c) E = non-shared environment (e) (+ SES (s)) � Examine each ACE factor x SES (Interaction effects) A x SES (a’ ) C x SES (c’ ) E x SES (e’ ) � SES measures z-scored within studies to standardize across studies
Their model 1. 0 MZ=1. 0/DZ=0. 5 1. 0 1. 0 A 1 C 1 E 1 A 2 C 2 E 2 c+c'×SES e+e'×SES a+a'×SES IQ 1 s e+e'×SES a+a'×SES s IQ 2
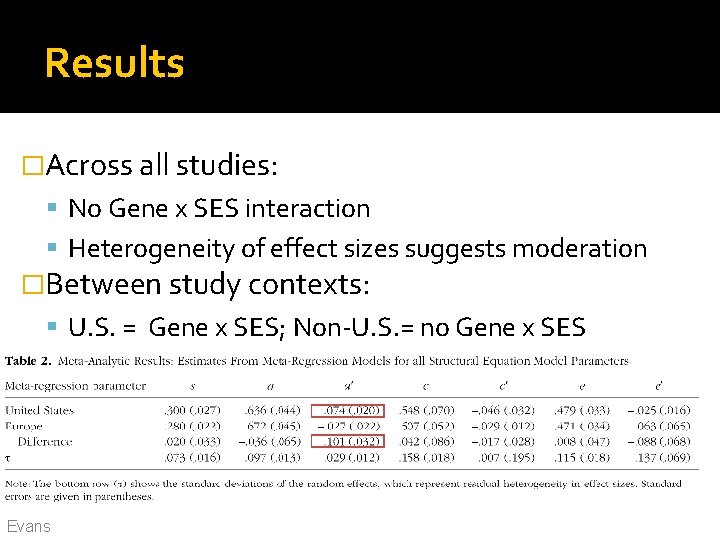
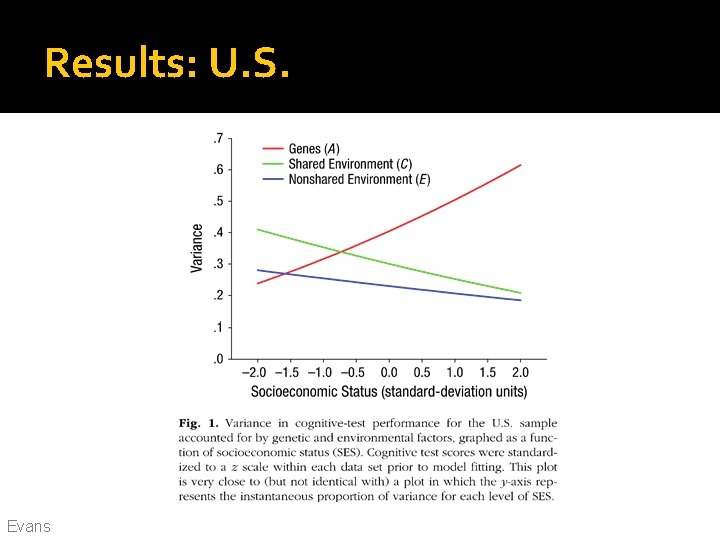
Results �Across all studies: No Gene x SES interaction Heterogeneity of effect sizes suggests moderation �Between study contexts: U. S. = Gene x SES; Non-U. S. = no Gene x SES Evans
Results: U. S. Evans
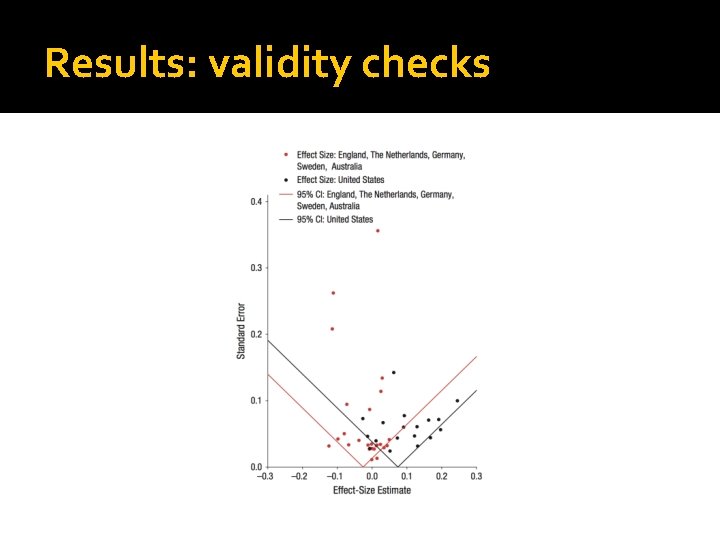
Results: validity checks
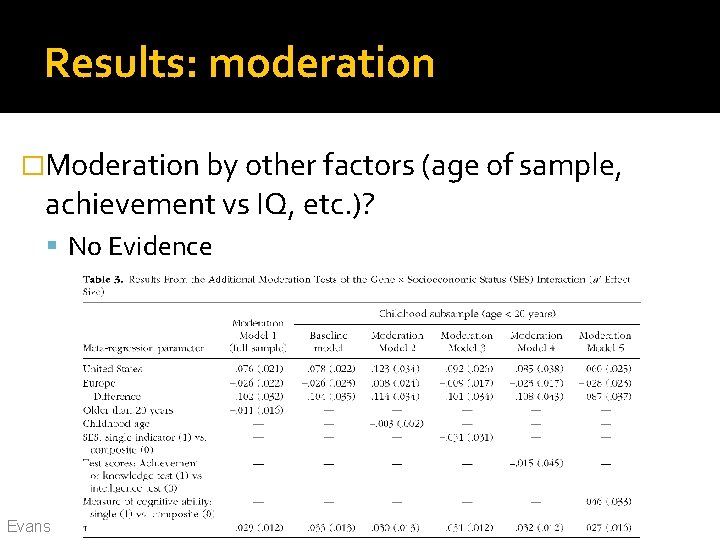
Results: moderation �Moderation by other factors (age of sample, achievement vs IQ, etc. )? No Evidence Evans
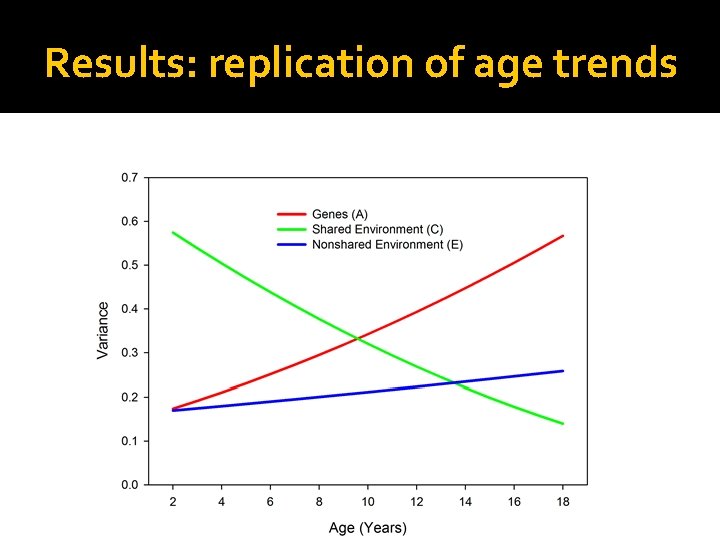
Results: replication of age trends
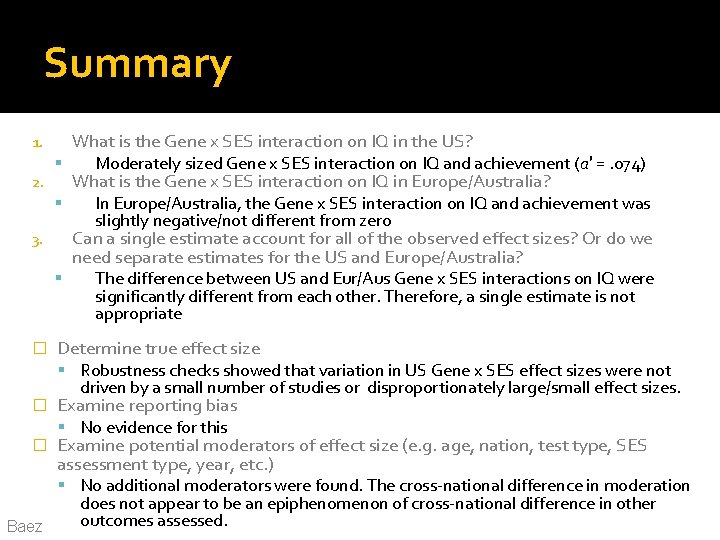
Summary What is the Gene x SES interaction on IQ in the US? 1. 2. What is the Gene x SES interaction on IQ in Europe/Australia? In Europe/Australia, the Gene x SES interaction on IQ and achievement was slightly negative/not different from zero Can a single estimate account for all of the observed effect sizes? Or do we need separate estimates for the US and Europe/Australia? 3. � Moderately sized Gene x SES interaction on IQ and achievement (a′ =. 074) The difference between US and Eur/Aus Gene x SES interactions on IQ were significantly different from each other. Therefore, a single estimate is not appropriate Determine true effect size Robustness checks showed that variation in US Gene x SES effect sizes were not � � driven by a small number of studies or disproportionately large/small effect sizes. Examine reporting bias No evidence for this Examine potential moderators of effect size (e. g. age, nation, test type, SES assessment type, year, etc. ) No additional moderators were found. The cross-national difference in moderation Baez does not appear to be an epiphenomenon of cross-national difference in other outcomes assessed.
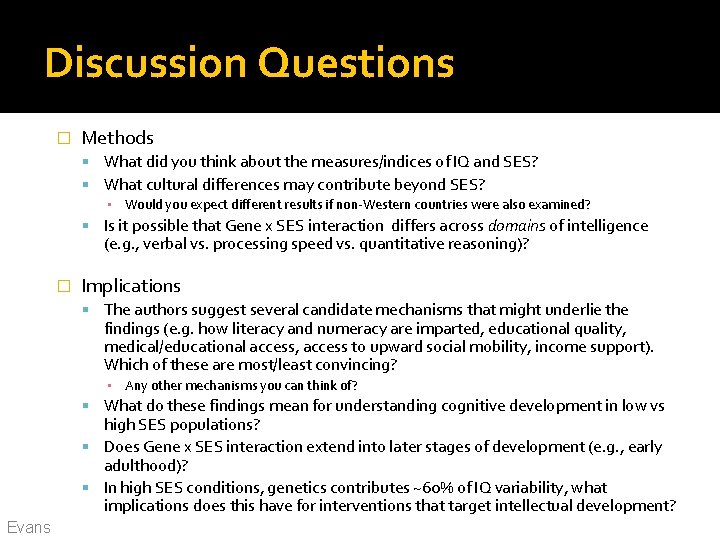
Discussion Questions � Methods What did you think about the measures/indices of IQ and SES? What cultural differences may contribute beyond SES? ▪ Would you expect different results if non-Western countries were also examined? Is it possible that Gene x SES interaction differs across domains of intelligence (e. g. , verbal vs. processing speed vs. quantitative reasoning)? � Implications The authors suggest several candidate mechanisms that might underlie the findings (e. g. how literacy and numeracy are imparted, educational quality, medical/educational access, access to upward social mobility, income support). Which of these are most/least convincing? ▪ Any other mechanisms you can think of? What do these findings mean for understanding cognitive development in low vs high SES populations? Does Gene x SES interaction extend into later stages of development (e. g. , early adulthood)? In high SES conditions, genetics contributes ~60% of IQ variability, what implications does this have for interventions that target intellectual development? Evans
Intervention �“It is in contrast to severe deprivation that enrichment shows its statistically significant effects. ” �Timing ▪ Gottlieb & Blair, 2004 Messinger
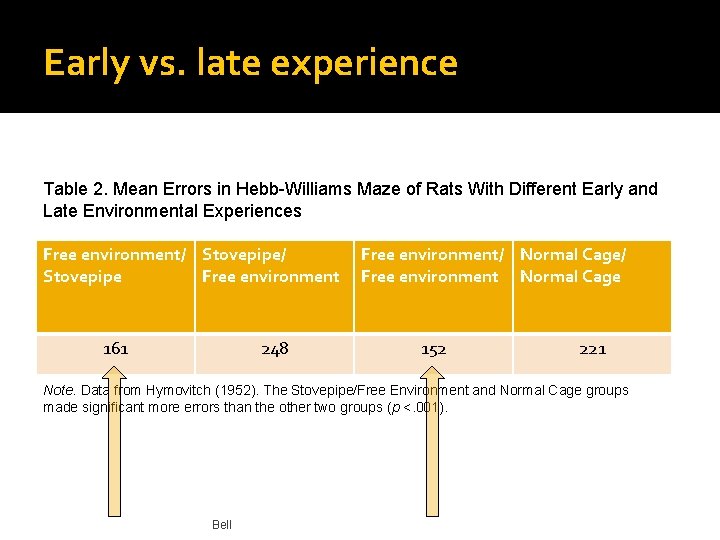
Its early experience that’s Early vs. late experience important Table 2. Mean Errors in Hebb-Williams Maze of Rats With Different Early and Late Environmental Experiences Free environment/ Stovepipe Free environment 161 248 Free environment/ Normal Cage/ Free environment Normal Cage 152 221 Note. Data from Hymovitch (1952). The Stovepipe/Free Environment and Normal Cage groups made significant more errors than the other two groups (p <. 001). Bell
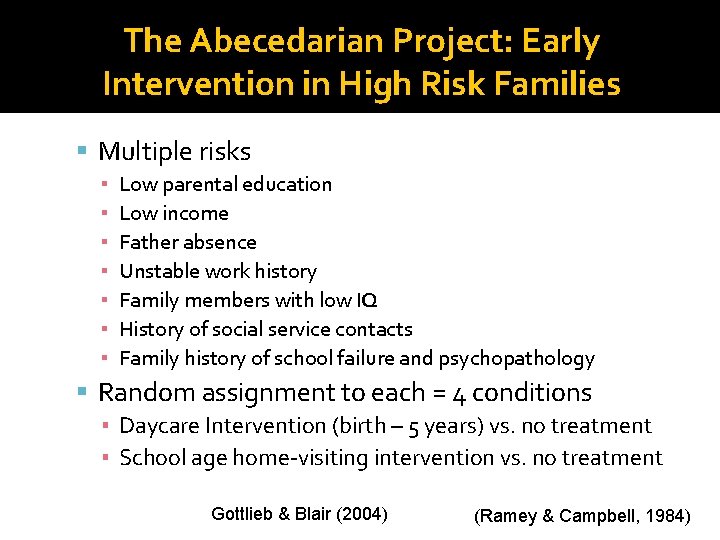
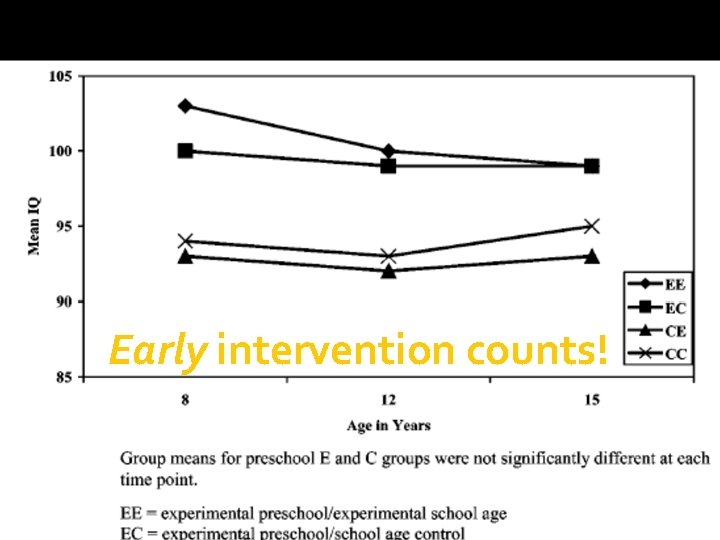
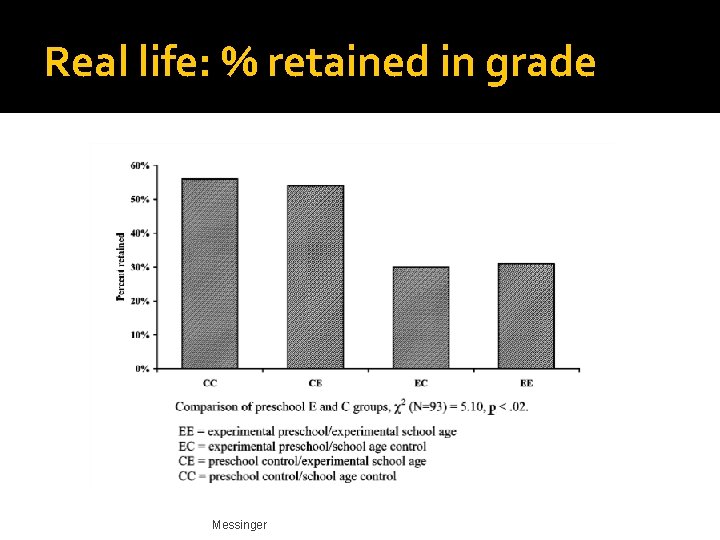
The Abecedarian Project: Early Intervention in High Risk Families Multiple risks ▪ ▪ ▪ ▪ Low parental education Low income Father absence Unstable work history Family members with low IQ History of social service contacts Family history of school failure and psychopathology Random assignment to each = 4 conditions ▪ Daycare Intervention (birth – 5 years) vs. no treatment ▪ School age home-visiting intervention vs. no treatment Gottlieb & Blair (2004) (Ramey & Campbell, 1984)
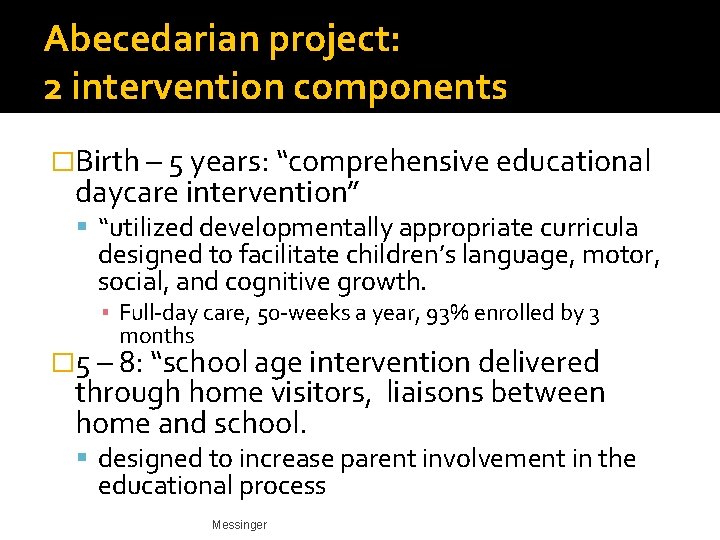
Abecedarian project: 2 intervention components �Birth – 5 years: “comprehensive educational daycare intervention” “utilized developmentally appropriate curricula designed to facilitate children’s language, motor, social, and cognitive growth. ▪ Full-day care, 50 -weeks a year, 93% enrolled by 3 months � 5 – 8: “school age intervention delivered through home visitors, liaisons between home and school. designed to increase parent involvement in the educational process Messinger
Early intervention counts! Messinger
Real life: % retained in grade Messinger
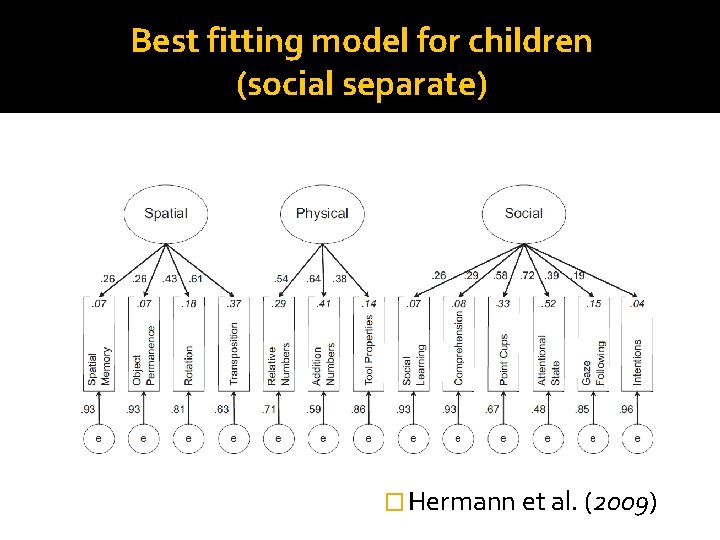
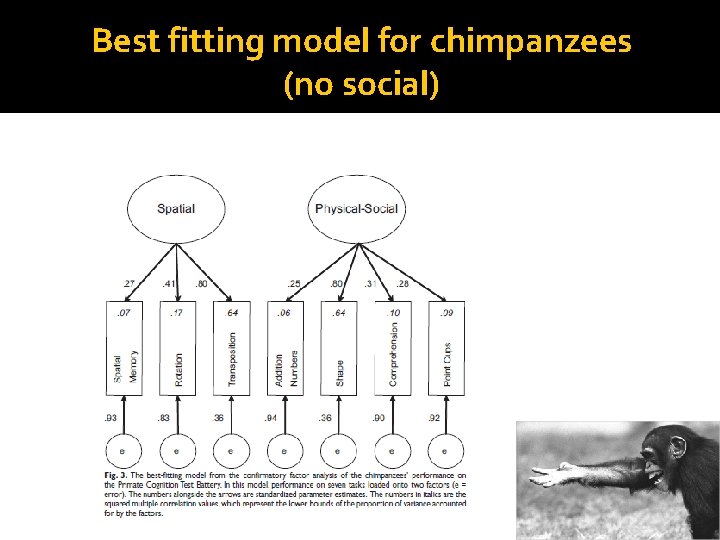
Hermann et al. 2010 The Structure of Individual Differences in the Cognitive Abilities of Children and Chimpanzees Ni Sun-Suslow
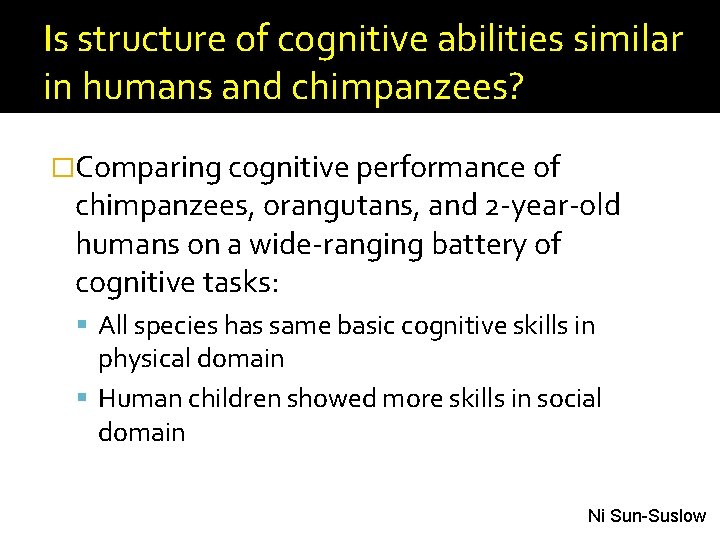
Is structure of cognitive abilities similar in humans and chimpanzees? �Comparing cognitive performance of chimpanzees, orangutans, and 2 -year-old humans on a wide-ranging battery of cognitive tasks: All species has same basic cognitive skills in physical domain Human children showed more skills in social domain Ni Sun-Suslow
Best fitting model for children (social separate) � Hermann et al. (2009)
Best fitting model for chimpanzees (no social)