A presentation to Fresno County Employees Retirement Association
- Slides: 49
A presentation to: Fresno County Employees’ Retirement Association Presented on May 3, 2006 Mike Martel Neil Tremblay Click to edit Master subtitle style 1
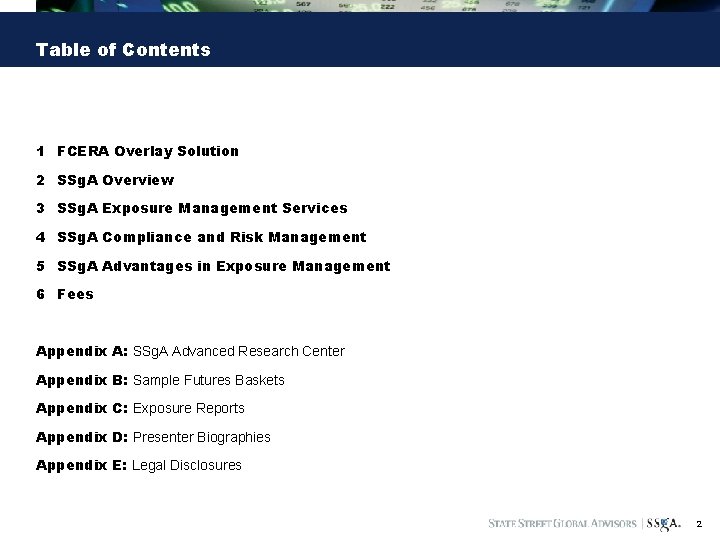
Table of Contents 1 FCERA Overlay Solution 2 SSg. A Overview 3 SSg. A Exposure Management Services 4 SSg. A Compliance and Risk Management 5 SSg. A Advantages in Exposure Management 6 Fees Appendix A: SSg. A Advanced Research Center Appendix B: Sample Futures Baskets Appendix C: Exposure Reports Appendix D: Presenter Biographies Appendix E: Legal Disclosures 2
FCERA Overlay Solution
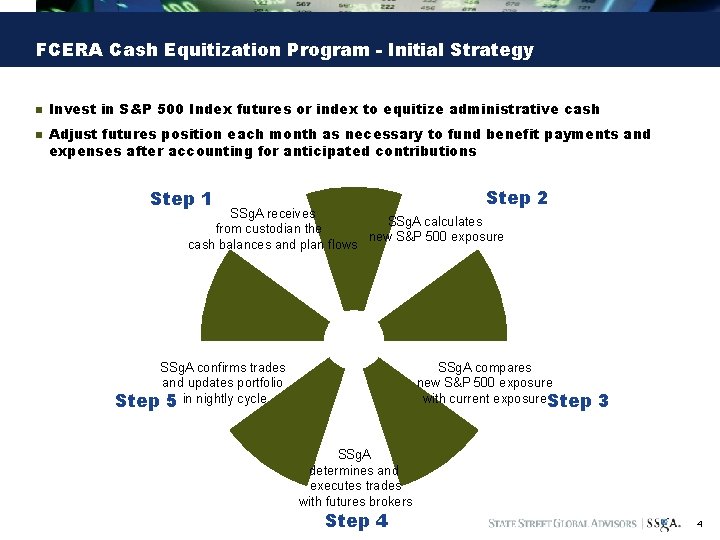
FCERA Cash Equitization Program - Initial Strategy n n Invest in S&P 500 Index futures or index to equitize administrative cash Adjust futures position each month as necessary to fund benefit payments and expenses after accounting for anticipated contributions Step 2 Step 1 SSg. A receives SSg. A calculates from custodian the new S&P 500 exposure cash balances and plan flows SSg. A compares new S&P 500 exposure with current exposure. Step SSg. A confirms trades and updates portfolio Step 5 in nightly cycle 3 SSg. A determines and executes trades with futures brokers Step 4 4
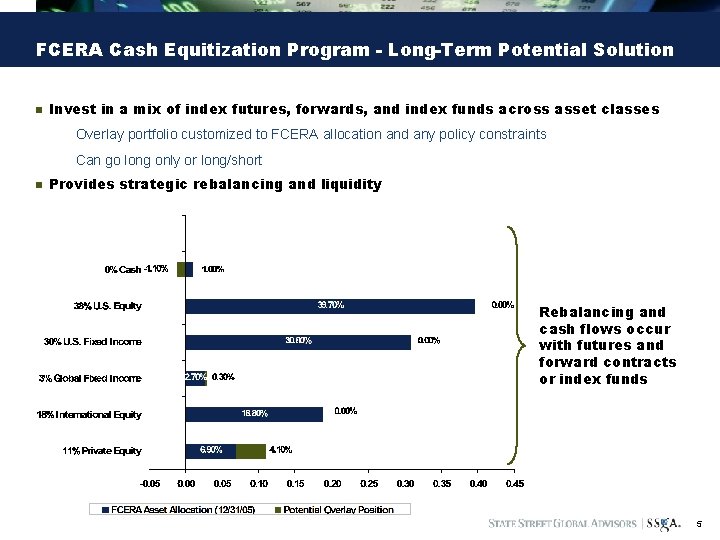
FCERA Cash Equitization Program - Long-Term Potential Solution n Invest in a mix of index futures, forwards, and index funds across asset classes Overlay portfolio customized to FCERA allocation and any policy constraints Can go long only or long/short n Provides strategic rebalancing and liquidity Rebalancing and cash flows occur with futures and forward contracts or index funds 5
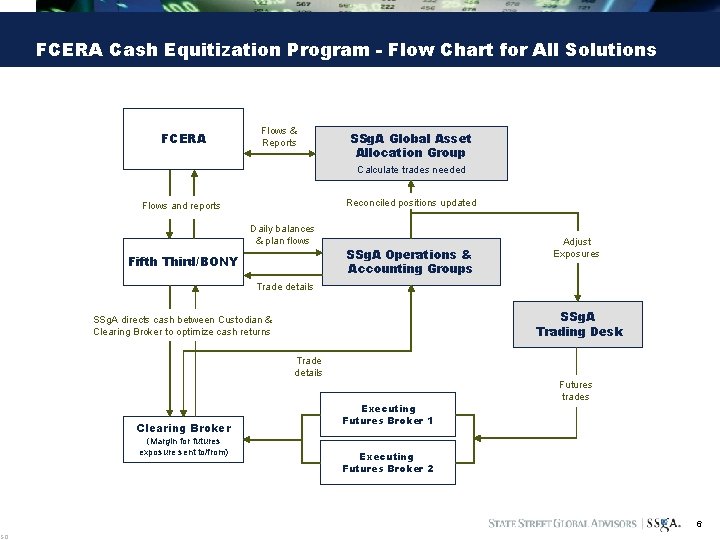
SO FCERA Cash Equitization Program - Flow Chart for All Solutions FCERA Flows & Reports SSg. A Global Asset Allocation Group Calculate trades needed Reconciled positions updated Flows and reports Daily balances & plan flows Fifth Third/BONY SSg. A Operations & Accounting Groups Adjust Exposures Trade details SSg. A Trading Desk SSg. A directs cash between Custodian & Clearing Broker to optimize cash returns Trade details Clearing Broker (Margin for futures exposure sent to/from) Executing Futures Broker 1 Futures trades Executing Futures Broker 2 6
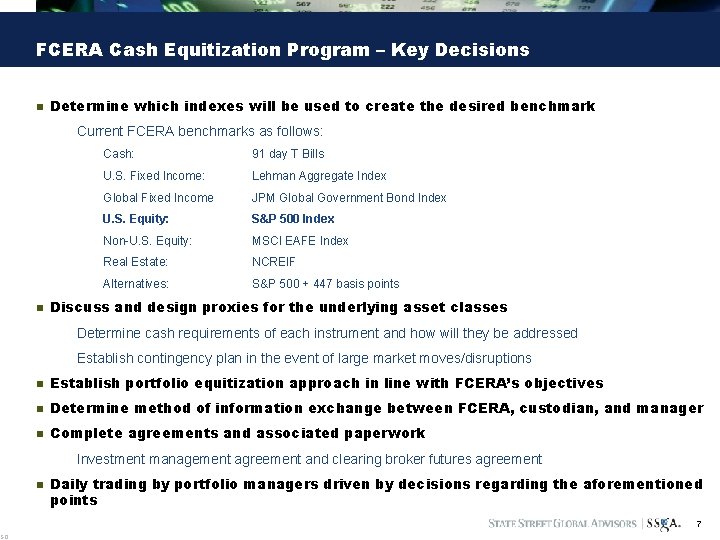
SO FCERA Cash Equitization Program – Key Decisions n Determine which indexes will be used to create the desired benchmark Current FCERA benchmarks as follows: n Cash: 91 day T Bills U. S. Fixed Income: Lehman Aggregate Index Global Fixed Income JPM Global Government Bond Index U. S. Equity: S&P 500 Index Non-U. S. Equity: MSCI EAFE Index Real Estate: NCREIF Alternatives: S&P 500 + 447 basis points Discuss and design proxies for the underlying asset classes Determine cash requirements of each instrument and how will they be addressed Establish contingency plan in the event of large market moves/disruptions n Establish portfolio equitization approach in line with FCERA’s objectives n Determine method of information exchange between FCERA, custodian, and manager n Complete agreements and associated paperwork Investment management agreement and clearing broker futures agreement n Daily trading by portfolio managers driven by decisions regarding the aforementioned points 7
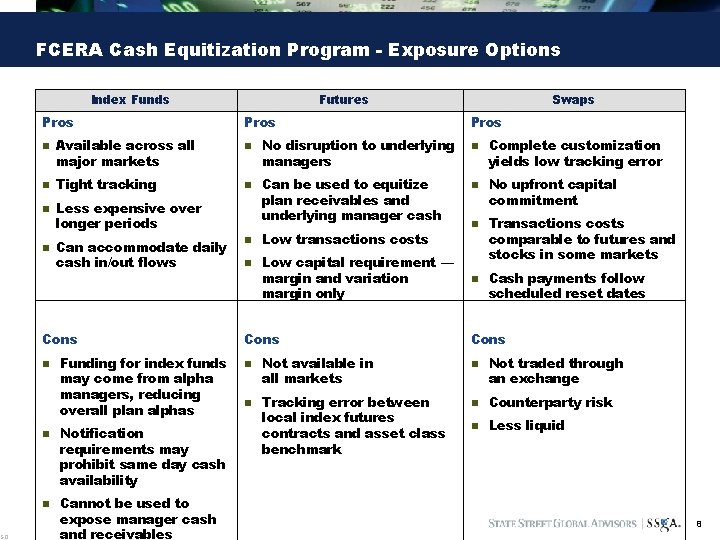
SO FCERA Cash Equitization Program - Exposure Options Index Funds Pros n n Available across all major markets Tight tracking n n Pros n n Less expensive over longer periods Can accommodate daily cash in/out flows Cons n Futures Funding for index funds may come from alpha managers, reducing overall plan alphas Notification requirements may prohibit same day cash availability Cannot be used to expose manager cash and receivables n n No disruption to underlying managers Can be used to equitize plan receivables and underlying manager cash Low transactions costs Low capital requirement — margin and variation margin only Cons n n Not available in all markets Tracking error between local index futures contracts and asset class benchmark Swaps Pros n n Complete customization yields low tracking error No upfront capital commitment Transactions costs comparable to futures and stocks in some markets Cash payments follow scheduled reset dates Cons n Not traded through an exchange n Counterparty risk n Less liquid 8
SSg. A Overview
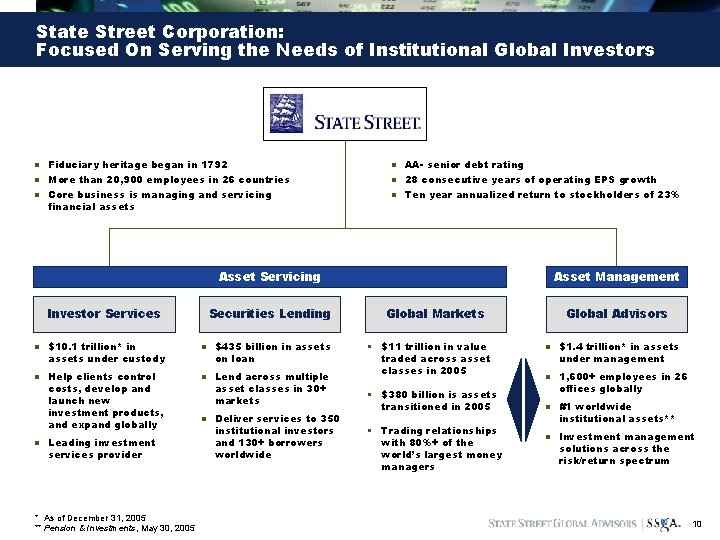
State Street Corporation: Focused On Serving the Needs of Institutional Global Investors n n n Fiduciary heritage began in 1792 More than 20, 900 employees in 26 countries Core business is managing and servicing financial assets n n n AA- senior debt rating 28 consecutive years of operating EPS growth Ten year annualized return to stockholders of 23% Asset Servicing Investor Services n n n $10. 1 trillion* in assets under custody Help clients control costs, develop and launch new investment products, and expand globally Leading investment services provider * As of December 31, 2005 ** Pension & Investments, May 30, 2005 Securities Lending n n n $435 billion in assets on loan Lend across multiple asset classes in 30+ markets Deliver services to 350 institutional investors and 130+ borrowers worldwide Asset Management Global Markets • $11 trillion in value traded across asset classes in 2005 • $380 billion is assets transitioned in 2005 • Trading relationships with 80%+ of the world’s largest money managers Global Advisors n n $1. 4 trillion* in assets under management 1, 600+ employees in 26 offices globally #1 worldwide institutional assets** Investment management solutions across the risk/return spectrum 10
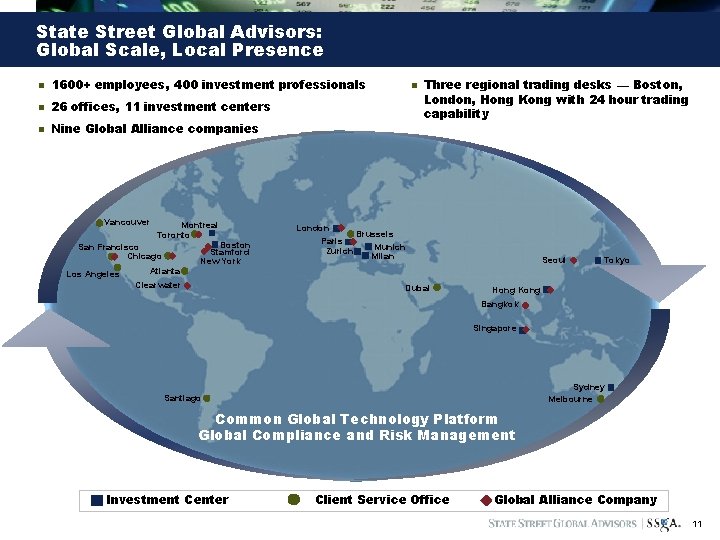
State Street Global Advisors: Global Scale, Local Presence n 1600+ employees, 400 investment professionals n 26 offices, 11 investment centers n Nine Global Alliance companies Vancouver Montreal Toronto Boston Stamford New York San Francisco Chicago Los Angeles London Paris Zurich n Three regional trading desks — Boston, London, Hong Kong with 24 hour trading capability Brussels Munich Milan Seoul Tokyo Atlanta Clearwater Dubai Hong Kong Bangkok Singapore Sydney Melbourne Santiago Common Global Technology Platform Global Compliance and Risk Management Investment Center Client Service Office Global Alliance Company 11
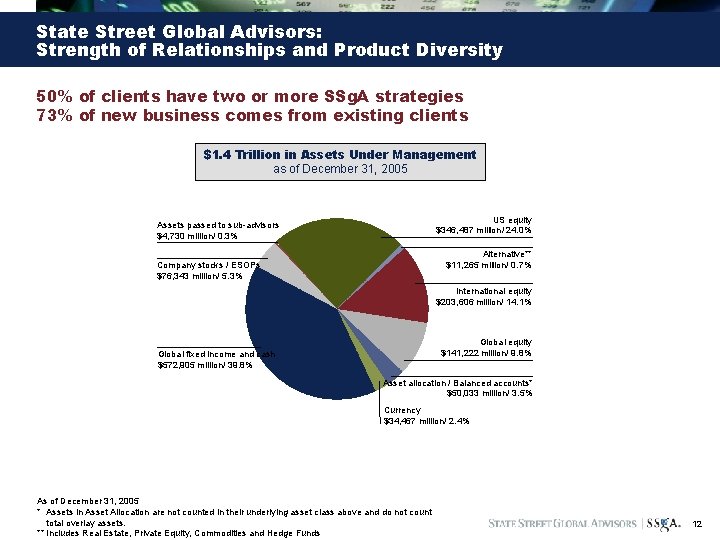
State Street Global Advisors: Strength of Relationships and Product Diversity 50% of clients have two or more SSg. A strategies 73% of new business comes from existing clients $1. 4 Trillion in Assets Under Management as of December 31, 2005 US equity $346, 487 million/ 24. 0% Assets passed to sub-advisors $4, 730 million/ 0. 3% Alternative** $11, 265 million/ 0. 7% Company stocks / ESOPs $76, 343 million/ 5. 3% International equity $203, 606 million/ 14. 1% Global equity $141, 222 million/ 9. 8% Global fixed income and cash $572, 905 million/ 39. 8% Asset allocation / Balanced accounts* $50, 033 million/ 3. 5% Currency $34, 467 million/ 2. 4% As of December 31, 2005 * Assets in Asset Allocation are not counted in their underlying asset class above and do not count total overlay assets. ** Includes Real Estate, Private Equity, Commodities and Hedge Funds 12
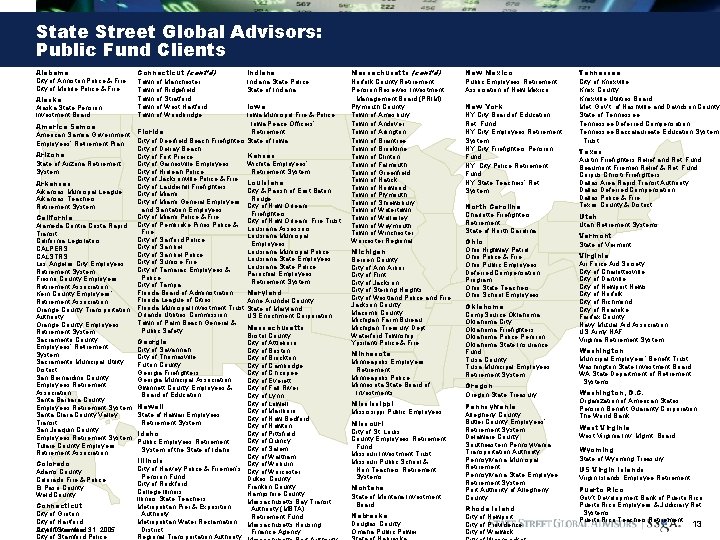
State Street Global Advisors: Public Fund Clients Alabama City of Anniston Police & Fire City of Mobile Police & Fire Alaska State Pension Investment Board America Samoa American Samoa Government Employees’ Retirement Plan Arizona State of Arizona Retirement System Arkansas Municipal League Arkansas Teachers Retirement System California Alameda Contra Costa Rapid Transit California Legislators CALPERS CALSTRS Los Angeles City Employees Retirement System Fresno County Employees Retirement Association Kern County Employees’ Retirement Association Orange County Transportation Authority Orange County Employees Retirement System Sacramento County Employees’ Retirement System Sacramento Municipal Utility District San Bernardino County Employees Retirement Association Santa Barbara County Employees Retirement System Santa Clara County Valley Transit San Joaquin County Employees Retirement System Tulare County Employees Retirement Association Colorado Adams County Colorado Fire & Police El Paso County Weld County Connecticut City of Groton City of Hartford City Stamford 31, 2005 As ofof. December City of Stamford Police Connecticut (cont’d) Town of Manchester Town of Ridgefield Town of Stratford Town of West Hartford Town of Woodbridge Indiana State Police State of Indiana Iowa Municipal Fire & Police Iowa Peace Officers’ Florida Retirement City of Deerfield Beach Firefighters State of Iowa City of Delray Beach Kansas City of Fort Pierce City of Gainesville Employees Wichita Employees’ City of Hialeah Police Retirement System City of Jacksonville Police & Fire Louisiana City of Lauderhill Firefighters City & Parish of East Baton City of Miami General Employees Rouge City of New Orleans and Sanitation Employees Firefighters City of Miami Police & Fire City of Pembroke Pines Police & City of New Orleans Fire Trust Louisiana Assessors Fire Louisiana Municipal City of Sanford Police Employees City of Sanibel Louisiana Municipal Police City of Sanibel Police Louisiana State Employees City of Sunrise Fire Louisiana State Police City of Tamarac Employees & Parochial Employees Police Retirement System City of Tampa Florida Board of Administration Florida League of Cities Florida Municipal Investment Trust Orlando Utilities Commission Town of Palm Beach General & Public Safety Maryland Anne Arundel County State of Maryland US Enrichment Corporation Massachusetts Bristol County City of Attleboro City of Boston City of Brockton City of Cambridge City of Chicopee City of Everett City of Fall River City of Lynn City of Lowell Hawaii City of Marlboro State of Hawaii Employees City of New Bedford Retirement System City of Newton City of Pittsfield Idaho City of Quincy Public Employees Retirement City of Salem System of the State of Idaho City of Waltham Illinois City of Woburn City of Harvey Police & Firemen’s City of Worcester Pension Fund Dukes County City of Rockford Franklin County College Illinois Hampshire County Illinois State Teachers Massachusetts Bay Transit Metropolitan Pier & Exposition Authority (MBTA) Authority Retirement Fund Metropolitan Water Reclamation Massachusetts Housing District Finance Agency Regional Transportation Authority Georgia City of Savannah City of Thomasville Fulton County Georgia Firefighters Georgia Municipal Association Gwinnett County Employees & Board of Education Massachusetts (cont’d) Norfolk County Retirement Pension Reserves Investment Management Board (PRIM) Plymouth County Town of Amesbury Town of Andover Town of Arlington Town of Braintree Town of Brookline Town of Clinton Town of Falmouth Town of Greenfield Town of Natick Town of Norwood Town of Plymouth Town of Shrewsbury Town of Watertown Town of Wellesley Town of Weymouth Town of Winchester Worcester Regional Michigan Berrien County City of Ann Arbor City of Flint City of Jackson City of Sterling Heights City of Westland Police and Fire Jackson County Macomb County Michigan Farm Bureau Michigan Treasury Dept. Waterford Township Ypsilanti Police & Fire Minnesota Minneapolis Employees Retirement Minneapolis Police Minnesota State Board of Investments Mississippi Public Employees Missouri City of St. Louis County Employees Retirement Fund Missouri Investment Trust Missouri Public School & Non-Teachers Retirement Systems Montana State of Montana Investment Board Nebraska Douglas County Omaha Public Power New Mexico Public Employees Retirement Association of New Mexico New York NY City Board of Education Ret. Fund NY City Employees Retirement System NY City Firefighters Pension Fund NY City Police Retirement Fund NY State Teachers’ Ret. System North Carolina Charlotte Firefighters Retirement State of North Carolina Ohio Highway Patrol Ohio Police & Fire Ohio Public Employees Deferred Compensation Program Ohio State Teachers Ohio School Employees Oklahoma Comp. Source Oklahoma City Oklahoma Firefighters Oklahoma Police Pension Oklahoma State Insurance Fund Tulsa County Tulsa Municipal Employees Retirement System Oregon State Treasury Pennsylvania Allegheny County Butler County Employees’ Retirement System Delaware County Southeastern Pennsylvania Transportation Authority Pennsylvania Municipal Retirement Pennsylvania State Employee Retirement System Port Authority of Allegheny County Rhode Island City of Newport City of Providence City of Warwick Tennessee City of Knoxville Knox County Knoxville Utilities Board Met. Gov’t. of Nashville and Davidson County State of Tennessee Deferred Compensation Tennessee Baccalaureate Education System Trust Texas Austin Firefighters Relief and Ret. Fund Beaumont Firemen Relief & Ret. Fund Corpus Christi Firefighters Dallas Area Rapid Transit Authority Dallas Deferred Compensation Dallas Police & Fire Texas County & District Utah Retirement Systems Vermont State of Vermont Virginia Air Force Aid Society City of Charlottesville City of Danville City of Newport News City of Norfolk City of Richmond City of Roanoke Fairfax County Navy Mutual Aid Association US Army NAF Virginia Retirement System Washington Municipal Employees’ Benefit Trust Washington State Investment Board WA State Department of Retirement Systems Washington, D. C. Organization of American States Pension Benefit Guaranty Corporation The World Bank West Virginia Inv. Mgmt. Board Wyoming State of Wyoming Treasury US Virgin Islands Employee Retirement Puerto Rico Gov’t Development Bank of Puerto Rico Employees & Judiciary Ret. Systems Puerto Rico Teachers Retirement 13
SSg. A Exposure Management Services
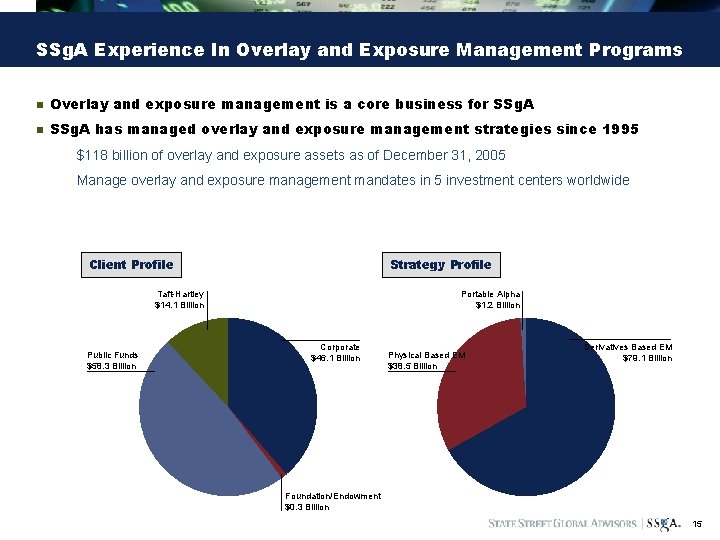
SSg. A Experience In Overlay and Exposure Management Programs n Overlay and exposure management is a core business for SSg. A n SSg. A has managed overlay and exposure management strategies since 1995 $118 billion of overlay and exposure assets as of December 31, 2005 Manage overlay and exposure management mandates in 5 investment centers worldwide Client Profile Strategy Profile Taft-Hartley $14. 1 Billion Public Funds $58. 3 Billion Portable Alpha $1. 2 Billion Corporate $46. 1 Billion Physical Based EM $38. 5 Billion Derivatives Based EM $79. 1 Billion Foundation/Endowment $0. 3 Billion 15
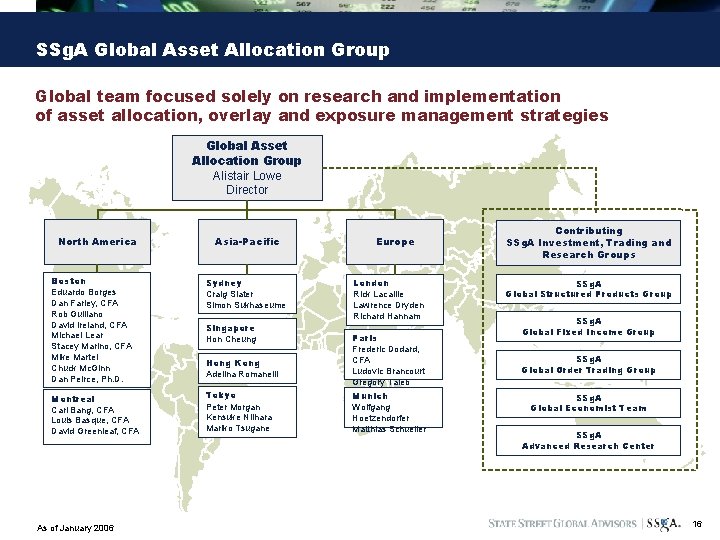
SSg. A Global Asset Allocation Group Global team focused solely on research and implementation of asset allocation, overlay and exposure management strategies Global Asset Allocation Group Alistair Lowe Director North America Asia-Pacific Boston Eduardo Borges Dan Farley, CFA Rob Guiliano David Ireland, CFA Michael Lear Stacey Marino, CFA Mike Martel Chuck Mc. Ginn Dan Peirce, Ph. D. Sydney Craig Slater Simon Sukhaseume Montreal Carl Bang, CFA Louis Basque, CFA David Greenleaf, CFA Tokyo Peter Morgan Kensuke Niihara Mariko Tsugane As of January 2006 Singapore Hon Cheung Hong Kong Adelina Romanelli Europe London Rick Lacaille Lawrence Dryden Richard Hannam Paris Frederic Dodard, CFA Ludovic Brancourt Gregory Taieb Munich Wolfgang Hoetzendorfer Matthias Schueller Contributing SSg. A Investment, Trading and Research Groups SSg. A Global Structured Products Group SSg. A Global Fixed Income Group SSg. A Global Order Trading Group SSg. A Global Economist Team SSg. A Advanced Research Center 16
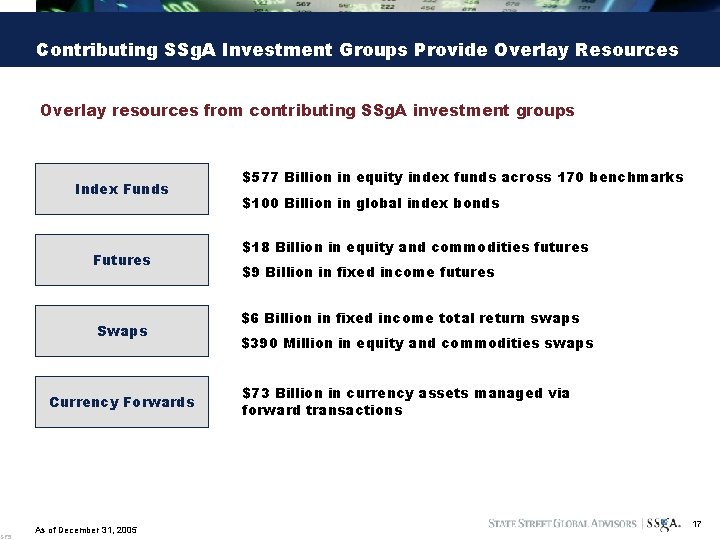
SP 5 Contributing SSg. A Investment Groups Provide Overlay Resources Overlay resources from contributing SSg. A investment groups Index Funds Futures Swaps Currency Forwards As of December 31, 2005 $577 Billion in equity index funds across 170 benchmarks $100 Billion in global index bonds $18 Billion in equity and commodities futures $9 Billion in fixed income futures $6 Billion in fixed income total return swaps $390 Million in equity and commodities swaps $73 Billion in currency assets managed via forward transactions 17
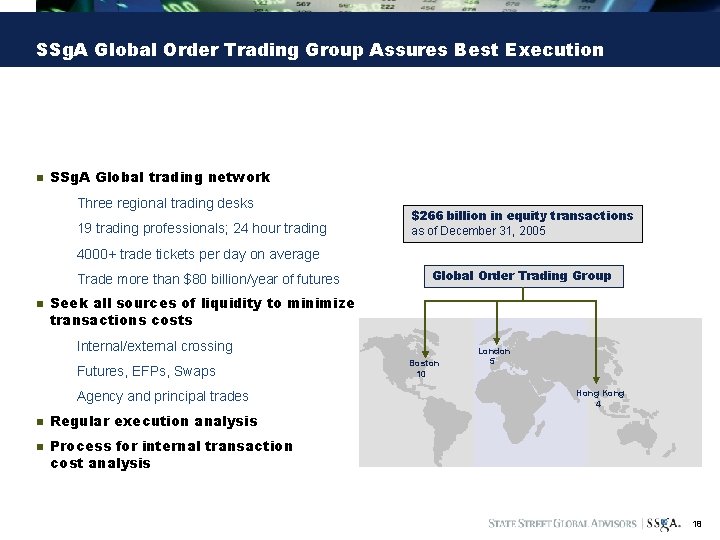
SSg. A Global Order Trading Group Assures Best Execution n SSg. A Global trading network Three regional trading desks 19 trading professionals; 24 hour trading $266 billion in equity transactions as of December 31, 2005 4000+ trade tickets per day on average Trade more than $80 billion/year of futures n Global Order Trading Group Seek all sources of liquidity to minimize transactions costs Internal/external crossing Futures, EFPs, Swaps Agency and principal trades n n Boston 10 London 5 Hong Kong 4 Regular execution analysis Process for internal transaction cost analysis 18
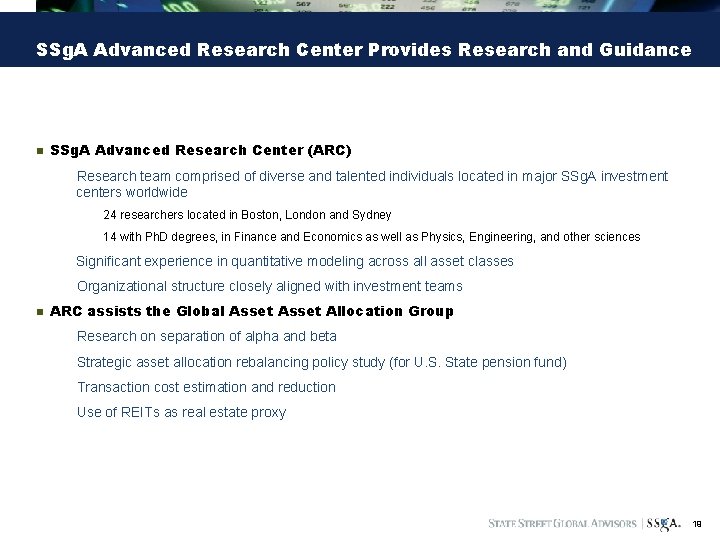
SSg. A Advanced Research Center Provides Research and Guidance n SSg. A Advanced Research Center (ARC) Research team comprised of diverse and talented individuals located in major SSg. A investment centers worldwide 24 researchers located in Boston, London and Sydney 14 with Ph. D degrees, in Finance and Economics as well as Physics, Engineering, and other sciences Significant experience in quantitative modeling across all asset classes Organizational structure closely aligned with investment teams n ARC assists the Global Asset Allocation Group Research on separation of alpha and beta Strategic asset allocation rebalancing policy study (for U. S. State pension fund) Transaction cost estimation and reduction Use of REITs as real estate proxy 19
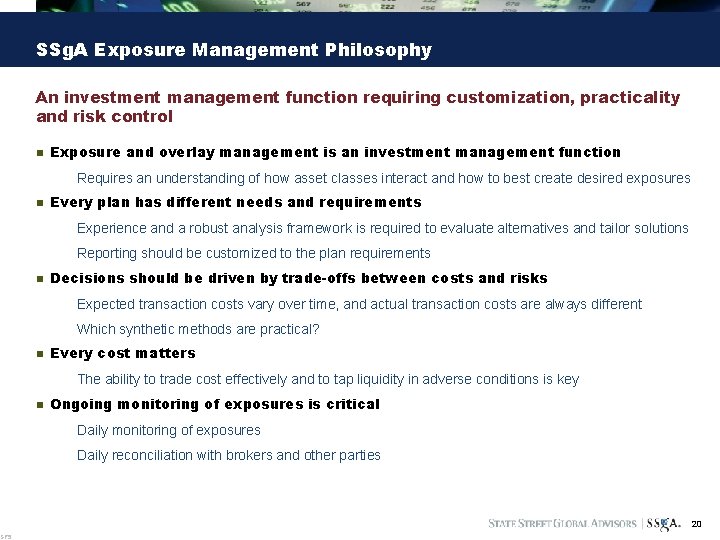
SP 5 SSg. A Exposure Management Philosophy An investment management function requiring customization, practicality and risk control n Exposure and overlay management is an investment management function Requires an understanding of how asset classes interact and how to best create desired exposures n Every plan has different needs and requirements Experience and a robust analysis framework is required to evaluate alternatives and tailor solutions Reporting should be customized to the plan requirements n Decisions should be driven by trade-offs between costs and risks Expected transaction costs vary over time, and actual transaction costs are always different Which synthetic methods are practical? n Every cost matters The ability to trade cost effectively and to tap liquidity in adverse conditions is key n Ongoing monitoring of exposures is critical Daily monitoring of exposures Daily reconciliation with brokers and other parties 20
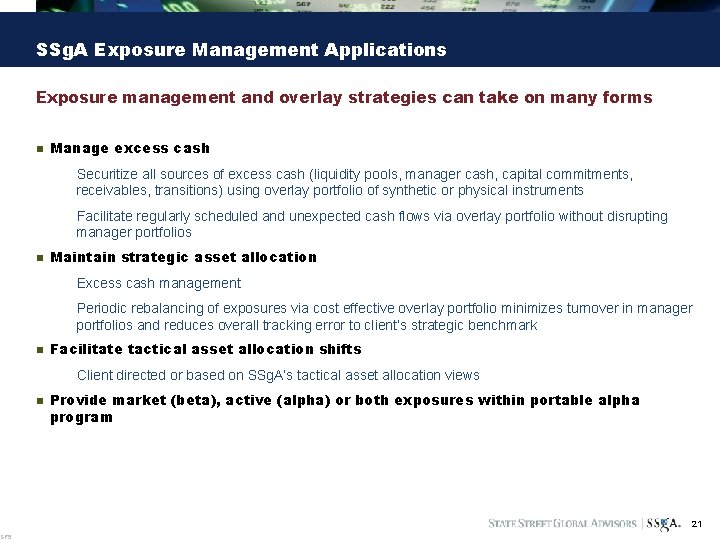
SP 5 SSg. A Exposure Management Applications Exposure management and overlay strategies can take on many forms n Manage excess cash Securitize all sources of excess cash (liquidity pools, manager cash, capital commitments, receivables, transitions) using overlay portfolio of synthetic or physical instruments Facilitate regularly scheduled and unexpected cash flows via overlay portfolio without disrupting manager portfolios n Maintain strategic asset allocation Excess cash management Periodic rebalancing of exposures via cost effective overlay portfolio minimizes turnover in manager portfolios and reduces overall tracking error to client’s strategic benchmark n Facilitate tactical asset allocation shifts Client directed or based on SSg. A’s tactical asset allocation views n Provide market (beta), active (alpha) or both exposures within portable alpha program 21
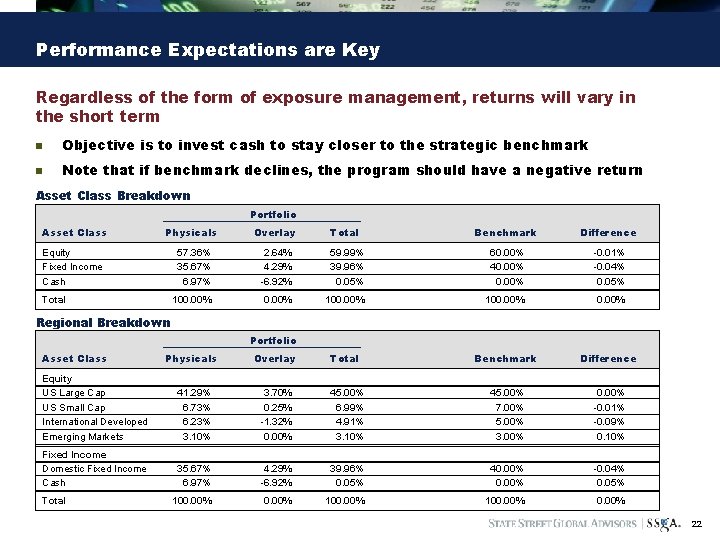
Performance Expectations are Key Regardless of the form of exposure management, returns will vary in the short term n Objective is to invest cash to stay closer to the strategic benchmark n Note that if benchmark declines, the program should have a negative return Asset Class Breakdown Portfolio Asset Class Physicals Equity Fixed Income Cash Total Overlay Total Benchmark Difference 57. 36% 35. 67% 6. 97% 2. 64% 4. 29% -6. 92% 59. 99% 39. 96% 0. 05% 60. 00% 40. 00% -0. 01% -0. 04% 0. 05% 100. 00% 0. 00% Overlay Total Benchmark Difference Regional Breakdown Portfolio Asset Class Physicals Equity US Large Cap US Small Cap International Developed Emerging Markets 41. 29% 6. 73% 6. 23% 3. 10% 3. 70% 0. 25% -1. 32% 0. 00% 45. 00% 6. 99% 4. 91% 3. 10% 45. 00% 7. 00% 5. 00% 3. 00% 0. 00% -0. 01% -0. 09% 0. 10% Fixed Income Domestic Fixed Income Cash 35. 67% 6. 97% 4. 29% -6. 92% 39. 96% 0. 05% 40. 00% -0. 04% 0. 05% 100. 00% 0. 00% Total 22
SSg. A Compliance and Risk Management
SP 5 Compliance Monitoring and Risk Controls n Independent teams provide layers of checks and balances Global Asset Allocation Group Portfolio Management Global Asset Allocation Group Operations SSg. A Trading Operations n Daily oversight Daily mark-to-market of futures position Daily allocation analysis and reconciliation n Counterparty credit risk management SSg. A Global Fixed Income Group Credit Team reviews all counterparties n Compliance and Risk Management Group review SSg. A compliance team comprises 23 professionals Corporate internal audit team comprises 95 professionals 24
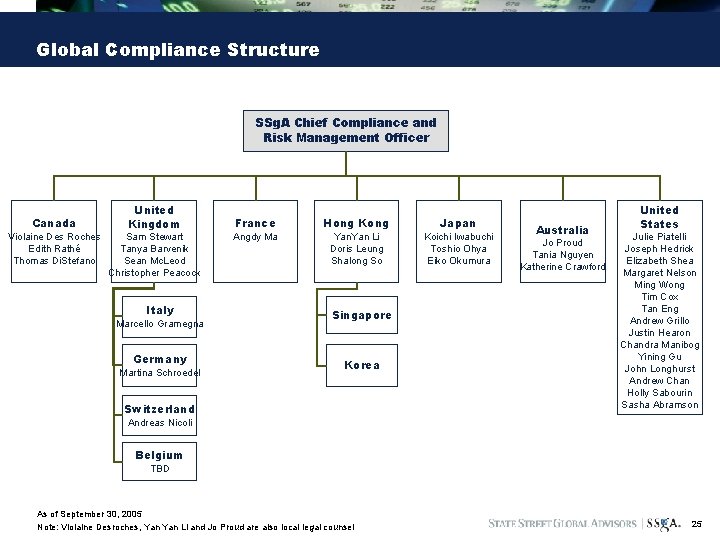
Global Compliance Structure SSg. A Chief Compliance and Risk Management Officer Canada Violaine Des Roches Edith Rathé Thomas Di. Stefano United Kingdom Sam Stewart Tanya Barvenik Sean Mc. Leod Christopher Peacock Italy Marcello Gramegna Germany Martina Schroedel France Angdy Ma Hong Kong Japan Yan Li Doris Leung Shalong So Koichi Iwabuchi Toshio Ohya Eiko Okumura Singapore Korea Switzerland Australia Jo Proud Tania Nguyen Katherine Crawford United States Julie Piatelli Joseph Hedrick Elizabeth Shea Margaret Nelson Ming Wong Tim Cox Tan Eng Andrew Grillo Justin Hearon Chandra Manibog Yining Gu John Longhurst Andrew Chan Holly Sabourin Sasha Abramson Andreas Nicoli Belgium TBD As of September 30, 2005 Note: Violaine Desroches, Yan Li and Jo Proud are also local legal counsel 25
SSg. A Compliance and Risk Management n Compliance and Risk Management function has an independent reporting structure Report directly to SSg. A CEO Significant interaction with State Street Corporate Audit and Enterprise Risk Management n Strong corporate governance — SSg. A Code of Ethics n Staffed with highly experienced compliance and risk management professionals n Operates globally and within a complex regulatory environment: US Securities and Exchange Commission (SEC) Federal Reserve Bank (Federal Reserve) Commodity Futures Trading Commission (CFTC) Office of the Comptroller of the Currency (OCC) Internal Revenue Service (IRS) National Futures Association (NFA) US Department of Labor (DOL) Multiple foreign regulatory authorities (e. g. , Financial Services Authority, UK, Australian Securities & Investment Commission, etc. ) 26
SSg. A Advantages in Exposure Management
SP 5 SSg. A Advantages in Exposure Management n Experience Exposure management and overlay is a core business for SSg. A has managed overlay strategies since 1995 $118 billion of overlay mandates managed by Global Asset Allocation team in 5 investment centers worldwide Consider overlay an asset management function, understand how to asset classes interact and how best to obtain inexpensive exposure to them Customization is the norm – we typically work with clients on any level they desire n Resources Global Asset Allocation Group has a wide array of resources Global Trading Desk handles more than $80 billion of derivative transactions per year Global Equity Index and Global Fixed Income Groups routinely develop or use derivatives for cash exposures Advanced Research Center assists with client-related projects and overlay research SSg. A can implement the most appropriate overlay investments at the lowest cost available Futures, Index Funds, Swaps n Infrastructure All portfolio managers worldwide use the same systems and resources Dedicated operations staff Electronic links to custody and trading Comprehensive risk and compliance oversight 28
Fees
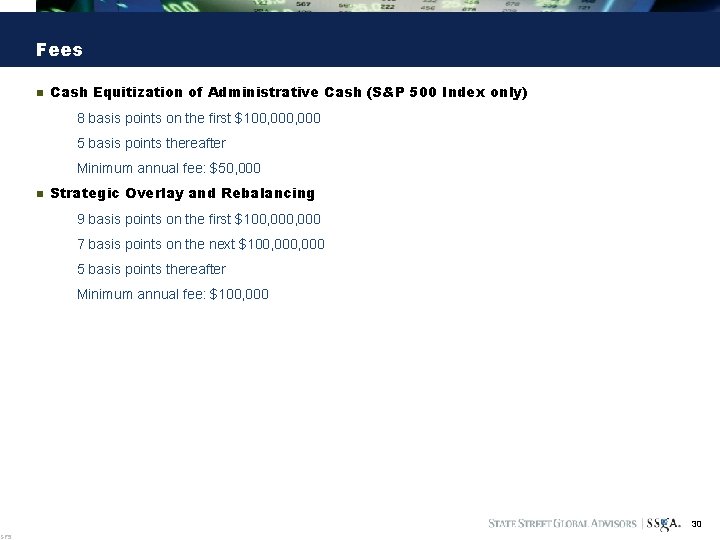
SP 5 Fees n Cash Equitization of Administrative Cash (S&P 500 Index only) 8 basis points on the first $100, 000 5 basis points thereafter Minimum annual fee: $50, 000 n Strategic Overlay and Rebalancing 9 basis points on the first $100, 000 7 basis points on the next $100, 000 5 basis points thereafter Minimum annual fee: $100, 000 30
Appendix A: SSg. A Advanced Research Center
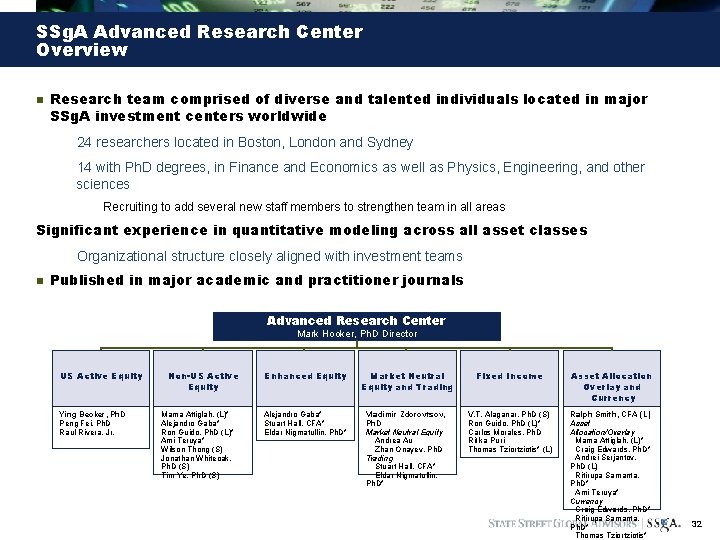
SSg. A Advanced Research Center Overview n Research team comprised of diverse and talented individuals located in major SSg. A investment centers worldwide 24 researchers located in Boston, London and Sydney 14 with Ph. D degrees, in Finance and Economics as well as Physics, Engineering, and other sciences Recruiting to add several new staff members to strengthen team in all areas Significant experience in quantitative modeling across all asset classes Organizational structure closely aligned with investment teams n Published in major academic and practitioner journals Advanced Research Center Mark Hooker, Ph. D Director US Active Equity Ying Becker, Ph. D Peng Fei, Ph. D Raul Rivera, Jr. Non-US Active Equity Mama Attiglah, (L)* Alejandro Gaba* Ron Guido, Ph. D (L)* Ami Teruya* Wilson Thong (S) Jonathan Whiteoak, Ph. D (S) Tim Ye, Ph. D (S) Enhanced Equity Market Neutral Equity and Trading Fixed Income Asset Allocation Overlay and Currency Alejandro Gaba* Stuart Hall, CFA* Eldar Nigmatullin, Ph. D* Vladimir Zdorovtsov, Ph. D Market Neutral Equity Andrea Au Zhan Onayev, Ph. D Trading Stuart Hall, CFA* Eldar Nigmatullin, Ph. D* V. T. Alaganar, Ph. D (S) Ron Guido, Ph. D (L)* Carlos Morales, Ph. D Ritika Puri Thomas Tziortziotis* (L) Ralph Smith, CFA (L) Asset Allocation/Overlay Mama Attiglah, (L)* Craig Edwards, Ph. D* Andrei Serjantov, Ph. D (L) Ritirupa Samanta, Ph. D* Ami Teruya* Currency Craig Edwards, Ph. D* Ritirupa Samanta, Ph. D* Thomas Tziortziotis* 32
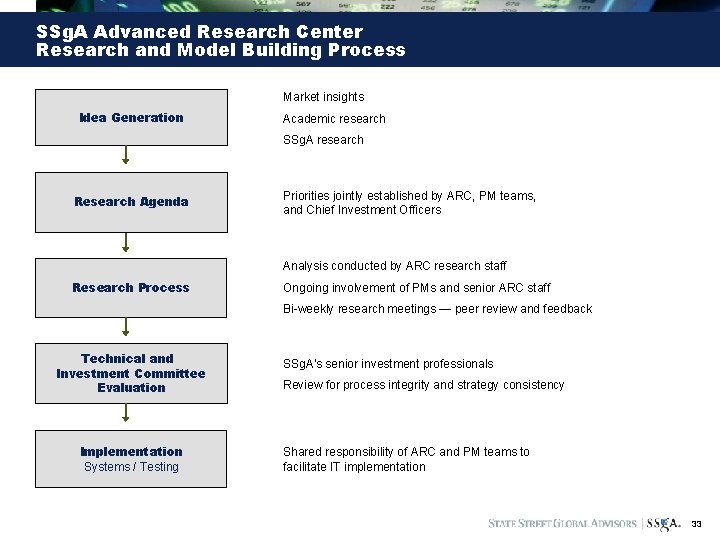
SSg. A Advanced Research Center Research and Model Building Process Market insights Idea Generation Academic research SSg. A research Research Agenda Priorities jointly established by ARC, PM teams, and Chief Investment Officers Analysis conducted by ARC research staff Research Process Ongoing involvement of PMs and senior ARC staff Bi-weekly research meetings — peer review and feedback Technical and Investment Committee Evaluation Implementation Systems / Testing SSg. A’s senior investment professionals Review for process integrity and strategy consistency Shared responsibility of ARC and PM teams to facilitate IT implementation 33
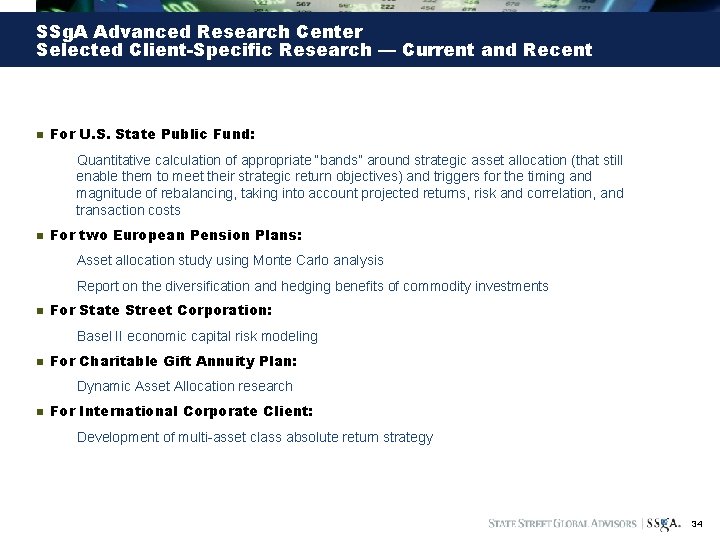
SSg. A Advanced Research Center Selected Client-Specific Research — Current and Recent n For U. S. State Public Fund: Quantitative calculation of appropriate “bands” around strategic asset allocation (that still enable them to meet their strategic return objectives) and triggers for the timing and magnitude of rebalancing, taking into account projected returns, risk and correlation, and transaction costs n For two European Pension Plans: Asset allocation study using Monte Carlo analysis Report on the diversification and hedging benefits of commodity investments n For State Street Corporation: Basel II economic capital risk modeling n For Charitable Gift Annuity Plan: Dynamic Asset Allocation research n For International Corporate Client: Development of multi-asset class absolute return strategy 34
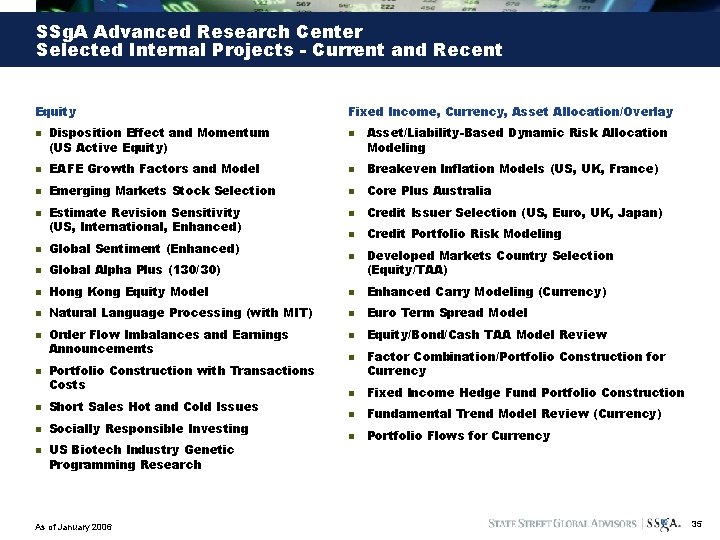
SSg. A Advanced Research Center Selected Internal Projects - Current and Recent Equity n Disposition Effect and Momentum (US Active Equity) Fixed Income, Currency, Asset Allocation/Overlay n Asset/Liability-Based Dynamic Risk Allocation Modeling n EAFE Growth Factors and Model n Breakeven Inflation Models (US, UK, France) n Emerging Markets Stock Selection n Core Plus Australia n Credit Issuer Selection (US, Euro, UK, Japan) n Credit Portfolio Risk Modeling n Estimate Revision Sensitivity (US, International, Enhanced) n Global Sentiment (Enhanced) n Global Alpha Plus (130/30) n Hong Kong Equity Model n Enhanced Carry Modeling (Currency) n Natural Language Processing (with MIT) n Euro Term Spread Model n Equity/Bond/Cash TAA Model Review n n Order Flow Imbalances and Earnings Announcements Portfolio Construction with Transactions Costs n Short Sales Hot and Cold Issues n Socially Responsible Investing n US Biotech Industry Genetic Programming Research As of January 2006 n n Developed Markets Country Selection (Equity/TAA) Factor Combination/Portfolio Construction for Currency n Fixed Income Hedge Fund Portfolio Construction n Fundamental Trend Model Review (Currency) n Portfolio Flows for Currency 35
Appendix B: Sample Futures Baskets
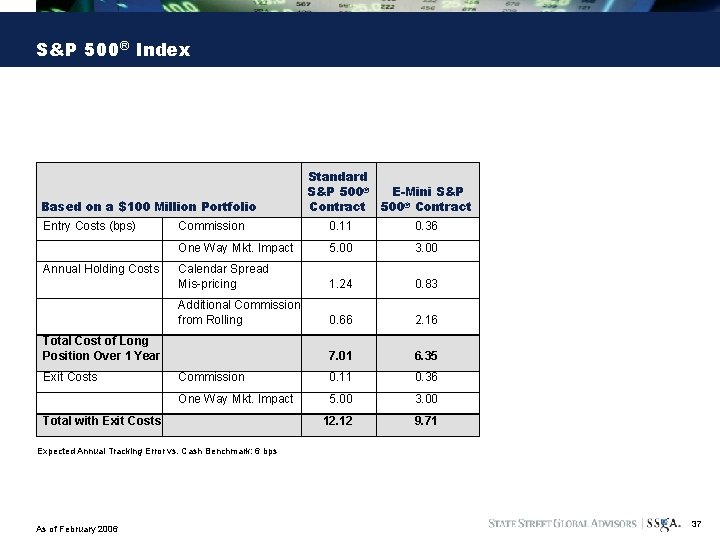
S&P 500® Index Based on a $100 Million Portfolio Entry Costs (bps) Annual Holding Costs Commission 0. 11 0. 36 One Way Mkt. Impact 5. 00 3. 00 Calendar Spread Mis-pricing 1. 24 0. 83 Additional Commission from Rolling 0. 66 2. 16 7. 01 6. 35 Commission 0. 11 0. 36 One Way Mkt. Impact 5. 00 3. 00 12. 12 9. 71 Total Cost of Long Position Over 1 Year Exit Costs Standard S&P 500® E-Mini S&P Contract 500® Contract Total with Exit Costs Expected Annual Tracking Error vs. Cash Benchmark: 6 bps As of February 2006 37
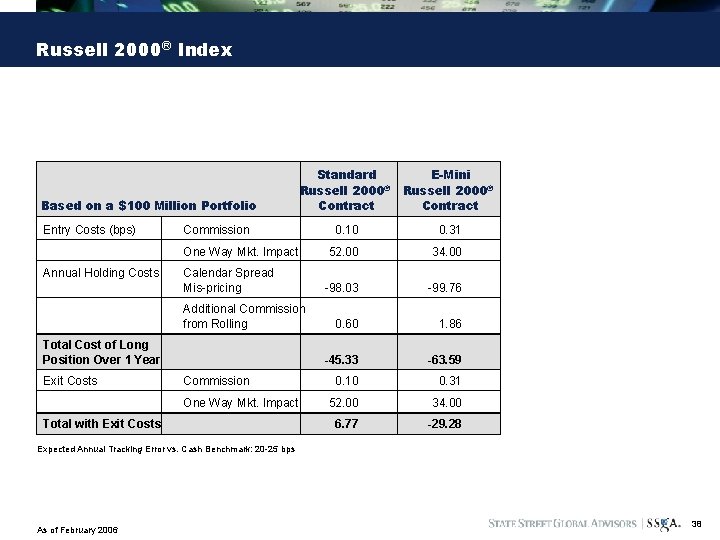
Russell 2000® Index Based on a $100 Million Portfolio Entry Costs (bps) Standard Russell 2000® Contract E-Mini Russell 2000® Contract 0. 10 0. 31 52. 00 34. 00 -98. 03 -99. 76 0. 60 1. 86 -45. 33 -63. 59 0. 10 0. 31 52. 00 34. 00 6. 77 -29. 28 Commission One Way Mkt. Impact Annual Holding Costs Calendar Spread Mis-pricing Additional Commission from Rolling Total Cost of Long Position Over 1 Year Exit Costs Commission One Way Mkt. Impact Total with Exit Costs Expected Annual Tracking Error vs. Cash Benchmark: 20 -25 bps As of February 2006 38
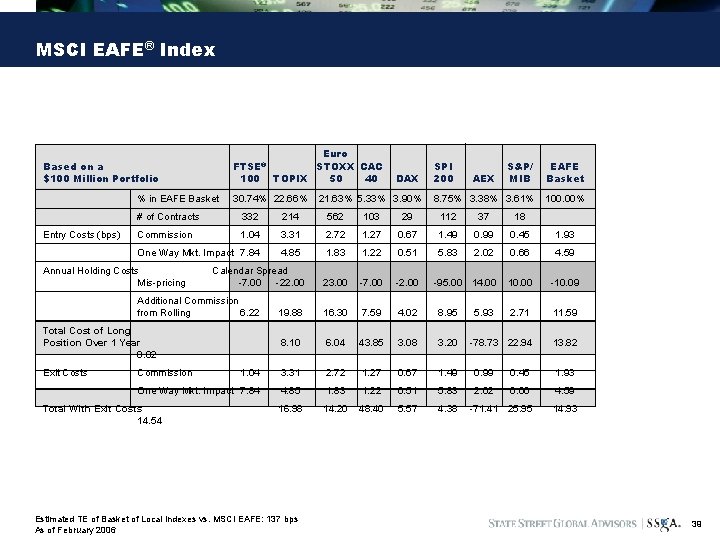
MSCI EAFE® Index Euro FTSE® STOXX CAC 100 TOPIX 50 40 Based on a $100 Million Portfolio % in EAFE Basket Entry Costs (bps) 30. 74% 22. 66% 21. 63% 5. 33% 3. 90% SPI 200 S&P/ MIB EAFE Basket 8. 75% 3. 38% 3. 61% 100. 00% AEX # of Contracts 332 214 562 103 29 112 37 18 Commission 1. 04 3. 31 2. 72 1. 27 0. 67 1. 49 0. 99 0. 45 1. 93 One Way Mkt. Impact 7. 84 4. 85 1. 83 1. 22 0. 51 5. 83 2. 02 0. 66 4. 59 23. 00 -7. 00 -2. 00 -95. 00 14. 00 10. 00 -10. 09 19. 88 16. 30 7. 59 4. 02 8. 95 2. 71 11. 59 8. 10 6. 04 43. 85 3. 08 3. 20 -78. 73 22. 94 13. 82 1. 04 3. 31 2. 72 1. 27 0. 67 1. 49 0. 99 0. 45 1. 93 One Way Mkt. Impact 7. 84 4. 85 1. 83 1. 22 0. 51 5. 83 2. 02 0. 66 4. 59 16. 98 14. 20 48. 40 5. 57 4. 38 -71. 41 25. 95 14. 93 Annual Holding Costs Mis-pricing Calendar Spread -7. 00 -22. 00 Additional Commission from Rolling 6. 22 Total Cost of Long Position Over 1 Year 8. 02 Exit Costs DAX Commission Total With Exit Costs 14. 54 Estimated TE of Basket of Local Indexes vs. MSCI EAFE: 137 bps As of February 2006 5. 93 39
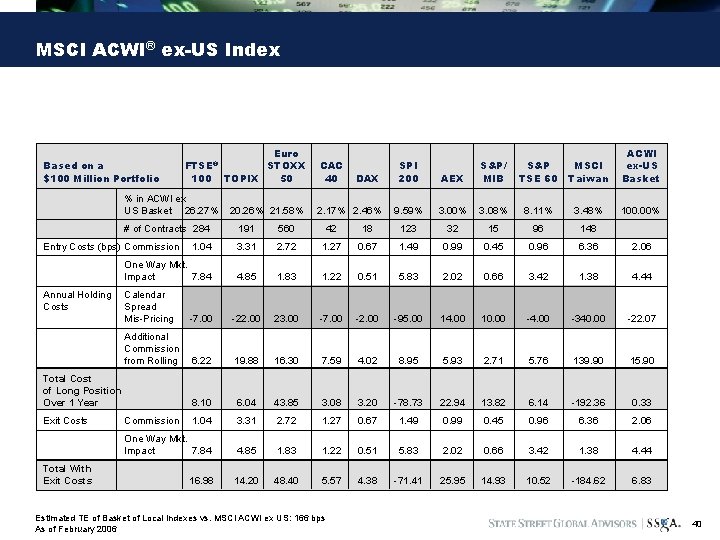
MSCI ACWI® ex-US Index Based on a $100 Million Portfolio Euro FTSE® STOXX 100 TOPIX 50 % in ACWI ex US Basket 26. 27% # of Contracts 284 Total With Exit Costs 2. 17% 2. 46% AEX S&P TSE 60 MSCI Taiwan ACWI ex-US Basket 9. 59% 3. 00% 3. 08% 8. 11% 3. 48% 100. 00% 560 42 18 123 32 15 96 148 1. 04 3. 31 2. 72 1. 27 0. 67 1. 49 0. 99 0. 45 0. 96 6. 36 2. 06 One Way Mkt. Impact 7. 84 4. 85 1. 83 1. 22 0. 51 5. 83 2. 02 0. 66 3. 42 1. 38 4. 44 Calendar Spread Mis-Pricing -7. 00 -22. 00 23. 00 -7. 00 -2. 00 -95. 00 14. 00 10. 00 -4. 00 -340. 00 -22. 07 Additional Commission from Rolling 6. 22 19. 88 16. 30 7. 59 4. 02 8. 95 5. 93 2. 71 5. 76 139. 90 15. 90 8. 10 6. 04 43. 85 3. 08 3. 20 -78. 73 22. 94 13. 82 6. 14 -192. 36 0. 33 1. 04 3. 31 2. 72 1. 27 0. 67 1. 49 0. 99 0. 45 0. 96 6. 36 2. 06 One Way Mkt. Impact 7. 84 4. 85 1. 83 1. 22 0. 51 5. 83 2. 02 0. 66 3. 42 1. 38 4. 44 16. 98 14. 20 48. 40 5. 57 4. 38 -71. 41 25. 95 14. 93 10. 52 -184. 62 6. 83 Total Cost of Long Position Over 1 Year Exit Costs DAX S&P/ MIB SPI 200 191 Entry Costs (bps) Commission Annual Holding Costs 20. 26% 21. 58% CAC 40 Commission Estimated TE of Basket of Local Indexes vs. MSCI ACWI ex US: 166 bps As of February 2006 40
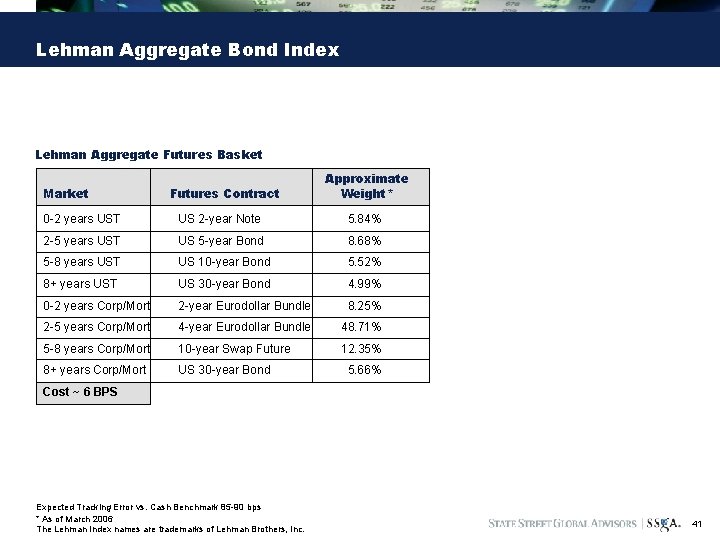
Lehman Aggregate Bond Index Lehman Aggregate Futures Basket Market Futures Contract Approximate Weight* 0 -2 years UST US 2 -year Note 5. 84% 2 -5 years UST US 5 -year Bond 8. 68% 5 -8 years UST US 10 -year Bond 5. 52% 8+ years UST US 30 -year Bond 4. 99% 0 -2 years Corp/Mort 2 -year Eurodollar Bundle 8. 25% 2 -5 years Corp/Mort 4 -year Eurodollar Bundle 48. 71% 5 -8 years Corp/Mort 10 -year Swap Future 12. 35% 8+ years Corp/Mort US 30 -year Bond 5. 66% Cost ~ 6 BPS Expected Tracking Error vs. Cash Benchmark 85 -90 bps * As of March 2006 The Lehman Index names are trademarks of Lehman Brothers, Inc. 41
Appendix C: Exposure Reporting
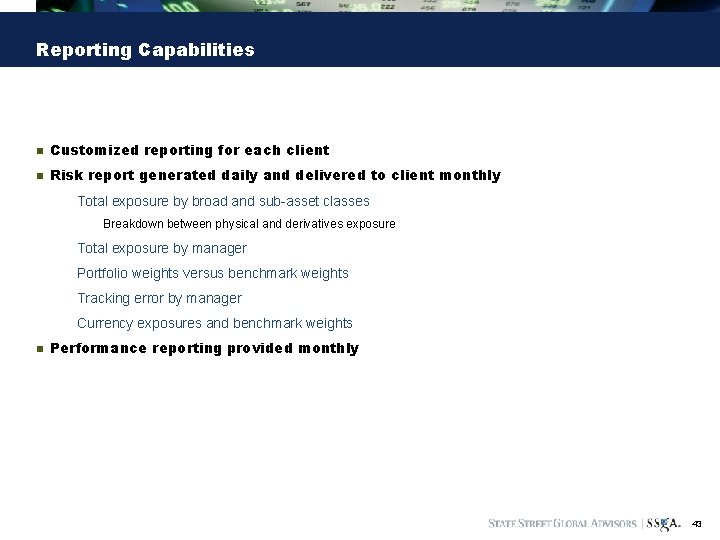
Reporting Capabilities n Customized reporting for each client n Risk report generated daily and delivered to client monthly Total exposure by broad and sub-asset classes Breakdown between physical and derivatives exposure Total exposure by manager Portfolio weights versus benchmark weights Tracking error by manager Currency exposures and benchmark weights n Performance reporting provided monthly 43
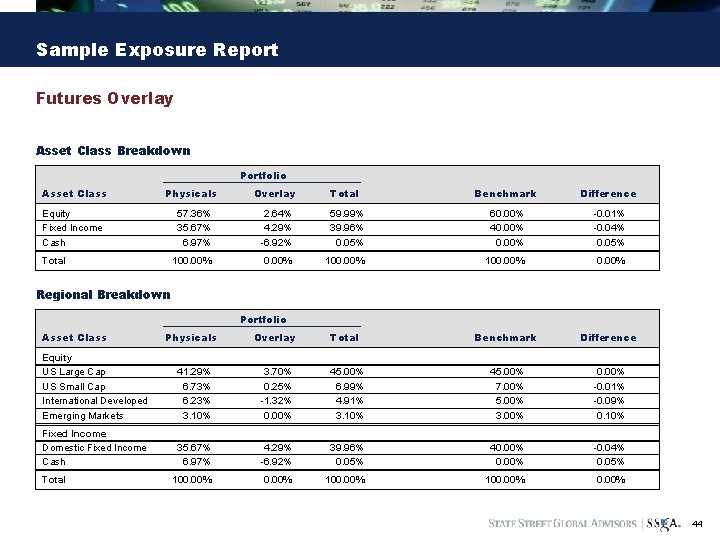
Sample Exposure Report Futures Overlay Asset Class Breakdown Portfolio Asset Class Physicals Equity Fixed Income Cash Total Overlay Total Benchmark Difference 57. 36% 35. 67% 6. 97% 2. 64% 4. 29% -6. 92% 59. 99% 39. 96% 0. 05% 60. 00% 40. 00% -0. 01% -0. 04% 0. 05% 100. 00% 0. 00% Overlay Total Benchmark Difference Regional Breakdown Portfolio Asset Class Physicals Equity US Large Cap US Small Cap International Developed Emerging Markets 41. 29% 6. 73% 6. 23% 3. 10% 3. 70% 0. 25% -1. 32% 0. 00% 45. 00% 6. 99% 4. 91% 3. 10% 45. 00% 7. 00% 5. 00% 3. 00% 0. 00% -0. 01% -0. 09% 0. 10% Fixed Income Domestic Fixed Income Cash 35. 67% 6. 97% 4. 29% -6. 92% 39. 96% 0. 05% 40. 00% -0. 04% 0. 05% 100. 00% 0. 00% Total 44
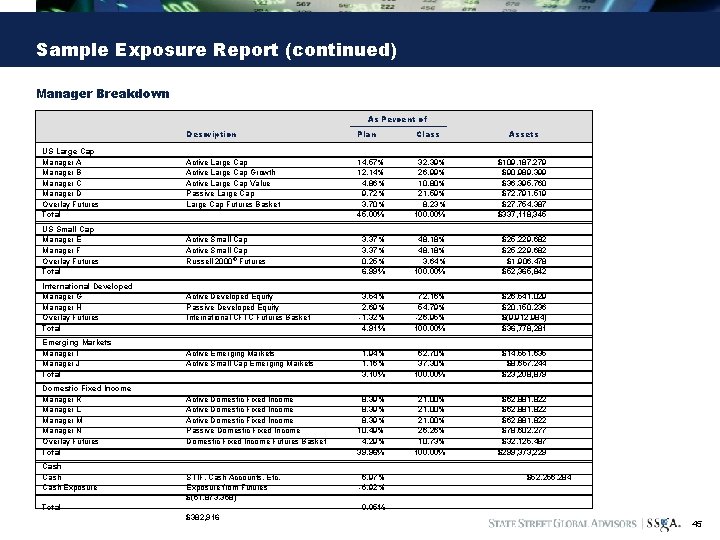
Sample Exposure Report (continued) Manager Breakdown As Percent of Description Plan Class Assets US Large Cap Manager A Manager B Manager C Manager D Overlay Futures Total Active Large Cap Growth Active Large Cap Value Passive Large Cap Futures Basket 14. 57% 12. 14% 4. 86% 9. 72% 3. 70% 45. 00% 32. 39% 26. 99% 10. 80% 21. 59% 8. 23% 100. 00% $109, 187, 279 $90, 989, 399 $36, 395, 760 $72, 791, 519 $27, 754, 387 $337, 118, 345 US Small Cap Manager E Manager F Overlay Futures Total Active Small Cap Russell 2000 ® Futures 3. 37% 0. 25% 6. 99% 48. 18% 3. 64% 100. 00% $25, 229, 682 $1, 906, 478 $52, 365, 842 International Developed Manager G Manager H Overlay Futures Total Active Developed Equity Passive Developed Equity International CFTC Futures Basket 3. 54% 2. 69% -1. 32% 4. 91% 72. 16% 54. 79% -26. 95% 100. 00% $26, 541, 029 $20, 150, 236 $(9, 912, 984) $36, 778, 281 Emerging Markets Manager I Manager J Total Active Emerging Markets Active Small Cap Emerging Markets 1. 94% 1. 16% 3. 10% 62. 70% 37. 30% 100. 00% $14, 551, 635 $8, 657, 244 $23, 208, 879 Domestic Fixed Income Manager K Manager L Manager M Manager N Overlay Futures Total Active Domestic Fixed Income Passive Domestic Fixed Income Futures Basket 8. 39% 10. 49% 4. 29% 39. 96% 21. 00% 26. 26% 10. 73% 100. 00% $62, 881, 822 $78, 602, 277 $32, 125, 487 $299, 373, 229 STIF, Cash Accounts, Etc. Exposure from Futures $(51, 873, 368) 6. 97% -6. 92% Cash Exposure Total $52, 256, 284 0. 05% $382, 916 45
Appendix D: Biographies
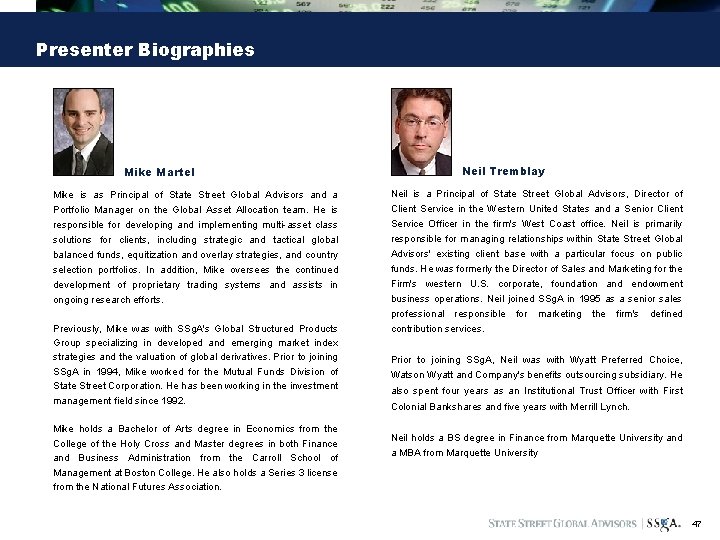
Presenter Biographies Mike Martel Neil Tremblay Mike is as Principal of State Street Global Advisors and a Portfolio Manager on the Global Asset Allocation team. He is Neil is a Principal of State Street Global Advisors, Director of Client Service in the Western United States and a Senior Client responsible for developing and implementing multi-asset class solutions for clients, including strategic and tactical global balanced funds, equitization and overlay strategies, and country selection portfolios. In addition, Mike oversees the continued development of proprietary trading systems and assists in ongoing research efforts. Service Officer in the firm's West Coast office. Neil is primarily responsible for managing relationships within State Street Global Advisors' existing client base with a particular focus on public funds. He was formerly the Director of Sales and Marketing for the Firm's western U. S. corporate, foundation and endowment business operations. Neil joined SSg. A in 1995 as a senior sales professional responsible for marketing the firm's defined contribution services. Previously, Mike was with SSg. A's Global Structured Products Group specializing in developed and emerging market index strategies and the valuation of global derivatives. Prior to joining SSg. A in 1994, Mike worked for the Mutual Funds Division of State Street Corporation. He has been working in the investment management field since 1992. Mike holds a Bachelor of Arts degree in Economics from the College of the Holy Cross and Master degrees in both Finance and Business Administration from the Carroll School of Management at Boston College. He also holds a Series 3 license from the National Futures Association. Prior to joining SSg. A, Neil was with Wyatt Preferred Choice, Watson Wyatt and Company's benefits outsourcing subsidiary. He also spent four years as an Institutional Trust Officer with First Colonial Bankshares and five years with Merrill Lynch. Neil holds a BS degree in Finance from Marquette University and a MBA from Marquette University 47
Appendix E: Legal Disclosures
Trademarks Dow Jones & Company, Inc. is the owner of the trademarks and copyrights relating to the Dow Jones Indexes. “FTSE®”, "FT-SE®" and "Footsie®" are trade marks jointly owned by the London Stock Exchange Plc and The Financial Times Limited and are used by FTSE International Limited under licence. “All-World”, “All-Share” and “All. Small” are trade marks of FTSE International Limited. GSCI® is a registered mark of Goldman, Sachs & Co. The IFC Investable Indexes are service marks of International Finance Corporation. The Lehman Index names are trademarks of Lehman Brothers, Inc. The MSCI financial products described herein are indexed to an MSCI index. The MSCI financial products referred to herein are not sponsored, endorsed, or promoted by MSCI, and MSCI bears no liability with respect to any such financial products or any index on which such financial products are based. The MSCI/Barra index names are trademarks of Barra, Inc. Each Russell Index is a trademark of the Frank Russell Company. Russell™ is a trademark of the Frank Russell Company. Each Standard & Poor’s Index is a trademark of The Mc. Graw-Hill Companies, Inc. and has been licensed for use by State Street Bank and Trust Company. The product is not sponsored, endorsed, sold or promoted by Standard & Poor’s and Standard & Poor’s makes no representation regarding the advisability of investing in the Product. Each Dow Jones/Wilshire Index is calculated by Dow Jones & Company, Inc. and licensed to State Street Bank and Trust Company. The financial products are not sponsored, endorsed, sold or promoted by Dow Jones and Dow Jones makes no representation regarding the advisability of investing in the financial products. Dow Jones bears no liability with respect to any such financial products or any index on which such financial products are based. 49