
Fresno County Employees Retirement Association AssetLiability Study October
Fresno County Employees’ Retirement Association Asset/Liability Study October 6 th & 7 Th, 2004 Jeffrey Mac. Lean President SEATTLE 999 Third Avenue Suite 3650 Seattle, Washington 98104 206. 622. 3700 telephone 206. 622. 0548 facsimile LOS ANGELES 2321 Rosecrans Avenue Suite 2250 El Segundo, California 90245 310. 297. 1777 telephone 310. 297. 0878 facsimile
T able of Contents I. Introduction V. Appendix • Introduction……………………… 3 • Return Assumptions – Inflation……………. 45 • Historical Funding Data…………………. . 9 • Return Assumptions – Bonds…………… 46 • Historical Contributions………………… 12 • Return Assumptions – Equity…………… 49 • Return Assumptions – Small Stocks…………………. . 55 II. Asset Assumptions • Asset Class Selection…………………. 16 • Return Assumptions – International…………………. 57 • Return and Risk Assumptions……………… 17 • Consensus Expectations……………… 60 • Efficient Portfolios……………………. . 24 • Active Management Alpha Assumptions……………. . . 61 • Rolling 10 Year Annual Standard Deviations………… 63 III. Deterministic Scenario • Funded Ratios………………………. 27 • Assumptions for the Study……………… 64 • Contributions………………………. . 28 • Glossary of Terms…………………. 65 IV. Stochastic Scenario • Compound Returns…………………… 32 • Funded Ratios………. ………………… 34 • Contributions………………. 36 Wurts & Associates Fresno County Employees’ Retirement Association PAGE 2
INTRODUCTION Wurts & Associates Fresno County Employees’ Retirement Association PAGE 3
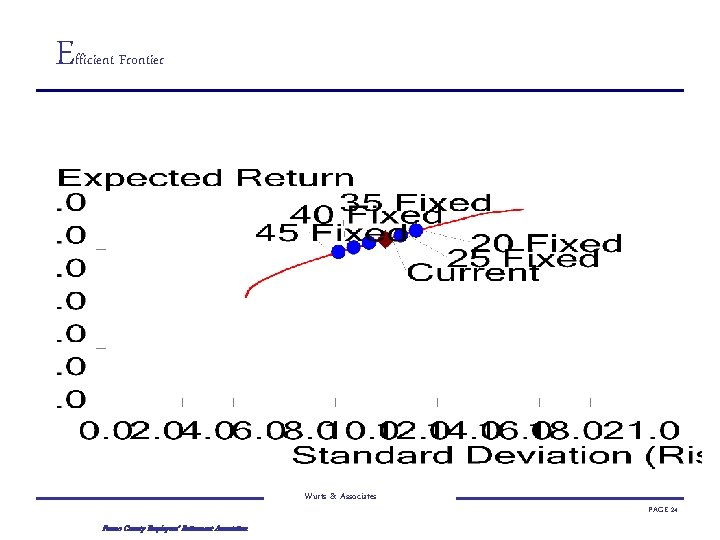
I ntroduction • Fresno County Employee Retirement Association (FCERA) has engaged Wurts & Associates and Public Pension Professionals, Inc. (P³) to conduct an asset-liability study for its public pension fund for the purpose of gaining an in-depth understanding of its liabilities and its current asset allocation. Other stock and bond mixes were observed to offer a comparative analysis with FCERA’s current allocation. Results of the analysis is provided in this report. • P³ provided the liability files in Pro. Val format to Wurts and Associates. Pro. Val is the software used to do the asset-liability study. • The asset assumptions were developed using the building block method. Wurts & Associates employed a risk premium method to assign expected returns for equities. Risk and correlation assumptions were developed from Wurts & Associates’ analysis of these historic relationships. Six efficient portfolios ranging from 55/45 to 80/20 were identified using Mean Variance Optimization. • We observed a deterministic case and stochastic cases: – In a deterministic case we assume we know what will happen in the future. We make our assumption and project the scenario. – In a stochastic case we make assumptions about input parameters and vary them projecting many scenarios (in this case, 2000 scenarios) and then summarizing the results by looking at the distribution (percentiles) of the results. The projection is from 2003 -2013 (fiscal years). • For the study, we considered the asset classes that FCERA currently holds in its portfolio. We modeled six (including current allocation) portfolios, ranging from 20% to 45% allocated to fixed income. We show comparative results for these six portfolios for various measures such as: – Required funding contributions and – Funded status Wurts & Associates Fresno County Employees’ Retirement Association 1 PAGE 4
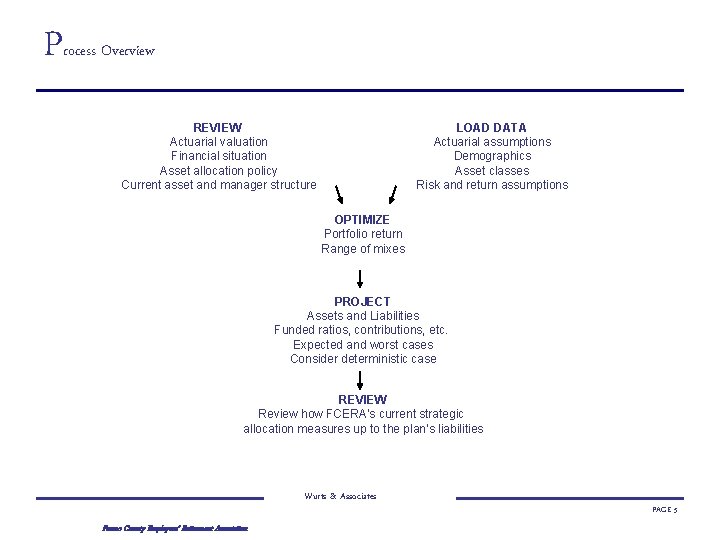
P rocess Overview REVIEW Actuarial valuation Financial situation Asset allocation policy Current asset and manager structure LOAD DATA Actuarial assumptions Demographics Asset classes Risk and return assumptions OPTIMIZE Portfolio return Range of mixes PROJECT Assets and Liabilities Funded ratios, contributions, etc. Expected and worst cases Consider deterministic case REVIEW Review how FCERA’s current strategic allocation measures up to the plan’s liabilities Wurts & Associates Fresno County Employees’ Retirement Association PAGE 5
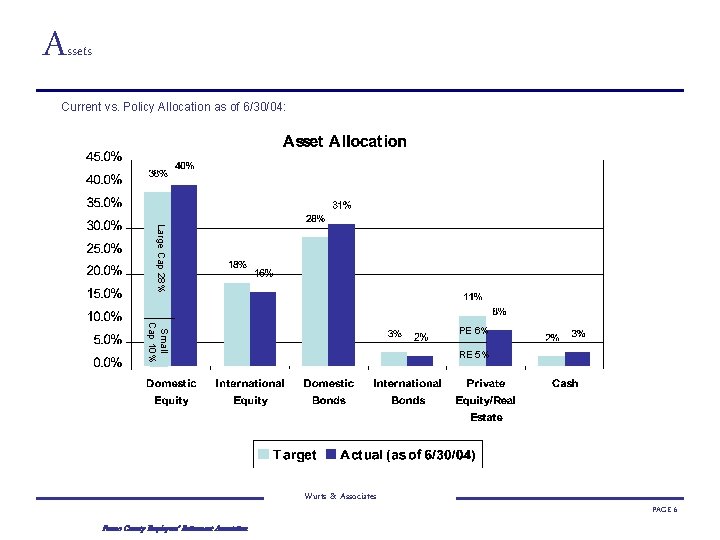
A ssets Current vs. Policy Allocation as of 6/30/04: Large Cap 28% Small Cap 10% PE 6% RE 5% Wurts & Associates Fresno County Employees’ Retirement Association PAGE 6
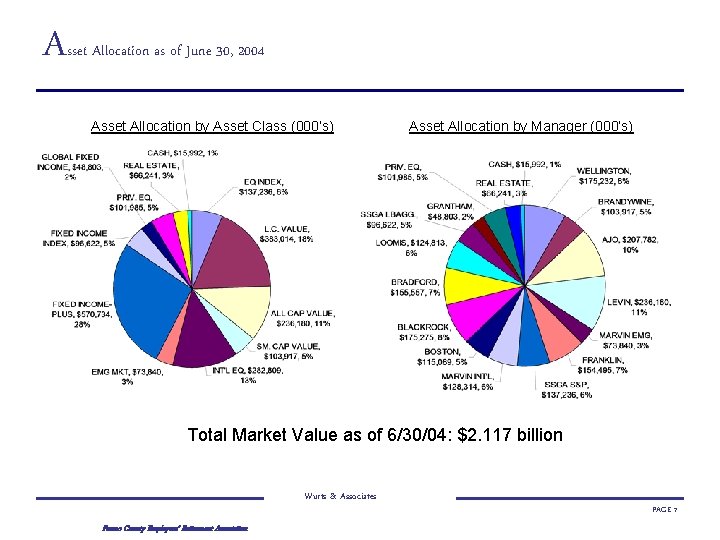
A sset Allocation as of June 30, 2004 Asset Allocation by Asset Class (000’s) Asset Allocation by Manager (000’s) Total Market Value as of 6/30/04: $2. 117 billion Wurts & Associates Fresno County Employees’ Retirement Association PAGE 7
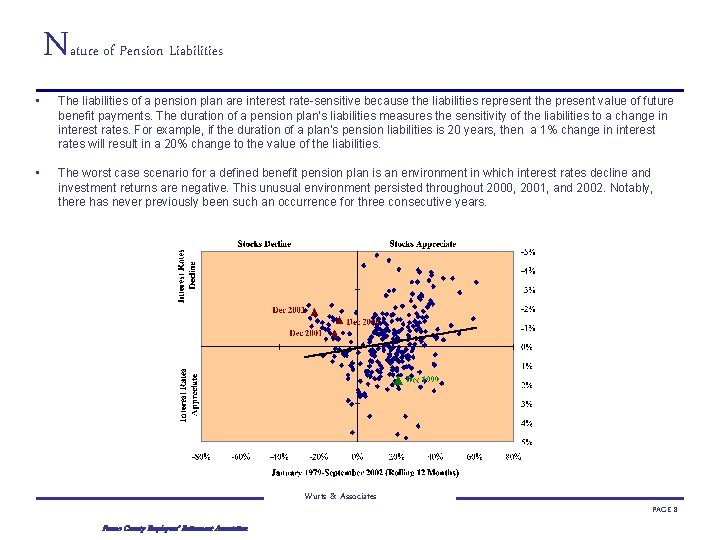
N ature of Pension Liabilities • The liabilities of a pension plan are interest rate-sensitive because the liabilities represent the present value of future benefit payments. The duration of a pension plan’s liabilities measures the sensitivity of the liabilities to a change in interest rates. For example, if the duration of a plan’s pension liabilities is 20 years, then a 1% change in interest rates will result in a 20% change to the value of the liabilities. • The worst case scenario for a defined benefit pension plan is an environment in which interest rates decline and investment returns are negative. This unusual environment persisted throughout 2000, 2001, and 2002. Notably, there has never previously been such an occurrence for three consecutive years. Wurts & Associates Fresno County Employees’ Retirement Association PAGE 8
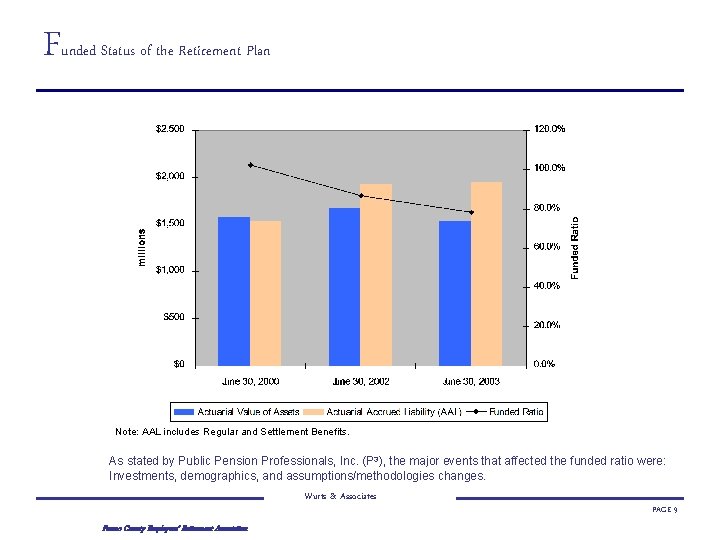
F unded Status of the Retirement Plan Note: AAL includes Regular and Settlement Benefits. As stated by Public Pension Professionals, Inc. (P 3), the major events that affected the funded ratio were: Investments, demographics, and assumptions/methodologies changes. Wurts & Associates Fresno County Employees’ Retirement Association PAGE 9
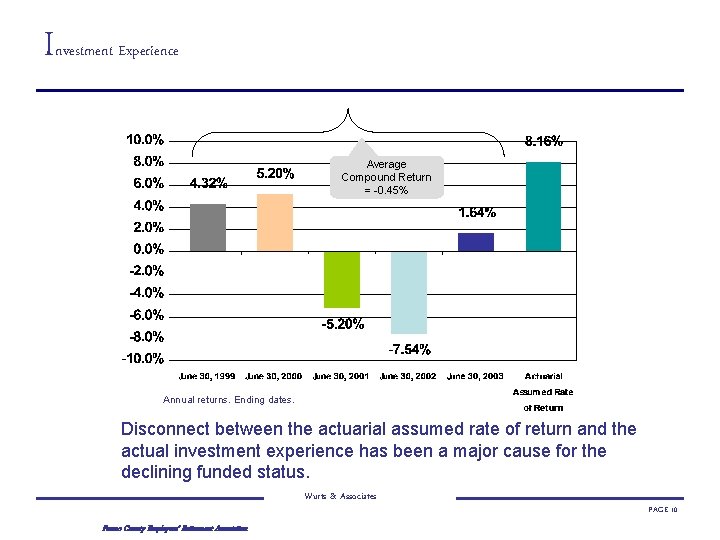
I nvestment Experience Average Compound Return = -0. 45% Annual returns. Ending dates. Disconnect between the actuarial assumed rate of return and the actual investment experience has been a major cause for the declining funded status. Wurts & Associates Fresno County Employees’ Retirement Association PAGE 10
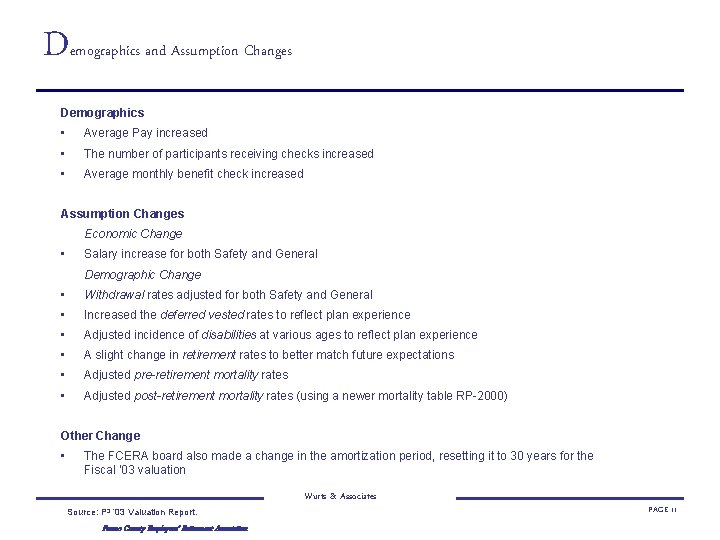
D emographics and Assumption Changes Demographics • Average Pay increased • The number of participants receiving checks increased • Average monthly benefit check increased Assumption Changes Economic Change • Salary increase for both Safety and General Demographic Change • Withdrawal rates adjusted for both Safety and General • Increased the deferred vested rates to reflect plan experience • Adjusted incidence of disabilities at various ages to reflect plan experience • A slight change in retirement rates to better match future expectations • Adjusted pre-retirement mortality rates • Adjusted post-retirement mortality rates (using a newer mortality table RP-2000) Other Change • The FCERA board also made a change in the amortization period, resetting it to 30 years for the Fiscal ’ 03 valuation Source: P 3 ’ 03 Valuation Report. Fresno County Employees’ Retirement Association Wurts & Associates PAGE 11
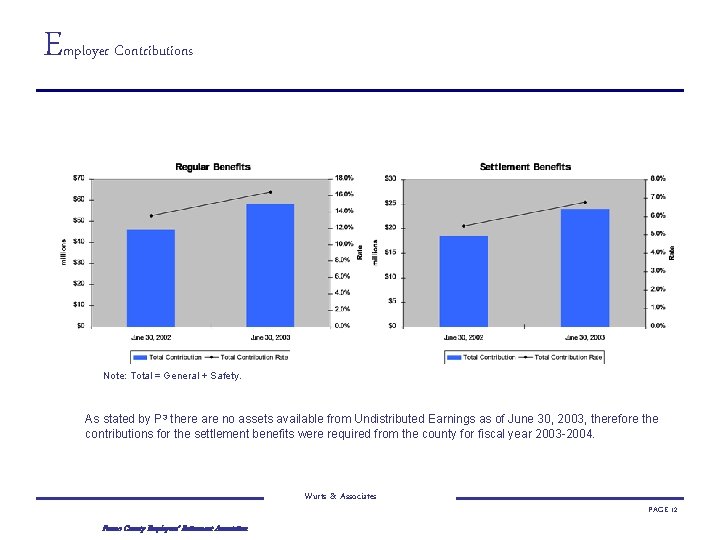
E mployer Contributions Note: Total = General + Safety. As stated by P 3 there are no assets available from Undistributed Earnings as of June 30, 2003, therefore the contributions for the settlement benefits were required from the county for fiscal year 2003 -2004. Wurts & Associates Fresno County Employees’ Retirement Association PAGE 12
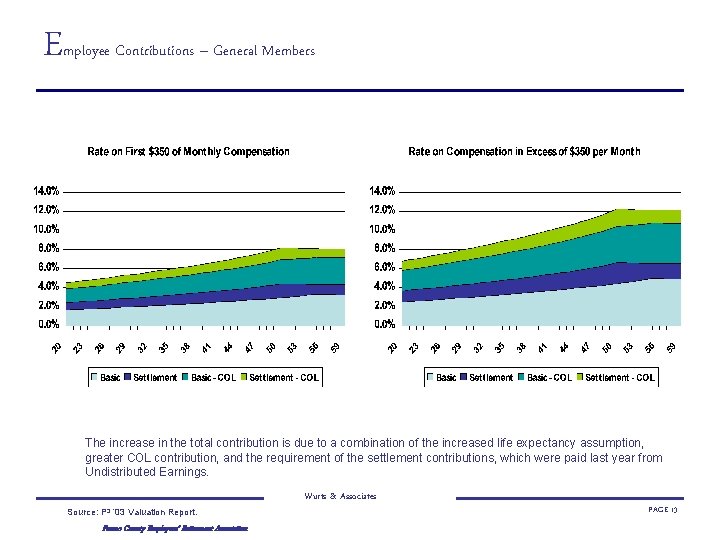
E mployee Contributions – General Members The increase in the total contribution is due to a combination of the increased life expectancy assumption, greater COL contribution, and the requirement of the settlement contributions, which were paid last year from Undistributed Earnings. Source: P 3 ’ 03 Valuation Report. Fresno County Employees’ Retirement Association Wurts & Associates PAGE 13
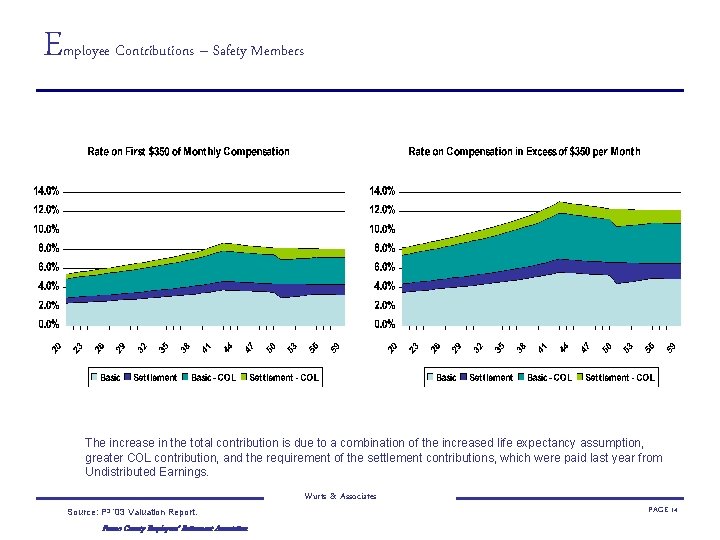
E mployee Contributions – Safety Members The increase in the total contribution is due to a combination of the increased life expectancy assumption, greater COL contribution, and the requirement of the settlement contributions, which were paid last year from Undistributed Earnings. Source: P 3 ’ 03 Valuation Report. Fresno County Employees’ Retirement Association Wurts & Associates PAGE 14
ASSET ASSUMPTIONS Wurts & Associates Fresno County Employees’ Retirement Association PAGE 15
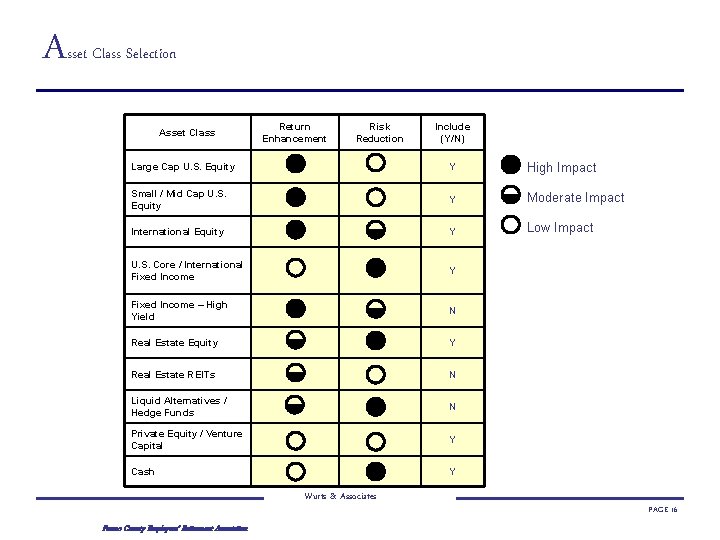
A sset Class Selection Asset Class Return Enhancement Risk Reduction Include (Y/N) Large Cap U. S. Equity Y High Impact Small / Mid Cap U. S. Equity Y Moderate Impact International Equity Y Low Impact U. S. Core / International Fixed Income Y Fixed Income – High Yield N Real Estate Equity Y Real Estate REITs N Liquid Alternatives / Hedge Funds N Private Equity / Venture Capital Y Cash Y Wurts & Associates Fresno County Employees’ Retirement Association PAGE 16
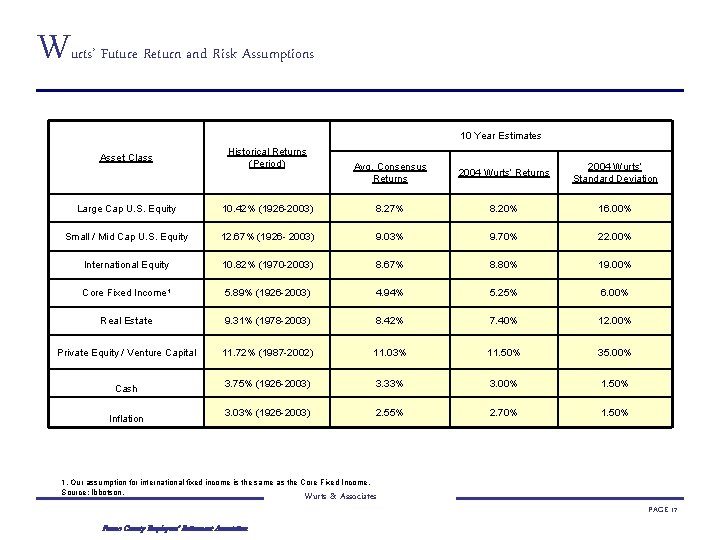
W urts’ Future Return and Risk Assumptions 10 Year Estimates Asset Class Historical Returns (Period) Avg. Consensus Returns 2004 Wurts’ Standard Deviation Large Cap U. S. Equity 10. 42% (1926 -2003) 8. 27% 8. 20% 16. 00% Small / Mid Cap U. S. Equity 12. 67% (1926 - 2003) 9. 03% 9. 70% 22. 00% International Equity 10. 82% (1970 -2003) 8. 67% 8. 80% 19. 00% Core Fixed Income¹ 5. 89% (1926 -2003) 4. 94% 5. 25% 6. 00% Real Estate 9. 31% (1978 -2003) 8. 42% 7. 40% 12. 00% Private Equity / Venture Capital 11. 72% (1987 -2002) 11. 03% 11. 50% 35. 00% Cash 3. 75% (1926 -2003) 3. 33% 3. 00% 1. 50% 3. 03% (1926 -2003) 2. 55% 2. 70% 1. 50% Inflation 1. Our assumption for international fixed income is the same as the Core Fixed Income. Source: Ibbotson. Wurts & Associates Fresno County Employees’ Retirement Association PAGE 17
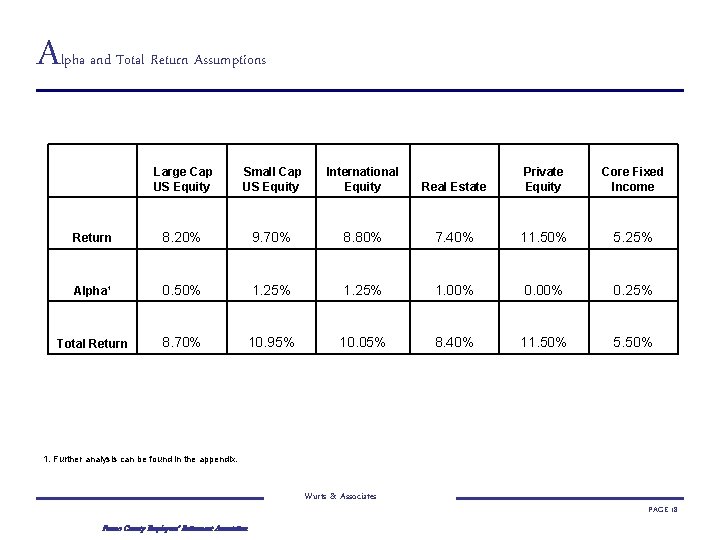
A lpha and Total Return Assumptions Large Cap US Equity Small Cap US Equity International Equity Real Estate Private Equity Core Fixed Income Return 8. 20% 9. 70% 8. 80% 7. 40% 11. 50% 5. 25% Alpha¹ 0. 50% 1. 25% 1. 00% 0. 25% Total Return 8. 70% 10. 95% 10. 05% 8. 40% 11. 50% 5. 50% 1. Further analysis can be found in the appendix. Wurts & Associates Fresno County Employees’ Retirement Association PAGE 18
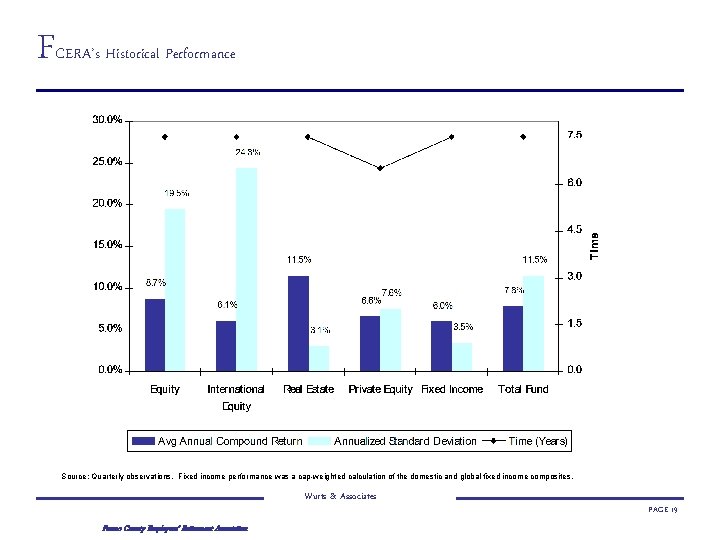
F CERA’s Historical Performance Source: Quarterly observations. Fixed income performance was a cap-weighted calculation of the domestic and global fixed income composites. Wurts & Associates Fresno County Employees’ Retirement Association PAGE 19
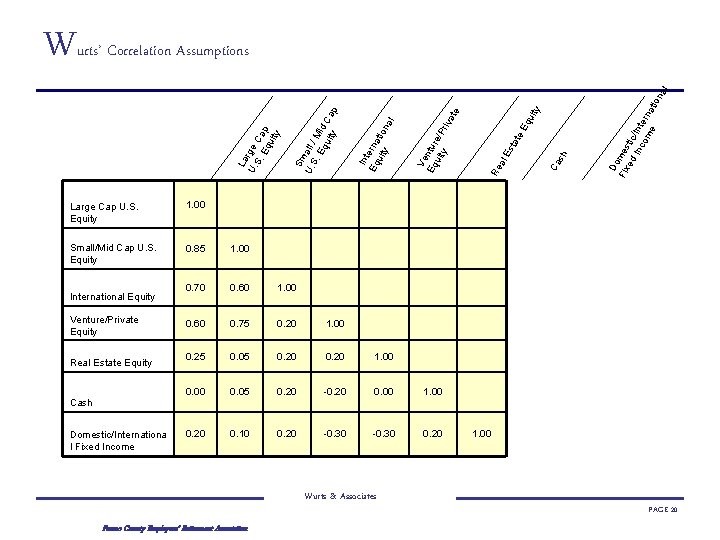
Large Cap U. S. Equity 1. 00 Small/Mid Cap U. S. Equity 0. 85 1. 00 0. 70 0. 60 1. 00 0. 60 0. 75 0. 20 1. 00 0. 25 0. 05 0. 20 1. 00 0. 05 0. 20 -0. 20 0. 00 1. 00 0. 20 0. 10 0. 20 -0. 30 0. 20 International Equity Venture/Private Equity Real Estate Equity Cash Domestic/Internationa l Fixed Income Wurts & Associates Fresno County Employees’ Retirement Association e E qu Ca sh tat al Es Re Do Fix mes ed tic In /In co ter me na tio ity ate Ve Eq ntur uit e/P y riv l Int Eq erna uit tio y na Sm U. all S. / M E qu id C ity ap na l urts’ Correlation Assumptions La U. rge S. Ca E qu p ity W 1. 00 PAGE 20
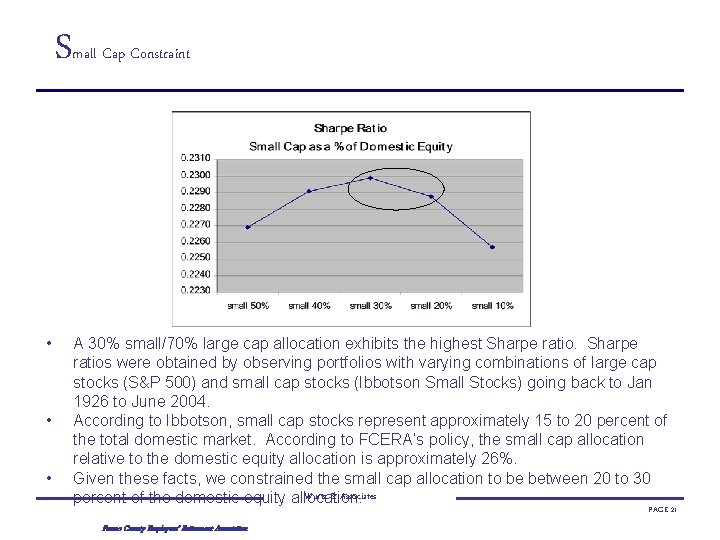
S • • • mall Cap Constraint A 30% small/70% large cap allocation exhibits the highest Sharpe ratios were obtained by observing portfolios with varying combinations of large cap stocks (S&P 500) and small cap stocks (Ibbotson Small Stocks) going back to Jan 1926 to June 2004. According to Ibbotson, small cap stocks represent approximately 15 to 20 percent of the total domestic market. According to FCERA’s policy, the small cap allocation relative to the domestic equity allocation is approximately 26%. Given these facts, we constrained the small cap allocation to be between 20 to 30 Wurts & Associates percent of the domestic equity allocation. PAGE 21 Fresno County Employees’ Retirement Association
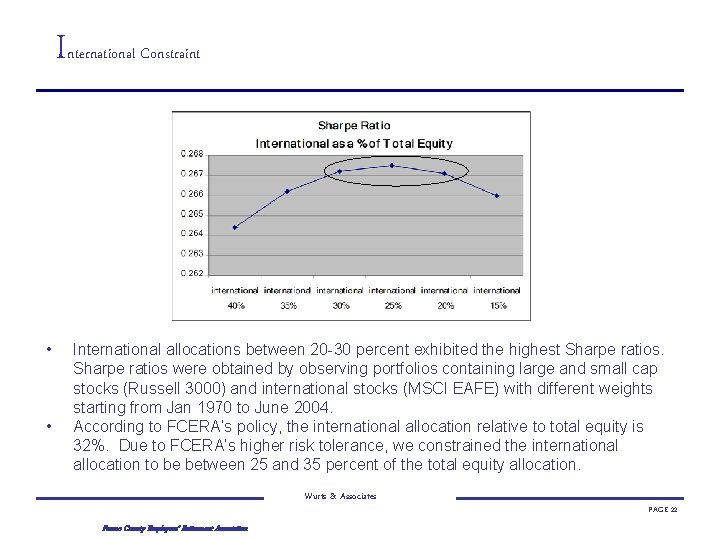
I • • nternational Constraint International allocations between 20 -30 percent exhibited the highest Sharpe ratios were obtained by observing portfolios containing large and small cap stocks (Russell 3000) and international stocks (MSCI EAFE) with different weights starting from Jan 1970 to June 2004. According to FCERA’s policy, the international allocation relative to total equity is 32%. Due to FCERA’s higher risk tolerance, we constrained the international allocation to be between 25 and 35 percent of the total equity allocation. Wurts & Associates Fresno County Employees’ Retirement Association PAGE 22
P rivate Equity and Real Estate Constraints Currently, the FCERA portfolio has an 11% allocation to private equity and real estate combined. The total equity allocation is 56% (28% Large Cap, 10% Small Cap, and 18% International). The combined private equity and real estate allocation is approximately 20% (11% / 56%) of the total equity allocation. We constrained private equity and real estate combined to be no more than 20% of the total equity portfolio due to the following reasons. • Private Equity (capped at 5% of total portfolio) – Liquidity issues – Lack of transparency – High volatility and fees – Relatively high correlation with equities • Real Estate – Liquidity issues Wurts & Associates Fresno County Employees’ Retirement Association PAGE 23
E fficient Frontier Wurts & Associates Fresno County Employees’ Retirement Association PAGE 24
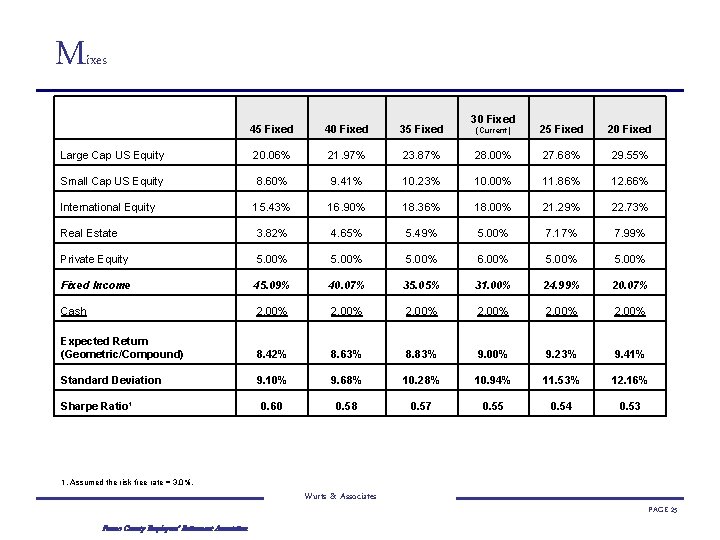
M ixes 45 Fixed 40 Fixed 35 Fixed Large Cap US Equity 20. 06% 21. 97% Small Cap US Equity 8. 60% International Equity 30 Fixed (Current) 25 Fixed 20 Fixed 23. 87% 28. 00% 27. 68% 29. 55% 9. 41% 10. 23% 10. 00% 11. 86% 12. 66% 15. 43% 16. 90% 18. 36% 18. 00% 21. 29% 22. 73% Real Estate 3. 82% 4. 65% 5. 49% 5. 00% 7. 17% 7. 99% Private Equity 5. 00% 6. 00% 5. 00% Fixed Income 45. 09% 40. 07% 35. 05% 31. 00% 24. 99% 20. 07% Cash 2. 00% Expected Return (Geometric/Compound) 8. 42% 8. 63% 8. 83% 9. 00% 9. 23% 9. 41% Standard Deviation 9. 10% 9. 68% 10. 28% 10. 94% 11. 53% 12. 16% 0. 60 0. 58 0. 57 0. 55 0. 54 0. 53 Sharpe Ratio¹ 1. Assumed the risk free rate = 3. 0%. Wurts & Associates Fresno County Employees’ Retirement Association PAGE 25
DETERMINISTIC SCENARIO Wurts & Associates Fresno County Employees’ Retirement Association PAGE 26
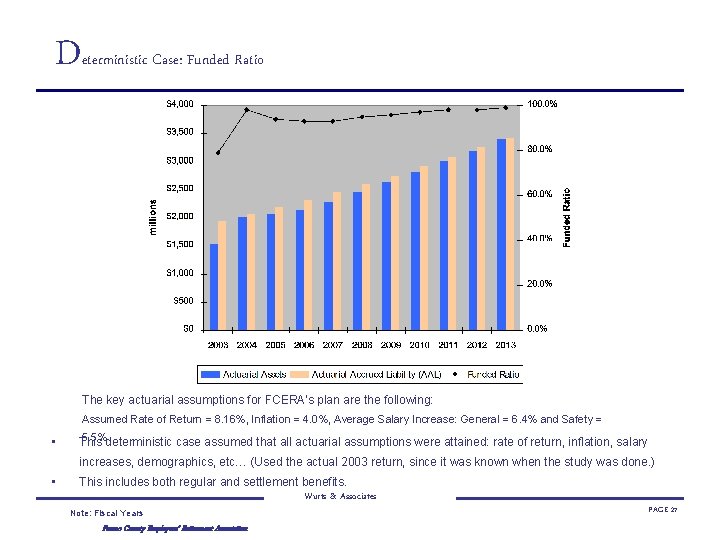
D eterministic Case: Funded Ratio The key actuarial assumptions for FCERA’s plan are the following: Assumed Rate of Return = 8. 16%, Inflation = 4. 0%, Average Salary Increase: General = 6. 4% and Safety = • 5. 5% This deterministic case assumed that all actuarial assumptions were attained: rate of return, inflation, salary increases, demographics, etc… (Used the actual 2003 return, since it was known when the study was done. ) • This includes both regular and settlement benefits. Wurts & Associates Note: Fiscal Years Fresno County Employees’ Retirement Association PAGE 27
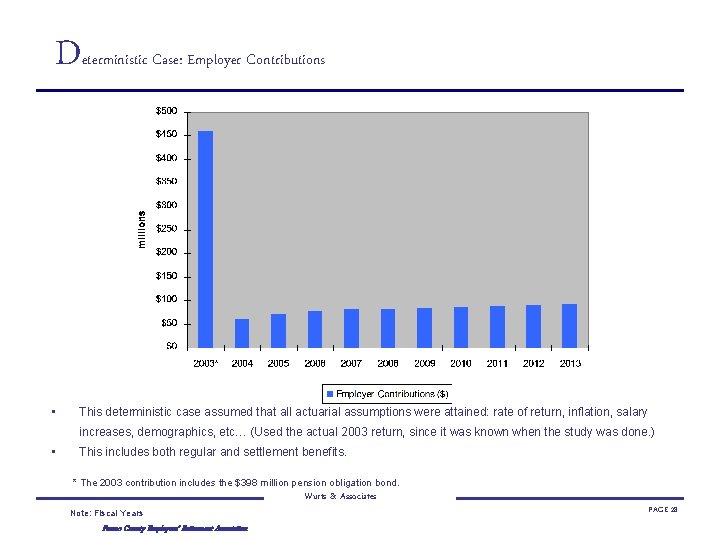
D • eterministic Case: Employer Contributions This deterministic case assumed that all actuarial assumptions were attained: rate of return, inflation, salary increases, demographics, etc… (Used the actual 2003 return, since it was known when the study was done. ) • This includes both regular and settlement benefits. * The 2003 contribution includes the $398 million pension obligation bond. Wurts & Associates Note: Fiscal Years Fresno County Employees’ Retirement Association PAGE 28
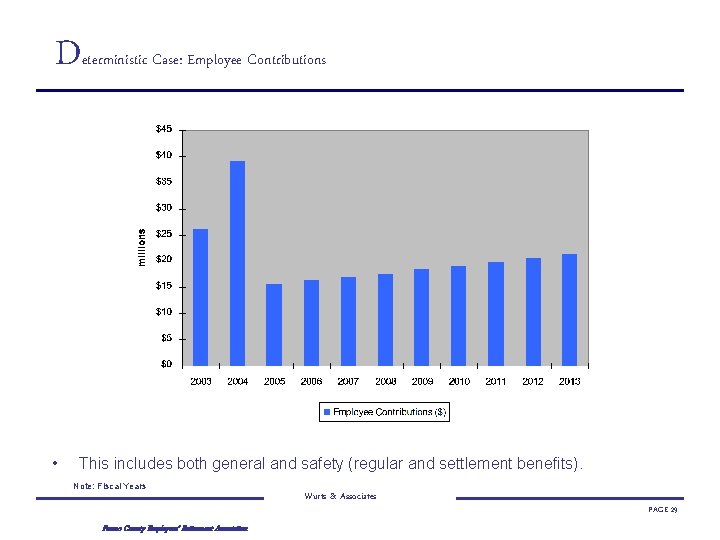
D • eterministic Case: Employee Contributions This includes both general and safety (regular and settlement benefits). Note: Fiscal Years Fresno County Employees’ Retirement Association Wurts & Associates PAGE 29

STOCHASTIC SCENARIO Wurts & Associates Fresno County Employees’ Retirement Association PAGE 30
S • tochastic Case The Stochastic Case uses the asset assumptions to simulate different return scenarios and incorporates that information with the liabilities. • The liabilities that get projected along with the assets were inputted into Pro. Val by P 3, since they use Pro. Val for their own clients. • Once the forecast is done, funded ratios and contributions are measured. • The forecast consists of 2, 000 scenarios. Each scenario is a potential path of what could happen in the next 10 years for asset returns. • Since there are 2, 000 scenarios, ranges (percentiles) for funded ratios and contributions are measured. Key: 5 th Percentile: Best Case • 25 th Percentile: Optimistic 50 th Percentile: Most Probable 75 th Percentile: Pessimistic 95 th Percentile: Worst Case The funded ratios and contributions are total numbers: Regular + Settlement Benefits. Wurts & Associates Fresno County Employees’ Retirement Association PAGE 31
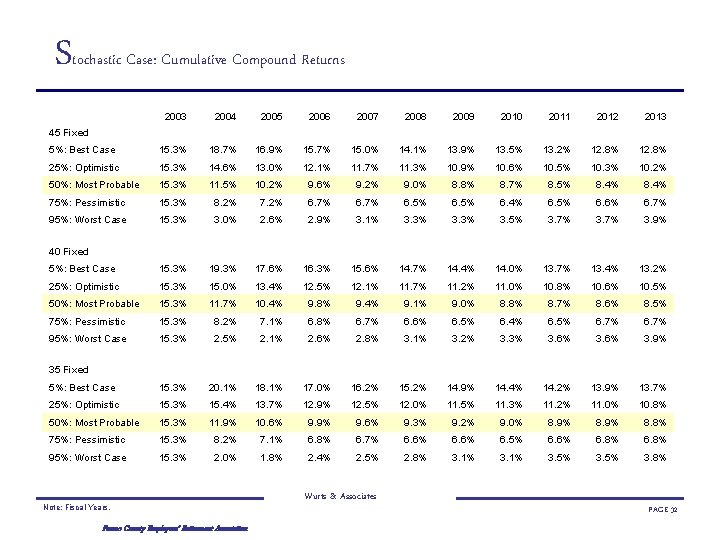
S tochastic Case: Cumulative Compound Returns 2003 2004 2005 2006 2007 2008 2009 2010 2011 2012 2013 5%: Best Case 15. 3% 18. 7% 16. 9% 15. 7% 15. 0% 14. 1% 13. 9% 13. 5% 13. 2% 12. 8% 25%: Optimistic 15. 3% 14. 6% 13. 0% 12. 1% 11. 7% 11. 3% 10. 9% 10. 6% 10. 5% 10. 3% 10. 2% 50%: Most Probable 15. 3% 11. 5% 10. 2% 9. 6% 9. 2% 9. 0% 8. 8% 8. 7% 8. 5% 8. 4% 75%: Pessimistic 15. 3% 8. 2% 7. 2% 6. 7% 6. 5% 6. 4% 6. 5% 6. 6% 6. 7% 95%: Worst Case 15. 3% 3. 0% 2. 6% 2. 9% 3. 1% 3. 3% 3. 5% 3. 7% 3. 9% 5%: Best Case 15. 3% 19. 3% 17. 6% 16. 3% 15. 6% 14. 7% 14. 4% 14. 0% 13. 7% 13. 4% 13. 2% 25%: Optimistic 15. 3% 15. 0% 13. 4% 12. 5% 12. 1% 11. 7% 11. 2% 11. 0% 10. 8% 10. 6% 10. 5% 50%: Most Probable 15. 3% 11. 7% 10. 4% 9. 8% 9. 4% 9. 1% 9. 0% 8. 8% 8. 7% 8. 6% 8. 5% 75%: Pessimistic 15. 3% 8. 2% 7. 1% 6. 8% 6. 7% 6. 6% 6. 5% 6. 4% 6. 5% 6. 7% 95%: Worst Case 15. 3% 2. 5% 2. 1% 2. 6% 2. 8% 3. 1% 3. 2% 3. 3% 3. 6% 3. 9% 5%: Best Case 15. 3% 20. 1% 18. 1% 17. 0% 16. 2% 15. 2% 14. 9% 14. 4% 14. 2% 13. 9% 13. 7% 25%: Optimistic 15. 3% 15. 4% 13. 7% 12. 9% 12. 5% 12. 0% 11. 5% 11. 3% 11. 2% 11. 0% 10. 8% 50%: Most Probable 15. 3% 11. 9% 10. 6% 9. 9% 9. 6% 9. 3% 9. 2% 9. 0% 8. 9% 8. 8% 75%: Pessimistic 15. 3% 8. 2% 7. 1% 6. 8% 6. 7% 6. 6% 6. 5% 6. 6% 6. 8% 95%: Worst Case 15. 3% 2. 0% 1. 8% 2. 4% 2. 5% 2. 8% 3. 1% 3. 5% 3. 8% 45 Fixed 40 Fixed 35 Fixed Note: Fiscal Years. Fresno County Employees’ Retirement Association Wurts & Associates PAGE 32
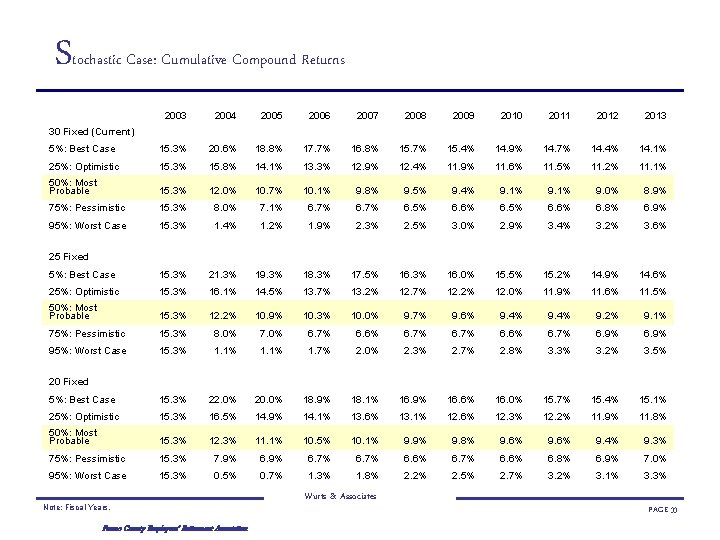
S tochastic Case: Cumulative Compound Returns 2003 2004 2005 2006 2007 2008 2009 2010 2011 2012 2013 5%: Best Case 15. 3% 20. 6% 18. 8% 17. 7% 16. 8% 15. 7% 15. 4% 14. 9% 14. 7% 14. 4% 14. 1% 25%: Optimistic 15. 3% 15. 8% 14. 1% 13. 3% 12. 9% 12. 4% 11. 9% 11. 6% 11. 5% 11. 2% 11. 1% 50%: Most Probable 15. 3% 12. 0% 10. 7% 10. 1% 9. 8% 9. 5% 9. 4% 9. 1% 9. 0% 8. 9% 75%: Pessimistic 15. 3% 8. 0% 7. 1% 6. 7% 6. 5% 6. 6% 6. 8% 6. 9% 95%: Worst Case 15. 3% 1. 4% 1. 2% 1. 9% 2. 3% 2. 5% 3. 0% 2. 9% 3. 4% 3. 2% 3. 6% 5%: Best Case 15. 3% 21. 3% 19. 3% 18. 3% 17. 5% 16. 3% 16. 0% 15. 5% 15. 2% 14. 9% 14. 6% 25%: Optimistic 15. 3% 16. 1% 14. 5% 13. 7% 13. 2% 12. 7% 12. 2% 12. 0% 11. 9% 11. 6% 11. 5% 50%: Most Probable 15. 3% 12. 2% 10. 9% 10. 3% 10. 0% 9. 7% 9. 6% 9. 4% 9. 2% 9. 1% 75%: Pessimistic 15. 3% 8. 0% 7. 0% 6. 7% 6. 6% 6. 7% 6. 9% 95%: Worst Case 15. 3% 1. 1% 1. 7% 2. 0% 2. 3% 2. 7% 2. 8% 3. 3% 3. 2% 3. 5% 5%: Best Case 15. 3% 22. 0% 20. 0% 18. 9% 18. 1% 16. 9% 16. 6% 16. 0% 15. 7% 15. 4% 15. 1% 25%: Optimistic 15. 3% 16. 5% 14. 9% 14. 1% 13. 6% 13. 1% 12. 6% 12. 3% 12. 2% 11. 9% 11. 8% 50%: Most Probable 15. 3% 12. 3% 11. 1% 10. 5% 10. 1% 9. 9% 9. 8% 9. 6% 9. 4% 9. 3% 75%: Pessimistic 15. 3% 7. 9% 6. 7% 6. 6% 6. 8% 6. 9% 7. 0% 95%: Worst Case 15. 3% 0. 5% 0. 7% 1. 3% 1. 8% 2. 2% 2. 5% 2. 7% 3. 2% 3. 1% 3. 3% 30 Fixed (Current) 25 Fixed 20 Fixed Note: Fiscal Years. Fresno County Employees’ Retirement Association Wurts & Associates PAGE 33
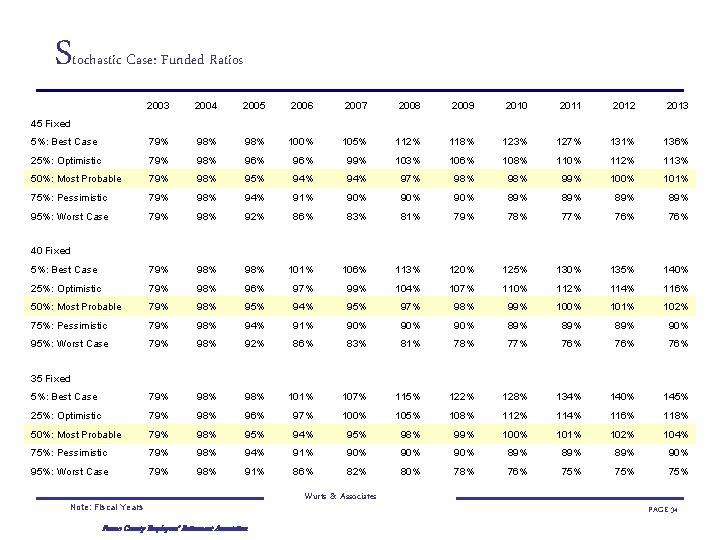
S tochastic Case: Funded Ratios 2003 2004 2005 2006 2007 2008 2009 2010 2011 2012 2013 5%: Best Case 79% 98% 100% 105% 112% 118% 123% 127% 131% 136% 25%: Optimistic 79% 98% 96% 99% 103% 106% 108% 110% 112% 113% 50%: Most Probable 79% 98% 95% 94% 97% 98% 99% 100% 101% 75%: Pessimistic 79% 98% 94% 91% 90% 90% 89% 89% 95%: Worst Case 79% 98% 92% 86% 83% 81% 79% 78% 77% 76% 5%: Best Case 79% 98% 101% 106% 113% 120% 125% 130% 135% 140% 25%: Optimistic 79% 98% 96% 97% 99% 104% 107% 110% 112% 114% 116% 50%: Most Probable 79% 98% 95% 94% 95% 97% 98% 99% 100% 101% 102% 75%: Pessimistic 79% 98% 94% 91% 90% 90% 89% 89% 90% 95%: Worst Case 79% 98% 92% 86% 83% 81% 78% 77% 76% 76% 5%: Best Case 79% 98% 101% 107% 115% 122% 128% 134% 140% 145% 25%: Optimistic 79% 98% 96% 97% 100% 105% 108% 112% 114% 116% 118% 50%: Most Probable 79% 98% 95% 94% 95% 98% 99% 100% 101% 102% 104% 75%: Pessimistic 79% 98% 94% 91% 90% 90% 89% 89% 90% 95%: Worst Case 79% 98% 91% 86% 82% 80% 78% 76% 75% 75% 45 Fixed 40 Fixed 35 Fixed Note: Fiscal Years Fresno County Employees’ Retirement Association Wurts & Associates PAGE 34
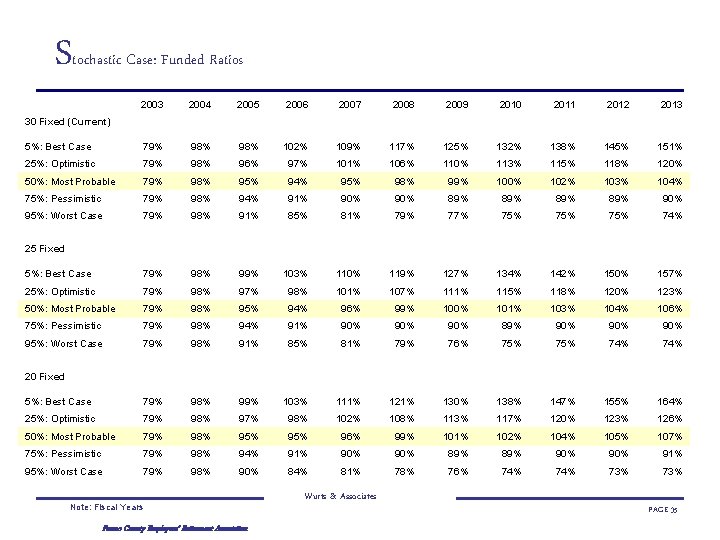
S tochastic Case: Funded Ratios 2003 2004 2005 2006 2007 2008 2009 2010 2011 2012 2013 5%: Best Case 79% 98% 102% 109% 117% 125% 132% 138% 145% 151% 25%: Optimistic 79% 98% 96% 97% 101% 106% 110% 113% 115% 118% 120% 50%: Most Probable 79% 98% 95% 94% 95% 98% 99% 100% 102% 103% 104% 75%: Pessimistic 79% 98% 94% 91% 90% 89% 89% 90% 95%: Worst Case 79% 98% 91% 85% 81% 79% 77% 75% 75% 74% 5%: Best Case 79% 98% 99% 103% 110% 119% 127% 134% 142% 150% 157% 25%: Optimistic 79% 98% 97% 98% 101% 107% 111% 115% 118% 120% 123% 50%: Most Probable 79% 98% 95% 94% 96% 99% 100% 101% 103% 104% 106% 75%: Pessimistic 79% 98% 94% 91% 90% 90% 89% 90% 90% 95%: Worst Case 79% 98% 91% 85% 81% 79% 76% 75% 74% 5%: Best Case 79% 98% 99% 103% 111% 121% 130% 138% 147% 155% 164% 25%: Optimistic 79% 98% 97% 98% 102% 108% 113% 117% 120% 123% 126% 50%: Most Probable 79% 98% 95% 96% 99% 101% 102% 104% 105% 107% 75%: Pessimistic 79% 98% 94% 91% 90% 89% 90% 91% 95%: Worst Case 79% 98% 90% 84% 81% 78% 76% 74% 73% 30 Fixed (Current) 25 Fixed 20 Fixed Note: Fiscal Years Fresno County Employees’ Retirement Association Wurts & Associates PAGE 35
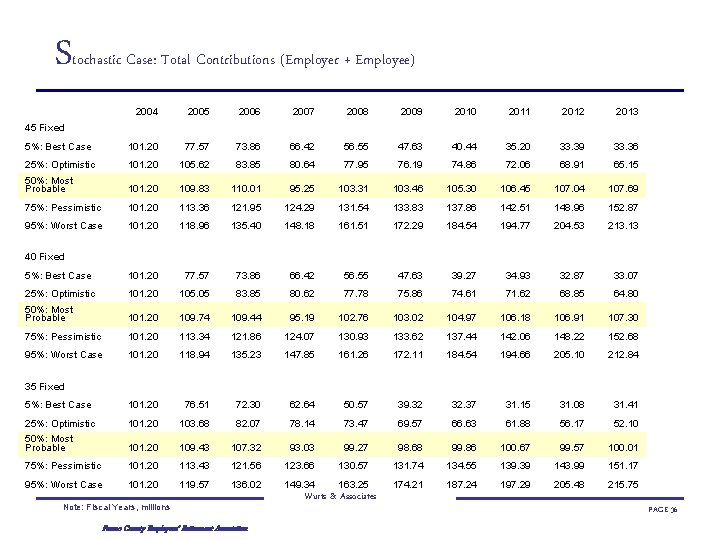
S tochastic Case: Total Contributions (Employer + Employee) 2004 2005 2006 2007 2008 2009 2010 2011 2012 2013 5%: Best Case 101. 20 77. 57 73. 86 66. 42 56. 55 47. 63 40. 44 35. 20 33. 39 33. 36 25%: Optimistic 101. 20 105. 62 83. 85 80. 64 77. 95 76. 19 74. 86 72. 06 68. 91 65. 15 50%: Most Probable 101. 20 109. 83 110. 01 95. 25 103. 31 103. 46 105. 30 106. 45 107. 04 107. 69 75%: Pessimistic 101. 20 113. 36 121. 95 124. 29 131. 54 133. 83 137. 86 142. 51 148. 96 152. 87 95%: Worst Case 101. 20 118. 96 135. 40 148. 18 161. 51 172. 29 184. 54 194. 77 204. 53 213. 13 5%: Best Case 101. 20 77. 57 73. 86 66. 42 56. 55 47. 63 39. 27 34. 93 32. 87 33. 07 25%: Optimistic 101. 20 105. 05 83. 85 80. 62 77. 78 75. 86 74. 61 71. 62 68. 85 64. 80 50%: Most Probable 101. 20 109. 74 109. 44 95. 19 102. 76 103. 02 104. 97 106. 18 106. 91 107. 30 75%: Pessimistic 101. 20 113. 34 121. 86 124. 07 130. 93 133. 62 137. 44 142. 06 148. 22 152. 68 95%: Worst Case 101. 20 118. 94 135. 23 147. 85 161. 26 172. 11 184. 54 194. 66 205. 10 212. 84 5%: Best Case 101. 20 76. 51 72. 30 62. 64 50. 57 39. 32 32. 37 31. 15 31. 08 31. 41 25%: Optimistic 101. 20 103. 68 82. 07 78. 14 73. 47 69. 57 66. 63 61. 88 56. 17 52. 10 50%: Most Probable 101. 20 109. 43 107. 32 93. 03 99. 27 98. 68 99. 86 100. 67 99. 57 100. 01 75%: Pessimistic 101. 20 113. 43 121. 56 123. 66 130. 57 131. 74 134. 55 139. 39 143. 99 151. 17 95%: Worst Case 101. 20 119. 57 136. 02 149. 34 163. 25 174. 21 187. 24 197. 29 205. 48 215. 75 45 Fixed 40 Fixed 35 Fixed Note: Fiscal Years, millions Fresno County Employees’ Retirement Association Wurts & Associates PAGE 36
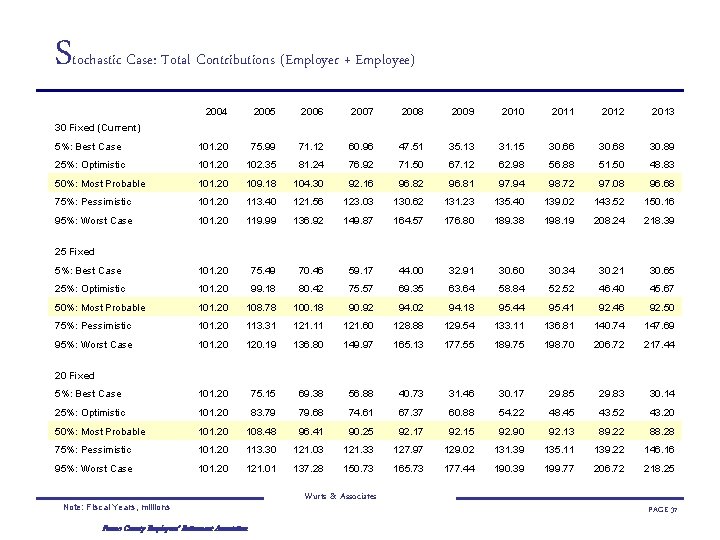
S tochastic Case: Total Contributions (Employer + Employee) 2004 2005 2006 2007 2008 2009 2010 2011 2012 2013 5%: Best Case 101. 20 75. 99 71. 12 60. 96 47. 51 35. 13 31. 15 30. 66 30. 68 30. 89 25%: Optimistic 101. 20 102. 35 81. 24 76. 92 71. 50 67. 12 62. 98 56. 88 51. 50 48. 83 50%: Most Probable 101. 20 109. 18 104. 30 92. 16 96. 82 96. 81 97. 94 98. 72 97. 08 96. 68 75%: Pessimistic 101. 20 113. 40 121. 56 123. 03 130. 62 131. 23 135. 40 139. 02 143. 52 150. 16 95%: Worst Case 101. 20 119. 99 136. 92 149. 87 164. 57 176. 80 189. 38 198. 19 208. 24 218. 39 5%: Best Case 101. 20 75. 49 70. 46 59. 17 44. 00 32. 91 30. 60 30. 34 30. 21 30. 65 25%: Optimistic 101. 20 99. 18 80. 42 75. 57 69. 35 63. 64 58. 84 52. 52 46. 40 45. 67 50%: Most Probable 101. 20 108. 78 100. 18 90. 92 94. 02 94. 18 95. 44 95. 41 92. 46 92. 50 75%: Pessimistic 101. 20 113. 31 121. 11 121. 60 128. 88 129. 54 133. 11 136. 81 140. 74 147. 69 95%: Worst Case 101. 20 120. 19 136. 80 149. 97 165. 13 177. 55 189. 75 198. 70 206. 72 217. 44 5%: Best Case 101. 20 75. 15 69. 38 56. 88 40. 73 31. 46 30. 17 29. 85 29. 83 30. 14 25%: Optimistic 101. 20 83. 79 79. 68 74. 61 67. 37 60. 88 54. 22 48. 45 43. 52 43. 20 50%: Most Probable 101. 20 108. 48 96. 41 90. 25 92. 17 92. 15 92. 90 92. 13 89. 22 88. 28 75%: Pessimistic 101. 20 113. 30 121. 03 121. 33 127. 97 129. 02 131. 39 135. 11 139. 22 146. 16 95%: Worst Case 101. 20 121. 01 137. 28 150. 73 165. 73 177. 44 190. 39 199. 77 206. 72 218. 25 30 Fixed (Current) 25 Fixed 20 Fixed Note: Fiscal Years, millions Fresno County Employees’ Retirement Association Wurts & Associates PAGE 37
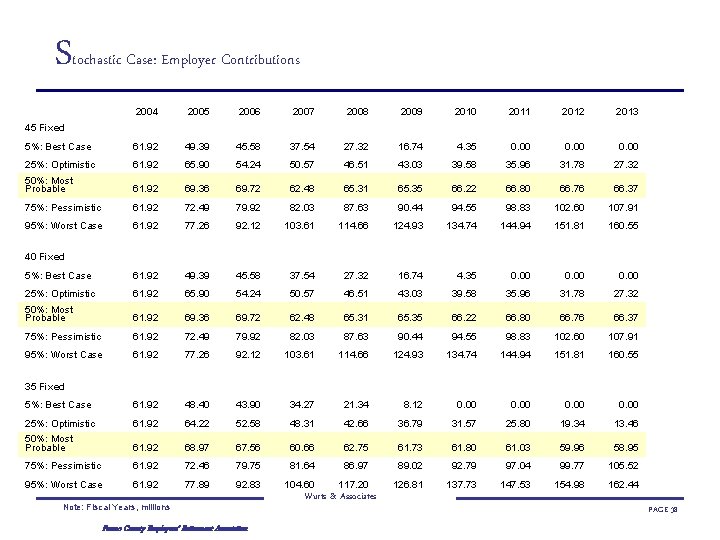
S tochastic Case: Employer Contributions 2004 2005 2006 2007 2008 2009 2010 2011 2012 2013 5%: Best Case 61. 92 49. 39 45. 58 37. 54 27. 32 16. 74 4. 35 0. 00 25%: Optimistic 61. 92 65. 90 54. 24 50. 57 46. 51 43. 03 39. 58 35. 96 31. 78 27. 32 50%: Most Probable 61. 92 69. 36 69. 72 62. 48 65. 31 65. 35 66. 22 66. 80 66. 76 66. 37 75%: Pessimistic 61. 92 72. 49 79. 92 82. 03 87. 63 90. 44 94. 55 98. 83 102. 60 107. 91 95%: Worst Case 61. 92 77. 26 92. 12 103. 61 114. 66 124. 93 134. 74 144. 94 151. 81 160. 55 5%: Best Case 61. 92 48. 40 43. 90 34. 27 21. 34 8. 12 0. 00 25%: Optimistic 61. 92 64. 22 52. 58 48. 31 42. 66 36. 79 31. 57 25. 80 19. 34 13. 46 50%: Most Probable 61. 92 68. 97 67. 56 60. 66 62. 75 61. 73 61. 80 61. 03 59. 96 58. 95 75%: Pessimistic 61. 92 72. 46 79. 75 81. 64 86. 97 89. 02 92. 79 97. 04 99. 77 105. 52 95%: Worst Case 61. 92 77. 89 92. 83 104. 60 117. 20 126. 81 137. 73 147. 53 154. 98 162. 44 45 Fixed 40 Fixed 35 Fixed Note: Fiscal Years, millions Fresno County Employees’ Retirement Association Wurts & Associates PAGE 38
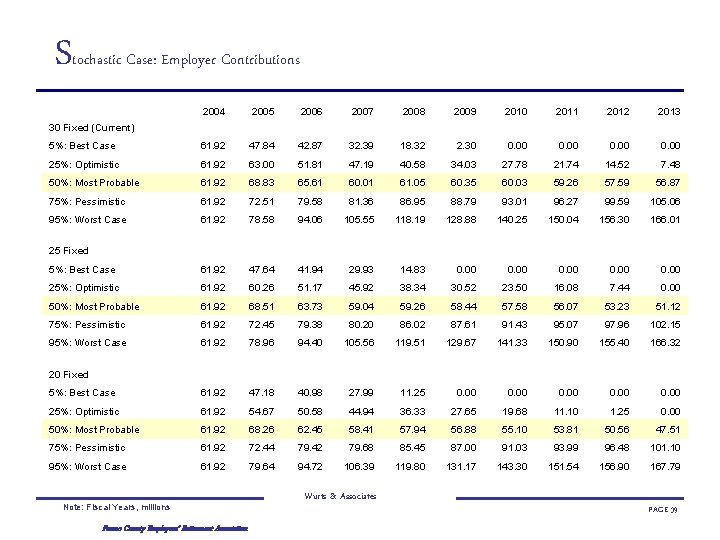
S tochastic Case: Employer Contributions 2004 2005 2006 2007 2008 2009 2010 2011 2012 2013 5%: Best Case 61. 92 47. 84 42. 87 32. 39 18. 32 2. 30 0. 00 25%: Optimistic 61. 92 63. 00 51. 81 47. 19 40. 58 34. 03 27. 78 21. 74 14. 52 7. 48 50%: Most Probable 61. 92 68. 83 65. 61 60. 01 61. 05 60. 35 60. 03 59. 26 57. 59 56. 87 75%: Pessimistic 61. 92 72. 51 79. 58 81. 36 86. 95 88. 79 93. 01 96. 27 99. 59 105. 06 95%: Worst Case 61. 92 78. 58 94. 06 105. 55 118. 19 128. 88 140. 25 150. 04 156. 30 166. 01 5%: Best Case 61. 92 47. 64 41. 94 29. 93 14. 83 0. 00 25%: Optimistic 61. 92 60. 26 51. 17 45. 92 38. 34 30. 52 23. 50 16. 08 7. 44 0. 00 50%: Most Probable 61. 92 68. 51 63. 73 59. 04 59. 26 58. 44 57. 58 56. 07 53. 23 51. 12 75%: Pessimistic 61. 92 72. 45 79. 38 80. 20 86. 02 87. 61 91. 43 95. 07 97. 96 102. 15 95%: Worst Case 61. 92 78. 96 94. 40 105. 56 119. 51 129. 67 141. 33 150. 90 155. 40 166. 32 5%: Best Case 61. 92 47. 18 40. 98 27. 99 11. 25 0. 00 25%: Optimistic 61. 92 54. 67 50. 58 44. 94 36. 33 27. 65 19. 68 11. 10 1. 25 0. 00 50%: Most Probable 61. 92 68. 26 62. 45 58. 41 57. 94 56. 88 55. 10 53. 81 50. 56 47. 51 75%: Pessimistic 61. 92 72. 44 79. 42 79. 68 85. 45 87. 00 91. 03 93. 99 96. 48 101. 10 95%: Worst Case 61. 92 79. 64 94. 72 106. 39 119. 80 131. 17 143. 30 151. 54 156. 90 167. 79 30 Fixed (Current) 25 Fixed 20 Fixed Note: Fiscal Years, millions Fresno County Employees’ Retirement Association Wurts & Associates PAGE 39
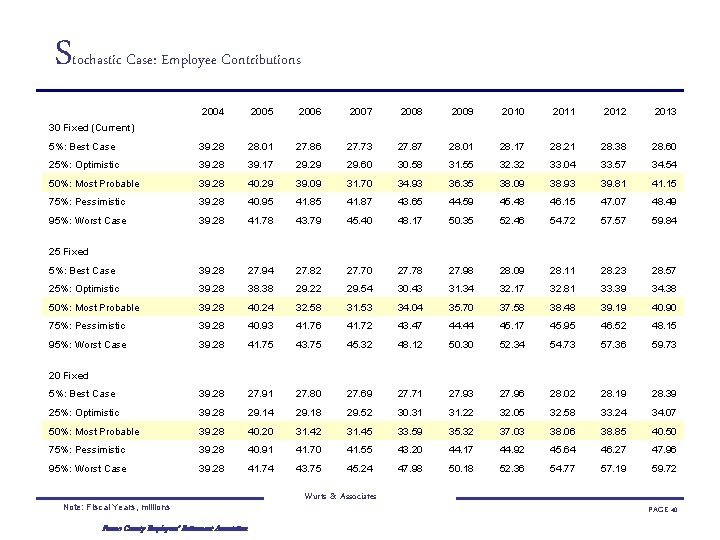
S tochastic Case: Employee Contributions 2004 2005 2006 2007 2008 2009 2010 2011 2012 2013 5%: Best Case 39. 28 28. 01 27. 86 27. 73 27. 87 28. 01 28. 17 28. 21 28. 38 28. 60 25%: Optimistic 39. 28 39. 17 29. 29 29. 60 30. 58 31. 55 32. 32 33. 04 33. 57 34. 54 50%: Most Probable 39. 28 40. 29 39. 09 31. 70 34. 93 36. 35 38. 09 38. 93 39. 81 41. 15 75%: Pessimistic 39. 28 40. 95 41. 87 43. 65 44. 59 45. 48 46. 15 47. 07 48. 49 95%: Worst Case 39. 28 41. 78 43. 79 45. 40 48. 17 50. 35 52. 46 54. 72 57. 57 59. 84 5%: Best Case 39. 28 27. 94 27. 82 27. 70 27. 78 27. 98 28. 09 28. 11 28. 23 28. 57 25%: Optimistic 39. 28 38. 38 29. 22 29. 54 30. 43 31. 34 32. 17 32. 81 33. 39 34. 38 50%: Most Probable 39. 28 40. 24 32. 58 31. 53 34. 04 35. 70 37. 58 38. 48 39. 19 40. 90 75%: Pessimistic 39. 28 40. 93 41. 76 41. 72 43. 47 44. 44 45. 17 45. 95 46. 52 48. 15 95%: Worst Case 39. 28 41. 75 43. 75 45. 32 48. 12 50. 30 52. 34 54. 73 57. 36 59. 73 5%: Best Case 39. 28 27. 91 27. 80 27. 69 27. 71 27. 93 27. 96 28. 02 28. 19 28. 39 25%: Optimistic 39. 28 29. 14 29. 18 29. 52 30. 31 31. 22 32. 05 32. 58 33. 24 34. 07 50%: Most Probable 39. 28 40. 20 31. 42 31. 45 33. 59 35. 32 37. 03 38. 06 38. 85 40. 50 75%: Pessimistic 39. 28 40. 91 41. 70 41. 55 43. 20 44. 17 44. 92 45. 64 46. 27 47. 96 95%: Worst Case 39. 28 41. 74 43. 75 45. 24 47. 98 50. 18 52. 36 54. 77 57. 19 59. 72 30 Fixed (Current) 25 Fixed 20 Fixed Note: Fiscal Years, millions Fresno County Employees’ Retirement Association Wurts & Associates PAGE 40
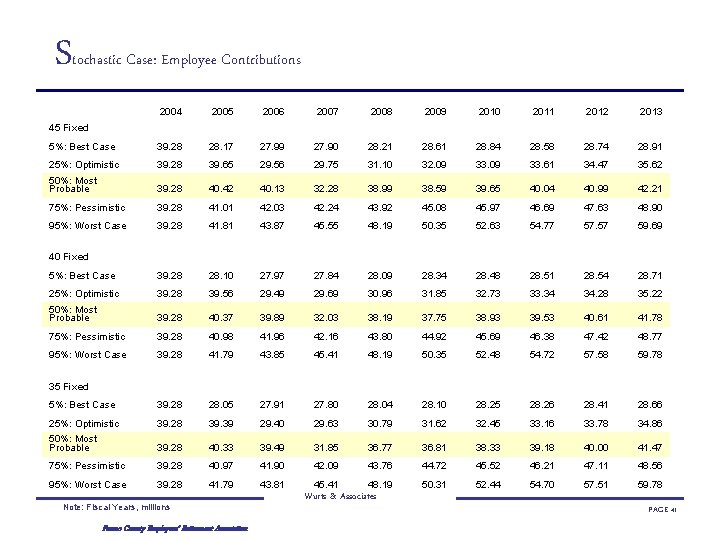
S tochastic Case: Employee Contributions 2004 2005 2006 2007 2008 2009 2010 2011 2012 2013 5%: Best Case 39. 28 28. 17 27. 99 27. 90 28. 21 28. 61 28. 84 28. 58 28. 74 28. 91 25%: Optimistic 39. 28 39. 65 29. 56 29. 75 31. 10 32. 09 33. 61 34. 47 35. 62 50%: Most Probable 39. 28 40. 42 40. 13 32. 28 38. 99 38. 59 39. 65 40. 04 40. 99 42. 21 75%: Pessimistic 39. 28 41. 01 42. 03 42. 24 43. 92 45. 08 45. 97 46. 69 47. 63 48. 90 95%: Worst Case 39. 28 41. 81 43. 87 45. 55 48. 19 50. 35 52. 63 54. 77 57. 57 59. 69 5%: Best Case 39. 28 28. 10 27. 97 27. 84 28. 09 28. 34 28. 48 28. 51 28. 54 28. 71 25%: Optimistic 39. 28 39. 56 29. 49 29. 69 30. 96 31. 85 32. 73 33. 34 34. 28 35. 22 50%: Most Probable 39. 28 40. 37 39. 89 32. 03 38. 19 37. 75 38. 93 39. 53 40. 61 41. 78 75%: Pessimistic 39. 28 40. 98 41. 96 42. 16 43. 80 44. 92 45. 69 46. 38 47. 42 48. 77 95%: Worst Case 39. 28 41. 79 43. 85 45. 41 48. 19 50. 35 52. 48 54. 72 57. 58 59. 78 5%: Best Case 39. 28 28. 05 27. 91 27. 80 28. 04 28. 10 28. 25 28. 26 28. 41 28. 66 25%: Optimistic 39. 28 39. 39 29. 40 29. 63 30. 79 31. 62 32. 45 33. 16 33. 78 34. 86 50%: Most Probable 39. 28 40. 33 39. 49 31. 85 36. 77 36. 81 38. 33 39. 18 40. 00 41. 47 75%: Pessimistic 39. 28 40. 97 41. 90 42. 09 43. 76 44. 72 45. 52 46. 21 47. 11 48. 56 95%: Worst Case 39. 28 41. 79 43. 81 45. 41 48. 19 50. 31 52. 44 54. 70 57. 51 59. 78 45 Fixed 40 Fixed 35 Fixed Note: Fiscal Years, millions Fresno County Employees’ Retirement Association Wurts & Associates PAGE 41
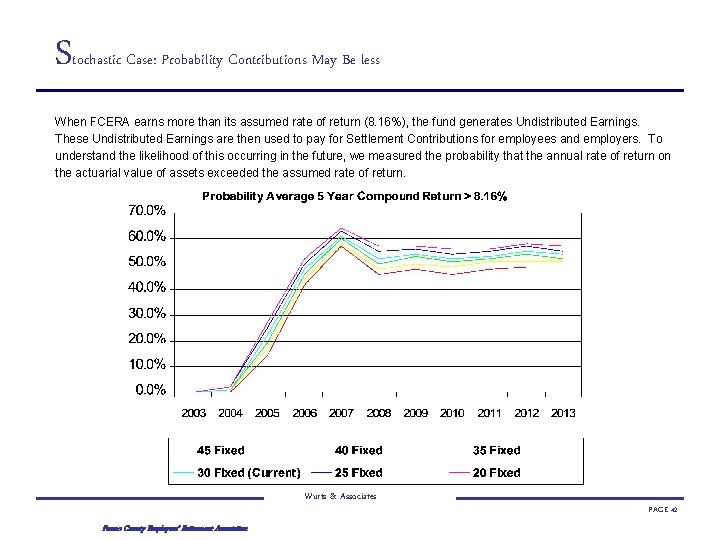
S tochastic Case: Probability Contributions May Be less When FCERA earns more than its assumed rate of return (8. 16%), the fund generates Undistributed Earnings. These Undistributed Earnings are then used to pay for Settlement Contributions for employees and employers. To understand the likelihood of this occurring in the future, we measured the probability that the annual rate of return on the actuarial value of assets exceeded the assumed rate of return. Wurts & Associates Fresno County Employees’ Retirement Association PAGE 42
APPENDIX Wurts & Associates Fresno County Employees’ Retirement Association PAGE 43
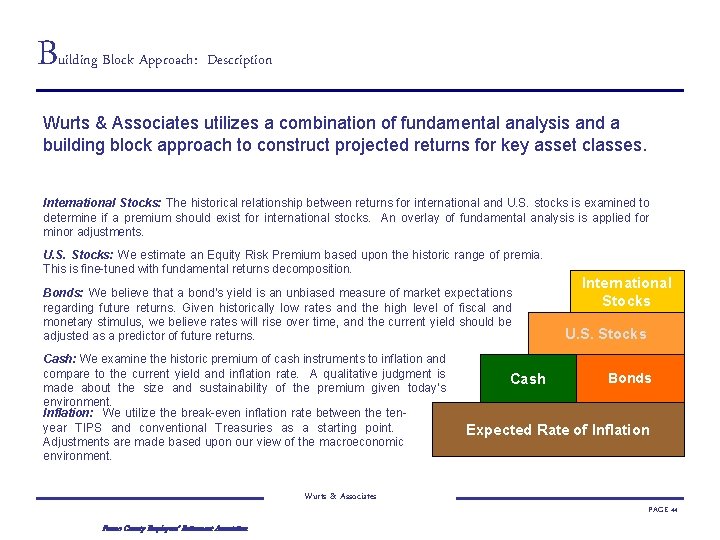
B uilding Block Approach: Description Wurts & Associates utilizes a combination of fundamental analysis and a building block approach to construct projected returns for key asset classes. International Stocks: The historical relationship between returns for international and U. S. stocks is examined to determine if a premium should exist for international stocks. An overlay of fundamental analysis is applied for minor adjustments. U. S. Stocks: We estimate an Equity Risk Premium based upon the historic range of premia. This is fine-tuned with fundamental returns decomposition. Bonds: We believe that a bond’s yield is an unbiased measure of market expectations regarding future returns. Given historically low rates and the high level of fiscal and monetary stimulus, we believe rates will rise over time, and the current yield should be adjusted as a predictor of future returns. Cash: We examine the historic premium of cash instruments to inflation and compare to the current yield and inflation rate. A qualitative judgment is made about the size and sustainability of the premium given today’s environment. Inflation: We utilize the break-even inflation rate between the tenyear TIPS and conventional Treasuries as a starting point. Adjustments are made based upon our view of the macroeconomic environment. Wurts & Associates Fresno County Employees’ Retirement Association Cash International Stocks U. S. Stocks Bonds Expected Rate of Inflation PAGE 44
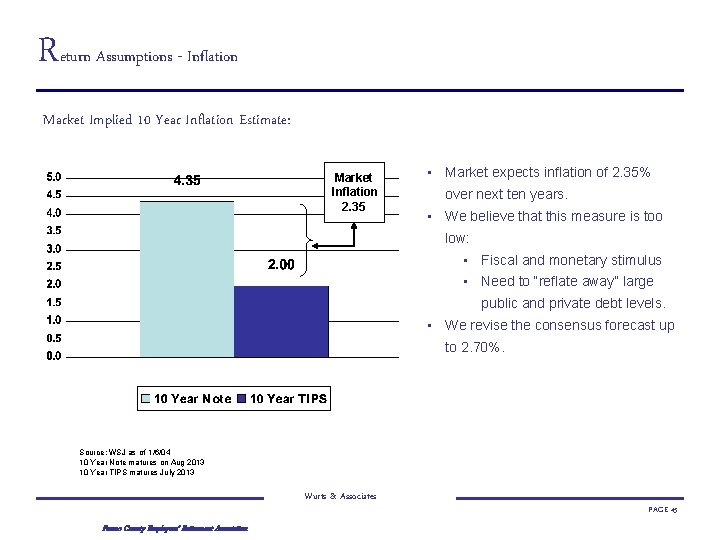
Return Assumptions - Inflation Market Implied 10 Year Inflation Estimate: Market Inflation 2. 35 • Market expects inflation of 2. 35% over next ten years. • We believe that this measure is too low: • Fiscal and monetary stimulus • Need to “reflate away” large public and private debt levels. • We revise the consensus forecast up to 2. 70%. Source: WSJ as of 1/6/04 10 Year Note matures on Aug 2013 10 Year TIPS matures July 2013 Wurts & Associates Fresno County Employees’ Retirement Association PAGE 45
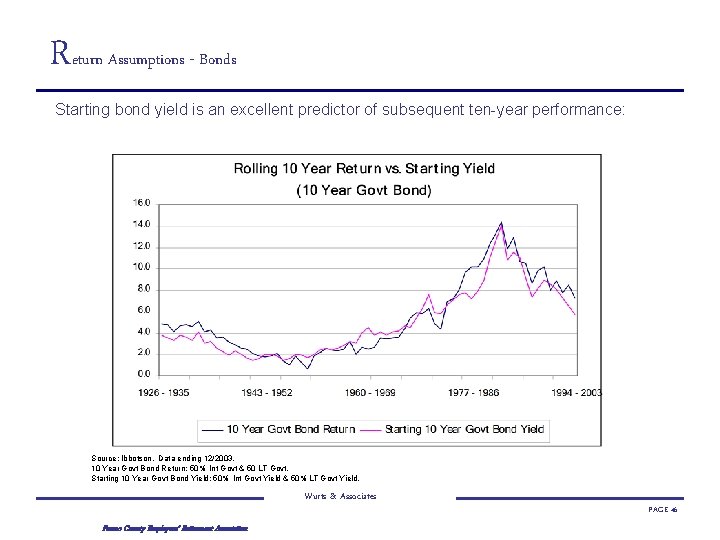
Return Assumptions - Bonds Starting bond yield is an excellent predictor of subsequent ten-year performance: Source: Ibbotson. Data ending 12/2003. 10 Year Govt Bond Return: 50% Int Govt & 50 LT Govt. Starting 10 Year Govt Bond Yield: 50% Int Govt Yield & 50% LT Govt Yield. Wurts & Associates Fresno County Employees’ Retirement Association PAGE 46
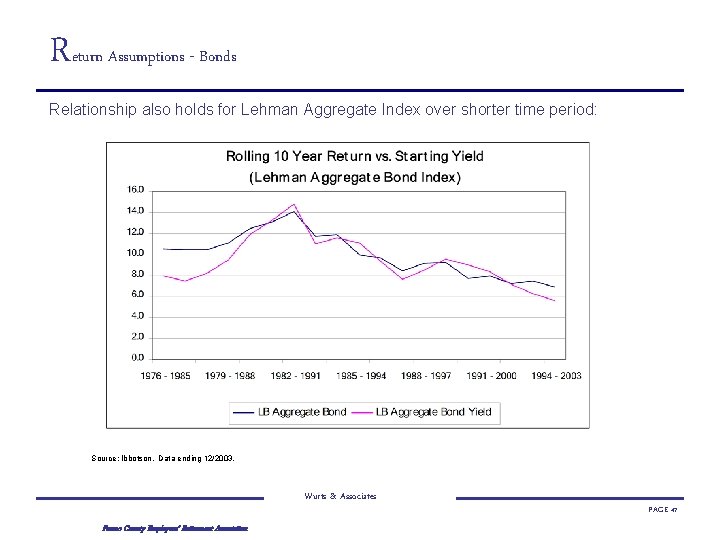
Return Assumptions - Bonds Relationship also holds for Lehman Aggregate Index over shorter time period: Source: Ibbotson. Data ending 12/2003. Wurts & Associates Fresno County Employees’ Retirement Association PAGE 47
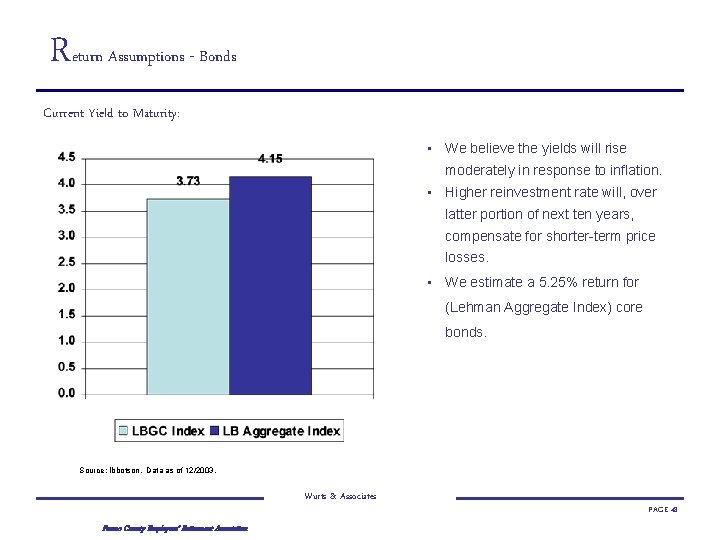
Return Assumptions - Bonds Current Yield to Maturity: • We believe the yields will rise moderately in response to inflation. • Higher reinvestment rate will, over latter portion of next ten years, compensate for shorter-term price losses. • We estimate a 5. 25% return for (Lehman Aggregate Index) core bonds. Source: Ibbotson. Data as of 12/2003. Wurts & Associates Fresno County Employees’ Retirement Association PAGE 48
Return Assumptions - Equity The equity risk premium is the most important number in investing. • Stocks are inherently more risky than bonds. In order to be a valid investment choice, stocks must offer a higher rate of return than bonds to attract investor capital. • This demanded incremental difference in return is the equity risk premium and is typically defined as the long run (ten years in this case ) return difference between US equities and US government bonds. • • Since 1926, this number has averaged approximately 6. 0%. We begin our 2004 estimate with a historic look at the premium over time. The following chart displays the starting yield of a ten-year government bond and the subsequent ten years of stock performance as measured by the S & P 500: Wurts & Associates Fresno County Employees’ Retirement Association PAGE 49
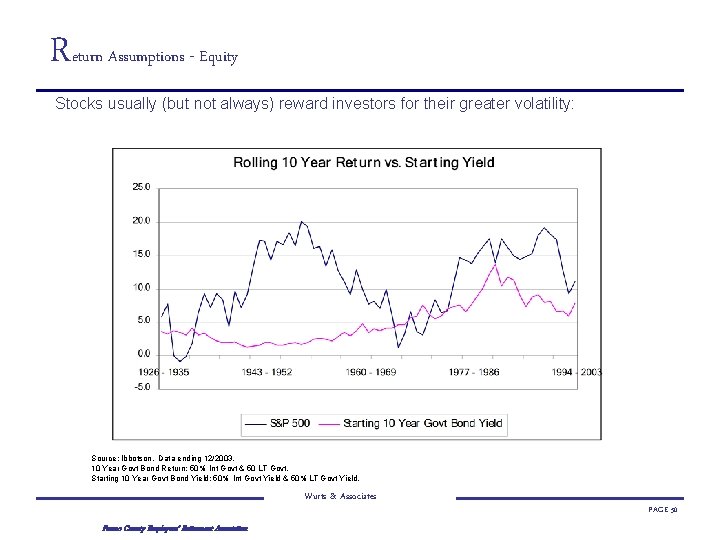
Return Assumptions - Equity Stocks usually (but not always) reward investors for their greater volatility: Source: Ibbotson. Data ending 12/2003. 10 Year Govt Bond Return: 50% Int Govt & 50 LT Govt. Starting 10 Year Govt Bond Yield: 50% Int Govt Yield & 50% LT Govt Yield. Wurts & Associates Fresno County Employees’ Retirement Association PAGE 50
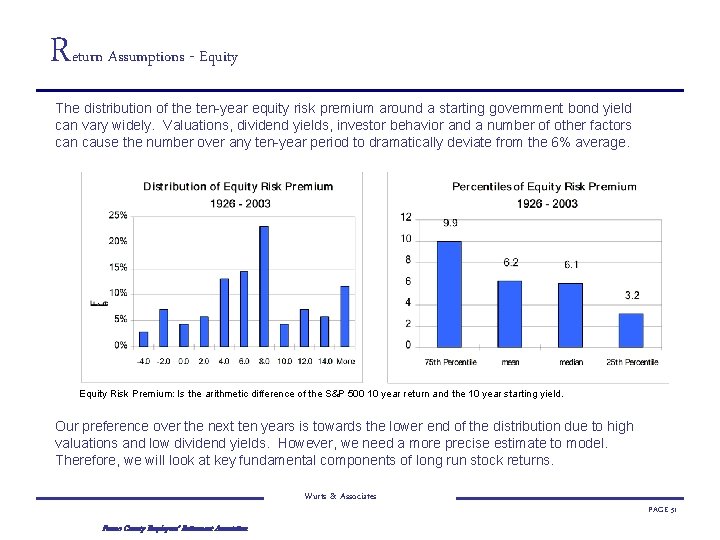
Return Assumptions - Equity The distribution of the ten-year equity risk premium around a starting government bond yield can vary widely. Valuations, dividend yields, investor behavior and a number of other factors can cause the number over any ten-year period to dramatically deviate from the 6% average. Equity Risk Premium: Is the arithmetic difference of the S&P 500 10 year return and the 10 year starting yield. Our preference over the next ten years is towards the lower end of the distribution due to high valuations and low dividend yields. However, we need a more precise estimate to model. Therefore, we will look at key fundamental components of long run stock returns. Wurts & Associates Fresno County Employees’ Retirement Association PAGE 51
Return Assumptions - Equity We estimate a 8. 2% nominal return for stocks. This implies an equity risk premium of about 4. 00% over a starting 10 -Year Treasury bond yield. • • About 2. 00% less than 6. 0% average of last 76 years. Lower end of historical risk premium distribution. Breakdown of the Return Composition: Dividends: We take the 1. 9% dividend yield of the S & P 500 Index and add 1. 1% based upon the index’s payout ratio rising from its current 33% to 50% (approximately its long term average). Real Earnings Growth: over the 1990’s averaged 5. 5% and 2. 5% from 1950 -2000. We feel the moderately higher 3. 0% is appropriate and in line with a reasonable rate of real GDP growth. P/E Contraction: Ratios increased from 10 to 30 over the last 76 years. Most of the increase occurred in the last 20 years. Last year, we assumed no change in valuation levels over the next ten years. P/E’s have subsequently risen causing us to project some contraction in equity prices. Assuming a contraction from today’s level to last year’s implies an annualized contraction loss of 1. 2%. We adjust this to -0. 5% as contraction will be cushioned by lower tax rates and inflation levels. Wurts & Associates Fresno County Employees’ Retirement Association PAGE 52
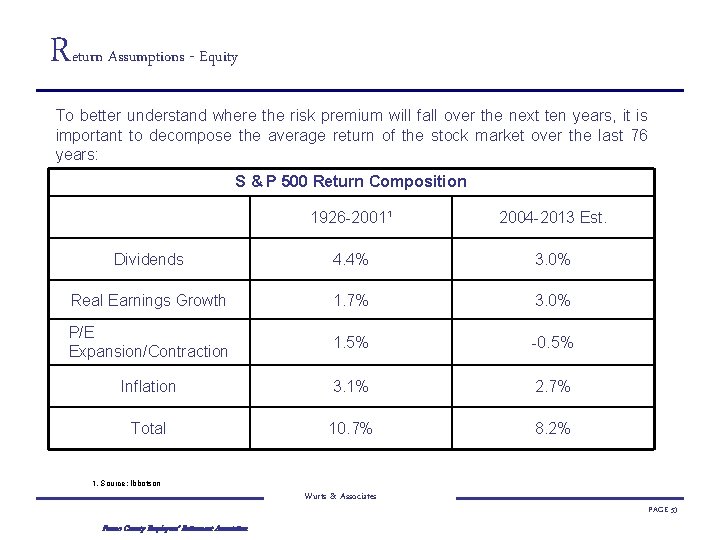
Return Assumptions - Equity To better understand where the risk premium will fall over the next ten years, it is important to decompose the average return of the stock market over the last 76 years: S & P 500 Return Composition 1926 -2001¹ 2004 -2013 Est. Dividends 4. 4% 3. 0% Real Earnings Growth 1. 7% 3. 0% P/E Expansion/Contraction 1. 5% -0. 5% Inflation 3. 1% 2. 7% Total 10. 7% 8. 2% 1. Source: Ibbotson Wurts & Associates Fresno County Employees’ Retirement Association PAGE 53
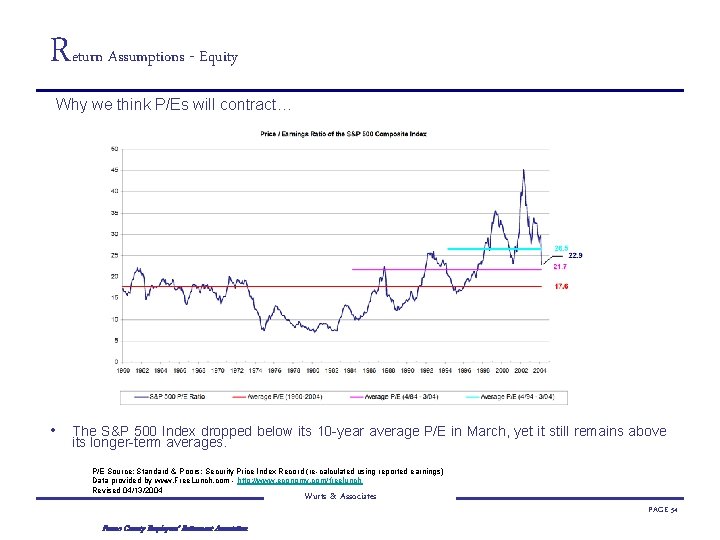
Return Assumptions - Equity Why we think P/Es will contract… • The S&P 500 Index dropped below its 10 -year average P/E in March, yet it still remains above its longer-term averages. P/E Source: Standard & Poors: Security Price Index Record (re-calculated using reported earnings) Data provided by www. Free. Lunch. com - http: //www. economy. com/freelunch Revised 04/13/2004 Wurts & Associates Fresno County Employees’ Retirement Association PAGE 54
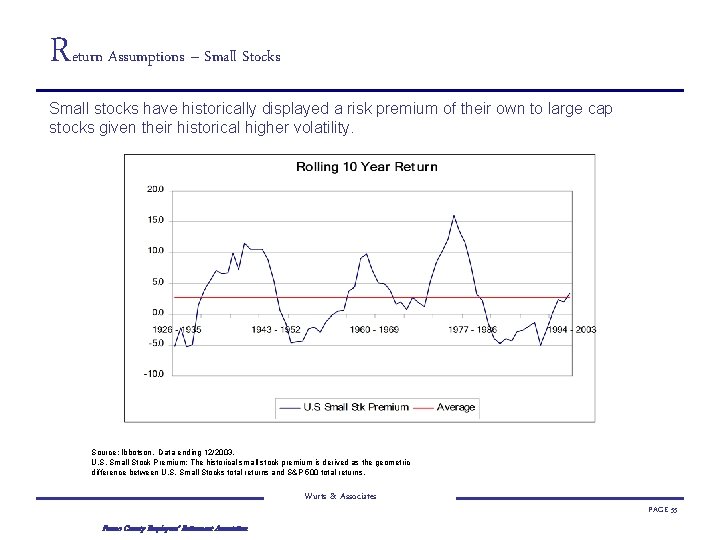
Return Assumptions – Small Stocks Small stocks have historically displayed a risk premium of their own to large cap stocks given their historical higher volatility. Source: Ibbotson. Data ending 12/2003. U. S. Small Stock Premium: The historical small stock premium is derived as the geometric difference between U. S. Small Stocks total returns and S&P 500 total returns. Wurts & Associates Fresno County Employees’ Retirement Association PAGE 55
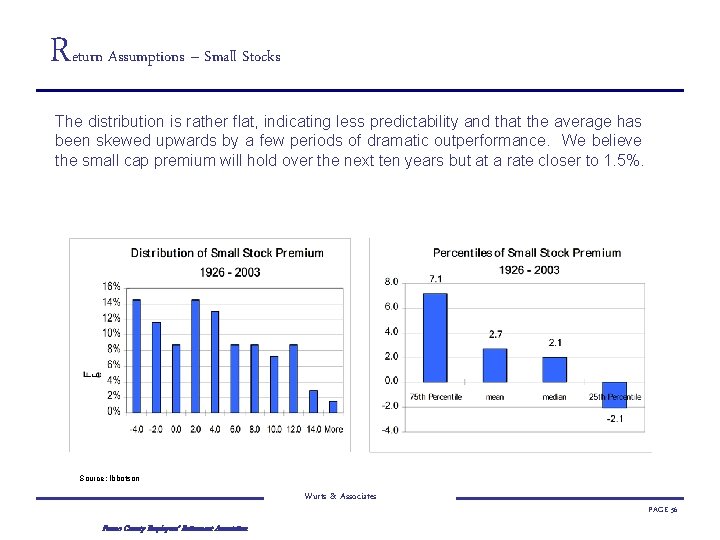
Return Assumptions – Small Stocks The distribution is rather flat, indicating less predictability and that the average has been skewed upwards by a few periods of dramatic outperformance. We believe the small cap premium will hold over the next ten years but at a rate closer to 1. 5%. Source: Ibbotson Wurts & Associates Fresno County Employees’ Retirement Association PAGE 56
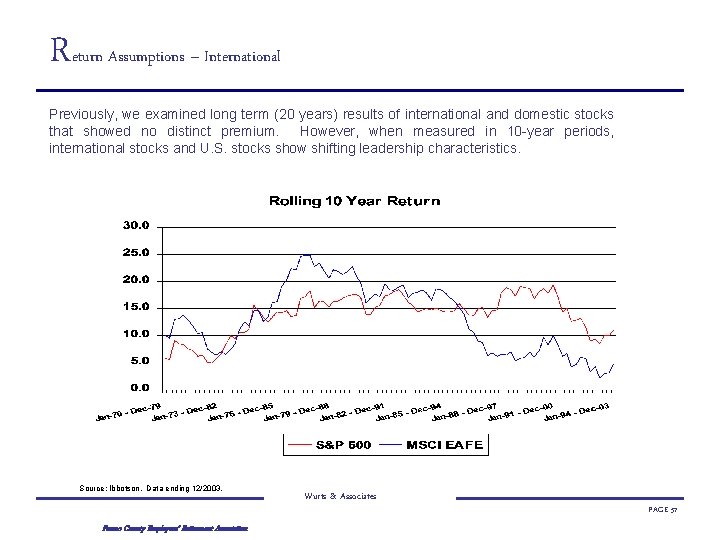
Return Assumptions – International Previously, we examined long term (20 years) results of international and domestic stocks that showed no distinct premium. However, when measured in 10 -year periods, international stocks and U. S. stocks show shifting leadership characteristics. Source: Ibbotson. Data ending 12/2003. Fresno County Employees’ Retirement Association Wurts & Associates PAGE 57
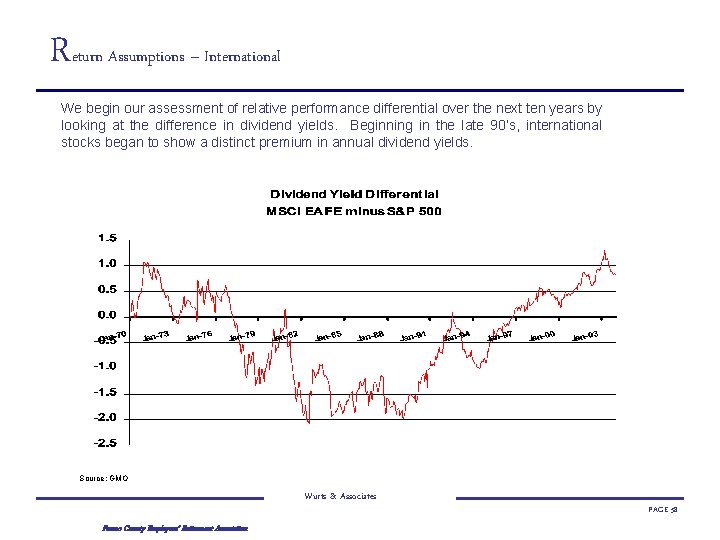
Return Assumptions – International We begin our assessment of relative performance differential over the next ten years by looking at the difference in dividend yields. Beginning in the late 90’s, international stocks began to show a distinct premium in annual dividend yields. Source: GMO Wurts & Associates Fresno County Employees’ Retirement Association PAGE 58
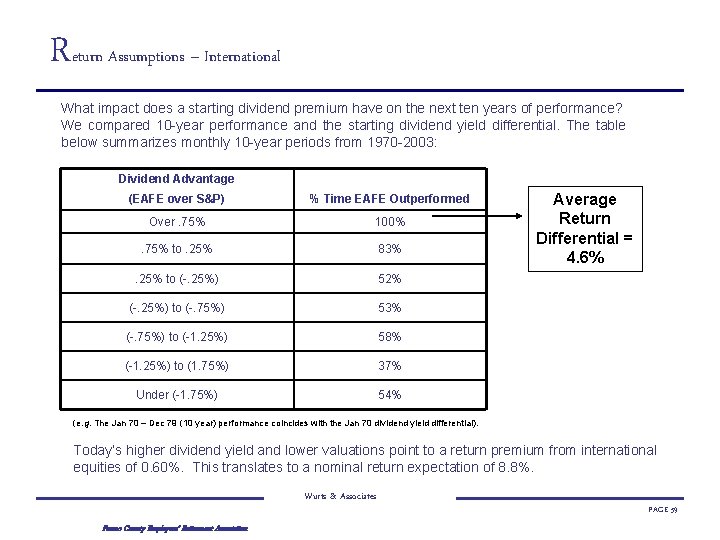
Return Assumptions – International What impact does a starting dividend premium have on the next ten years of performance? We compared 10 -year performance and the starting dividend yield differential. The table below summarizes monthly 10 -year periods from 1970 -2003: Dividend Advantage (EAFE over S&P) % Time EAFE Outperformed Over. 75% 100% . 75% to. 25% 83% . 25% to (-. 25%) 52% (-. 25%) to (-. 75%) 53% (-. 75%) to (-1. 25%) 58% (-1. 25%) to (1. 75%) 37% Under (-1. 75%) 54% Average Return Differential = 4. 6% (e. g. The Jan 70 – Dec 79 (10 year) performance coincides with the Jan 70 dividend yield differential). Today’s higher dividend yield and lower valuations point to a return premium from international equities of 0. 60%. This translates to a nominal return expectation of 8. 8%. Wurts & Associates Fresno County Employees’ Retirement Association PAGE 59
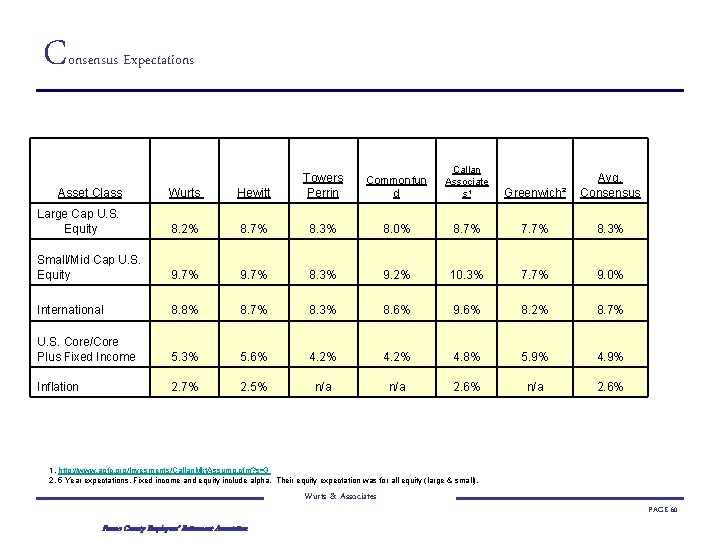
C onsensus Expectations Commonfun d Callan Associate s¹ Greenwich² Avg. Consensus Wurts Hewitt Towers Perrin Large Cap U. S. Equity 8. 2% 8. 7% 8. 3% 8. 0% 8. 7% 7. 7% 8. 3% Small/Mid Cap U. S. Equity 9. 7% 8. 3% 9. 2% 10. 3% 7. 7% 9. 0% International 8. 8% 8. 7% 8. 3% 8. 6% 9. 6% 8. 2% 8. 7% U. S. Core/Core Plus Fixed Income 5. 3% 5. 6% 4. 2% 4. 8% 5. 9% 4. 9% Inflation 2. 7% 2. 5% n/a 2. 6% Asset Class 1. http: //www. apfc. org/Invesments/Callan. Mkt. Assump. cfm? s=3 2. 5 Year expectations. Fixed income and equity include alpha. Their equity expectation was for all equity (large & small). Wurts & Associates Fresno County Employees’ Retirement Association PAGE 60
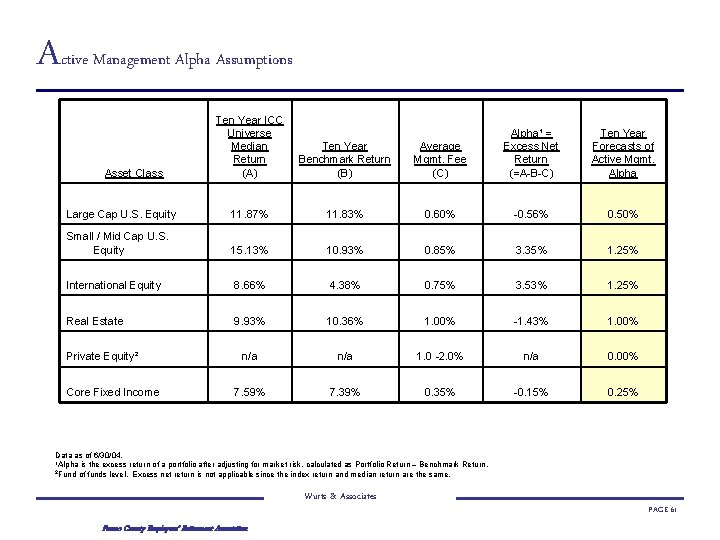
Active Management Alpha Assumptions Ten Year ICC Universe Median Return (A) Ten Year Benchmark Return (B) Average Mgmt. Fee (C) Alpha¹ = Excess Net Return (=A-B-C) Ten Year Forecasts of Active Mgmt. Alpha Large Cap U. S. Equity 11. 87% 11. 83% 0. 60% -0. 56% 0. 50% Small / Mid Cap U. S. Equity 15. 13% 10. 93% 0. 85% 3. 35% 1. 25% International Equity 8. 66% 4. 38% 0. 75% 3. 53% 1. 25% Real Estate 9. 93% 10. 36% 1. 00% -1. 43% 1. 00% n/a 1. 0 -2. 0% n/a 0. 00% 7. 59% 7. 39% 0. 35% -0. 15% 0. 25% Asset Class Private Equity² Core Fixed Income Data as of 6/30/04. 1 Alpha is the excess return of a portfolio after adjusting for market risk, calculated as Portfolio Return – Benchmark Return. 2 Fund of funds level. Excess net return is not applicable since the index return and median return are the same. Wurts & Associates Fresno County Employees’ Retirement Association PAGE 61
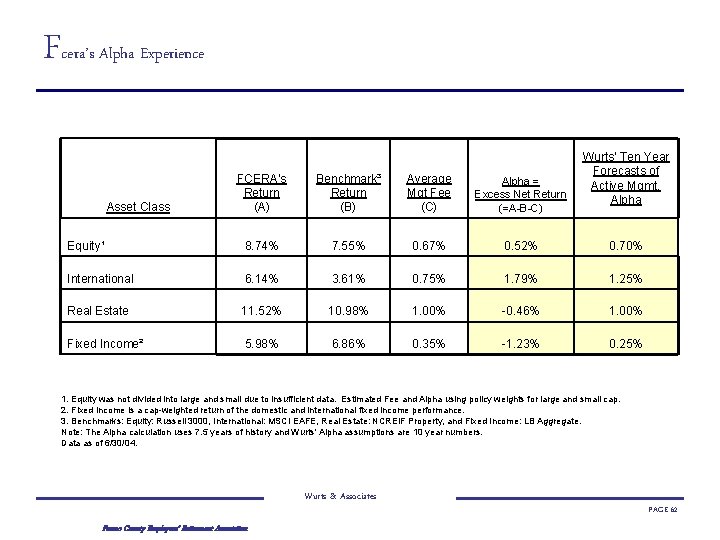
Fcera’s Alpha Experience Wurts’ Ten Year Forecasts of Active Mgmt. Alpha FCERA’s Return (A) Benchmark³ Return (B) Average Mgt Fee (C) Alpha = Excess Net Return (=A-B-C) Equity¹ 8. 74% 7. 55% 0. 67% 0. 52% 0. 70% International 6. 14% 3. 61% 0. 75% 1. 79% 1. 25% Real Estate 11. 52% 10. 98% 1. 00% -0. 46% 1. 00% Fixed Income² 5. 98% 6. 86% 0. 35% -1. 23% 0. 25% Asset Class 1. Equity was not divided into large and small due to insufficient data. Estimated Fee and Alpha using policy weights for large and small cap. 2. Fixed Income is a cap-weighted return of the domestic and international fixed income performance. 3. Benchmarks: Equity: Russell 3000, International: MSCI EAFE, Real Estate: NCREIF Property, and Fixed Income: LB Aggregate. Note: The Alpha calculation uses 7. 5 years of history and Wurts' Alpha assumptions are 10 year numbers. Data as of 6/30/04. Wurts & Associates Fresno County Employees’ Retirement Association PAGE 62
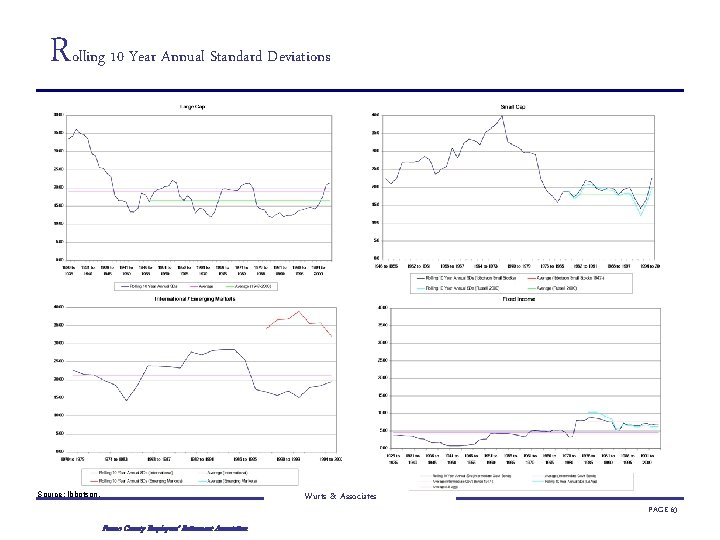
Rolling 10 Year Annual Standard Deviations Wurts & Associates Source: Ibbotson. Fresno County Employees’ Retirement Association PAGE 63
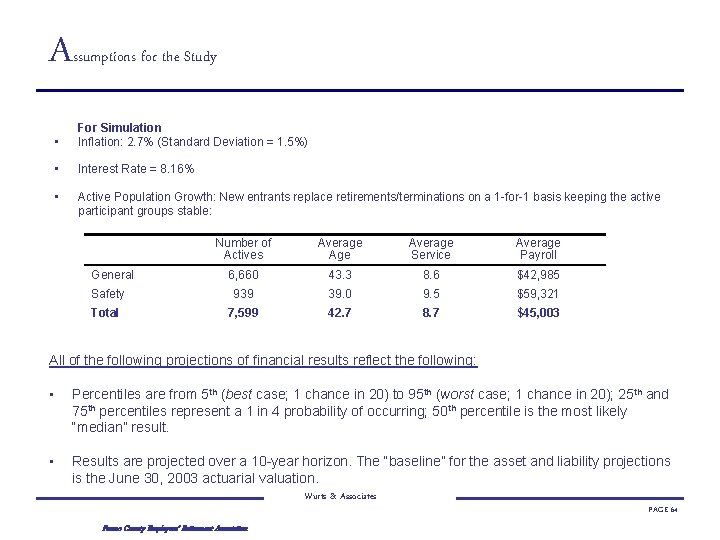
A ssumptions for the Study • For Simulation Inflation: 2. 7% (Standard Deviation = 1. 5%) • Interest Rate = 8. 16% • Active Population Growth: New entrants replace retirements/terminations on a 1 -for-1 basis keeping the active participant groups stable: Number of Actives Average Service Average Payroll 6, 660 43. 3 8. 6 $42, 985 Safety 939 39. 0 9. 5 $59, 321 Total 7, 599 42. 7 8. 7 $45, 003 General All of the following projections of financial results reflect the following: • Percentiles are from 5 th (best case; 1 chance in 20) to 95 th (worst case; 1 chance in 20); 25 th and 75 th percentiles represent a 1 in 4 probability of occurring; 50 th percentile is the most likely “median” result. • Results are projected over a 10 -year horizon. The “baseline” for the asset and liability projections is the June 30, 2003 actuarial valuation. Wurts & Associates Fresno County Employees’ Retirement Association PAGE 64
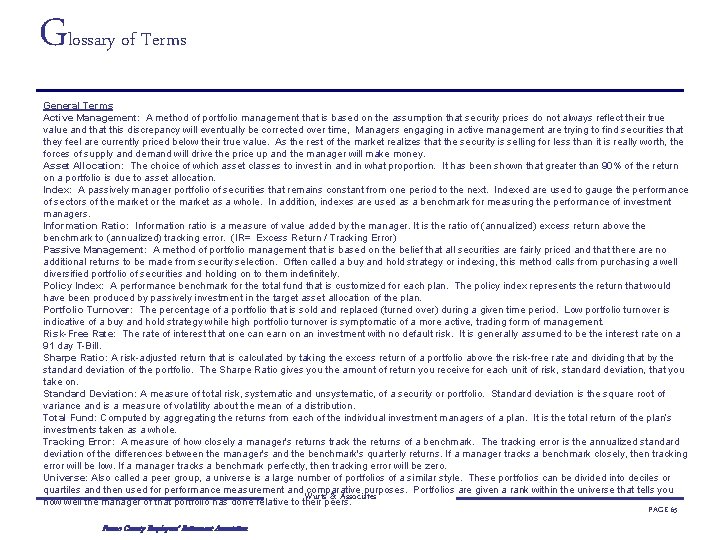
Glossary of Terms General Terms Active Management: A method of portfolio management that is based on the assumption that security prices do not always reflect their true value and that this discrepancy will eventually be corrected over time, Managers engaging in active management are trying to find securities that they feel are currently priced below their true value. As the rest of the market realizes that the security is selling for less than it is really worth, the forces of supply and demand will drive the price up and the manager will make money. Asset Allocation: The choice of which asset classes to invest in and in what proportion. It has been shown that greater than 90% of the return on a portfolio is due to asset allocation. Index: A passively manager portfolio of securities that remains constant from one period to the next. Indexed are used to gauge the performance of sectors of the market or the market as a whole. In addition, indexes are used as a benchmark for measuring the performance of investment managers. Information Ratio: Information ratio is a measure of value added by the manager. It is the ratio of (annualized) excess return above the benchmark to (annualized) tracking error. (IR= Excess Return / Tracking Error) Passive Management: A method of portfolio management that is based on the belief that all securities are fairly priced and that there are no additional returns to be made from security selection. Often called a buy and hold strategy or indexing, this method calls from purchasing a well diversified portfolio of securities and holding on to them indefinitely. Policy Index: A performance benchmark for the total fund that is customized for each plan. The policy index represents the return that would have been produced by passively investment in the target asset allocation of the plan. Portfolio Turnover: The percentage of a portfolio that is sold and replaced (turned over) during a given time period. Low portfolio turnover is indicative of a buy and hold strategy while high portfolio turnover is symptomatic of a more active, trading form of management. Risk-Free Rate: The rate of interest that one can earn on an investment with no default risk. It is generally assumed to be the interest rate on a 91 day T-Bill. Sharpe Ratio: A risk-adjusted return that is calculated by taking the excess return of a portfolio above the risk-free rate and dividing that by the standard deviation of the portfolio. The Sharpe Ratio gives you the amount of return you receive for each unit of risk, standard deviation, that you take on. Standard Deviation: A measure of total risk, systematic and unsystematic, of a security or portfolio. Standard deviation is the square root of variance and is a measure of volatility about the mean of a distribution. Total Fund: Computed by aggregating the returns from each of the individual investment managers of a plan. It is the total return of the plan’s investments taken as a whole. Tracking Error: A measure of how closely a manager's returns track the returns of a benchmark. The tracking error is the annualized standard deviation of the differences between the manager's and the benchmark's quarterly returns. If a manager tracks a benchmark closely, then tracking error will be low. If a manager tracks a benchmark perfectly, then tracking error will be zero. Universe: Also called a peer group, a universe is a large number of portfolios of a similar style. These portfolios can be divided into deciles or quartiles and then used for performance measurement and comparative purposes. Portfolios are given a rank within the universe that tells you Wurts & Associates how well the manager of that portfolio has done relative to their peers. PAGE 65 Fresno County Employees’ Retirement Association
- Slides: 65