8 Operating Assets Property Plant and Equipment and
- Slides: 41
8 Operating Assets Property, Plant, and Equipment, and Intangibles Power. Point Author: Catherine Lumbattis COPYRIGHT © 2011 South-Western/Cengage Learning
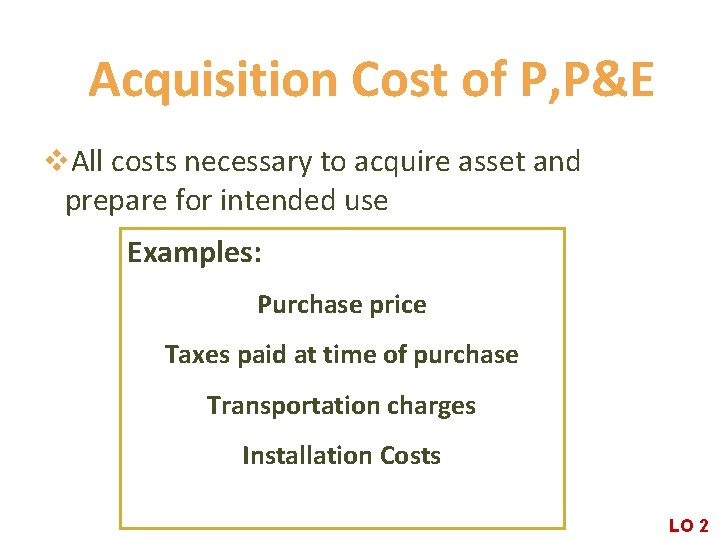
Acquisition Cost of P, P&E v. All costs necessary to acquire asset and prepare for intended use Examples: Purchase price Purchase Taxes paid at time of purchase Price + Transportation charges Taxes Installation Costs LO 2
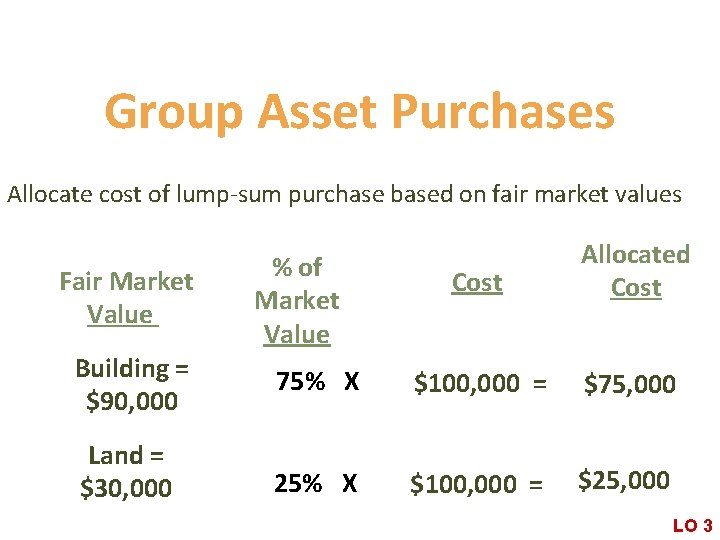
Group Asset Purchases Allocate cost of lump-sum purchase based on fair market values Fair Market Value Building = $90, 000 Land = $30, 000 Cost Allocated Cost 75% X $100, 000 = $75, 000 25% X $100, 000 = $25, 000 % of Market Value LO 3
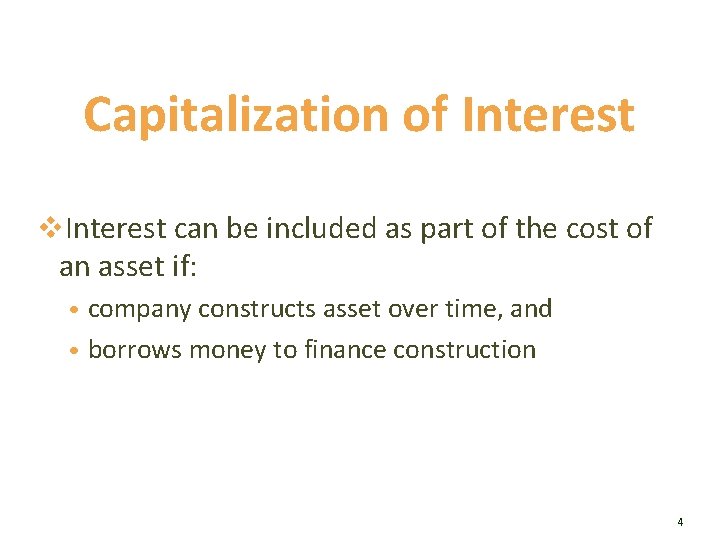
Capitalization of Interest v. Interest can be included as part of the cost of an asset if: • company constructs asset over time, and • borrows money to finance construction 4
Land Improvements v. Land improvements with a limited life should be kept separate from the land since: • Land improvements that have a limited life would be subject to depreciation over the useful life of the improvement • Land has an unlimited life and therefore is not subject to depreciation 5
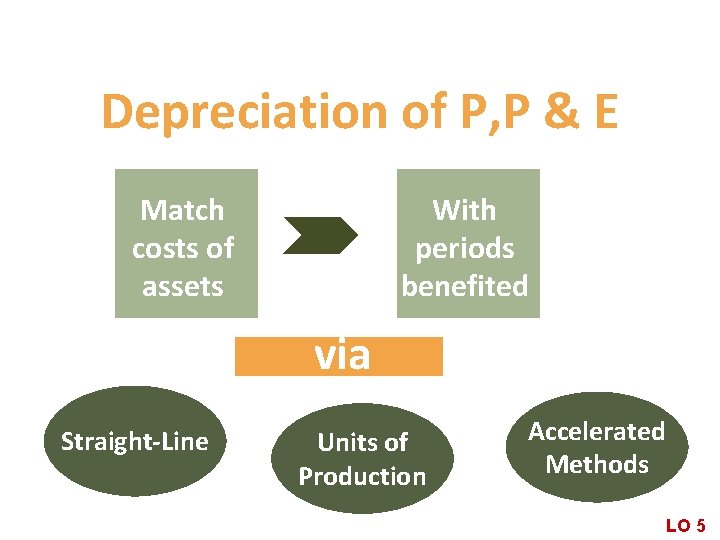
Depreciation of P, P & E Match costs of assets With periods benefited via Straight-Line Units of Production Accelerated Methods LO 5
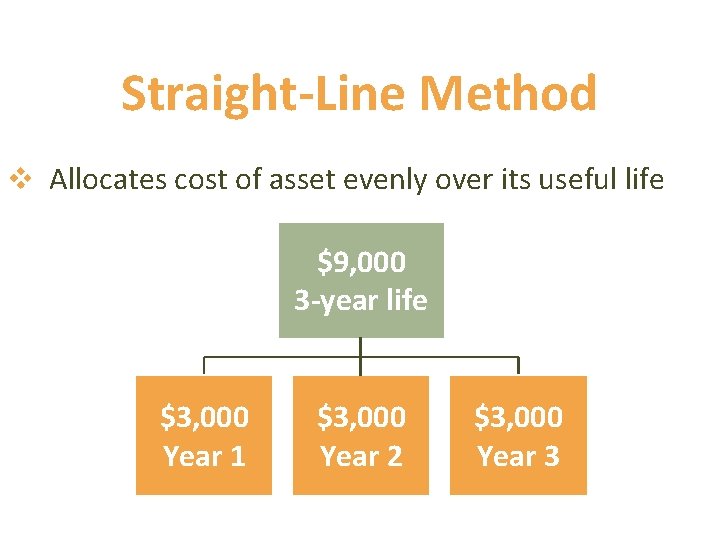
Straight-Line Method v Allocates cost of asset evenly over its useful life $9, 000 3 -year life $3, 000 Year 1 $3, 000 Year 2 $3, 000 Year 3
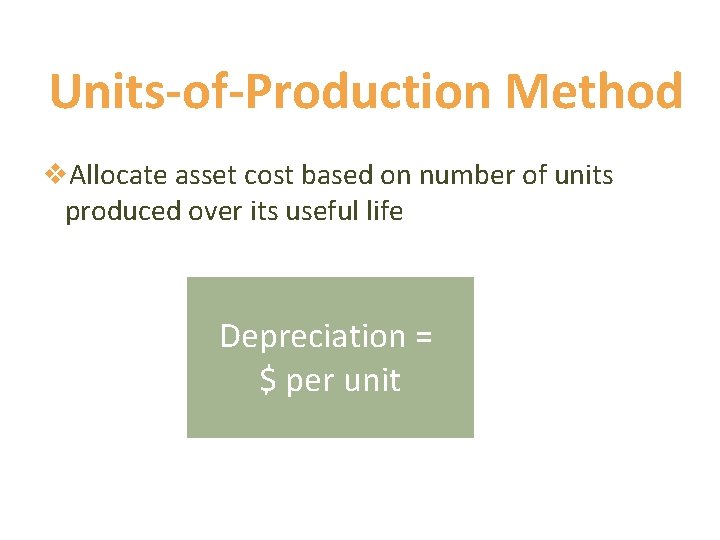
Units-of-Production Method v. Allocate asset cost based on number of units produced over its useful life Depreciation = $ per unit
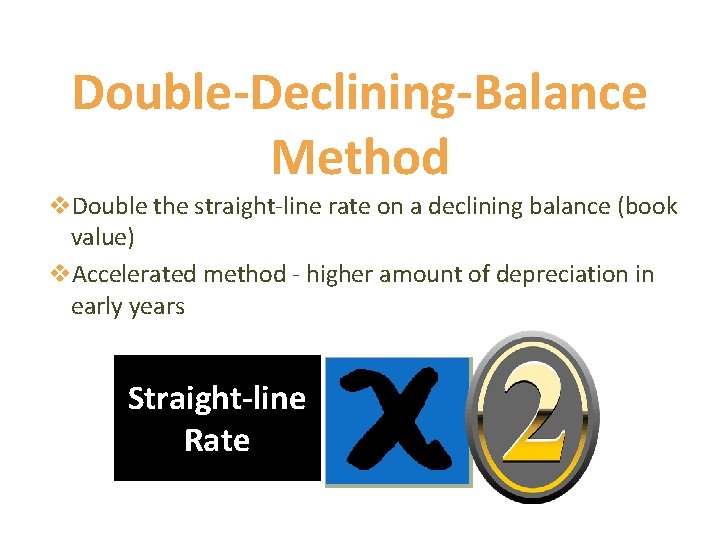
Double-Declining-Balance Method v. Double the straight-line rate on a declining balance (book value) v. Accelerated method - higher amount of depreciation in early years Straight-line Rate
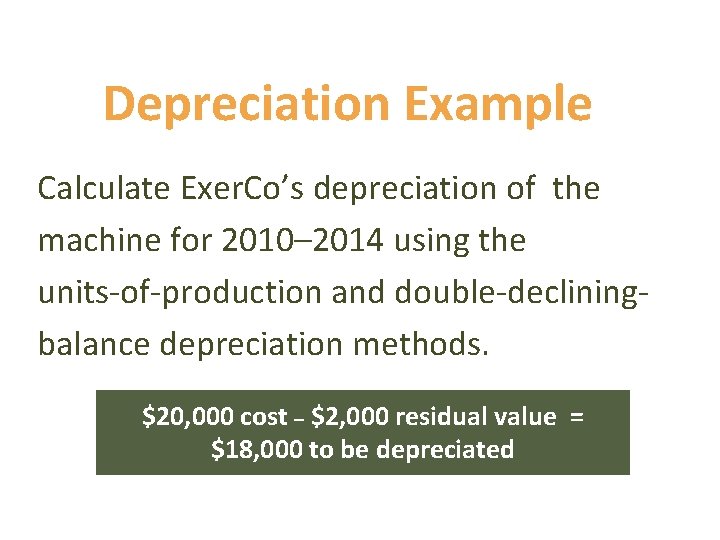
Depreciation Example Calculate Exer. Co’s depreciation of the machine for 2010– 2014 using the units-of-production and double-decliningbalance depreciation methods. $20, 000 cost – $2, 000 residual value = $18, 000 to be depreciated
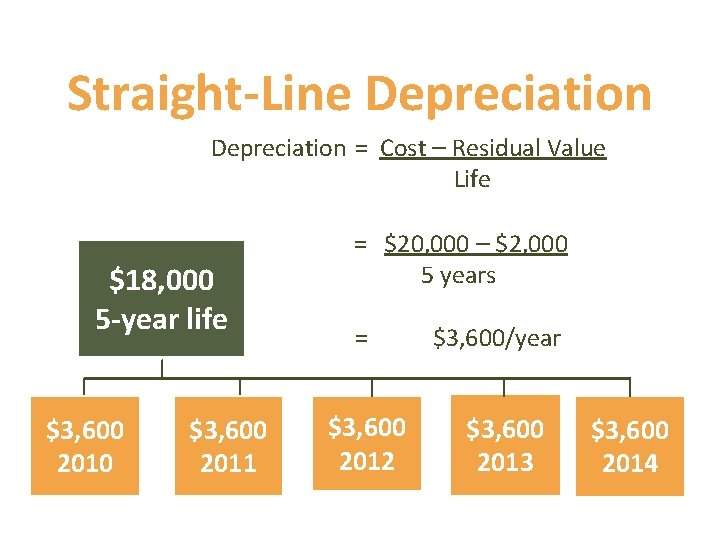
Straight-Line Depreciation = Cost – Residual Value Life $18, 000 5 -year life $3, 600 2010 $3, 600 2011 = $20, 000 – $2, 000 5 years = $3, 600 2012 $3, 600/year $3, 600 2013 $3, 600 2014
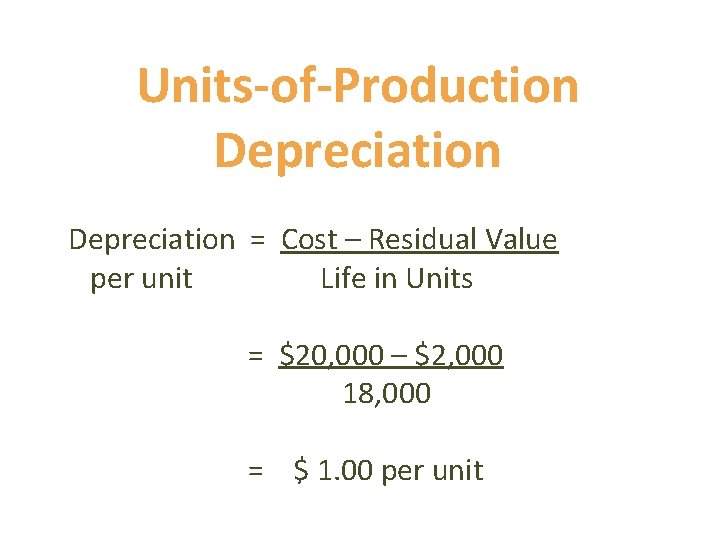
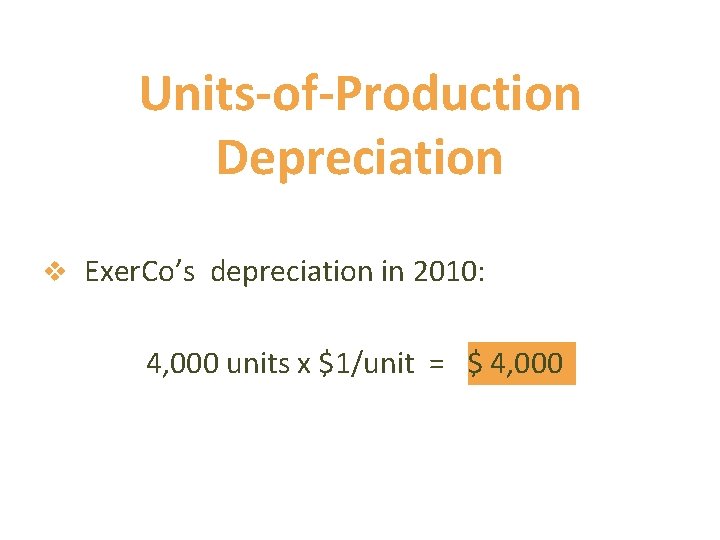
Units-of-Production Depreciation = Cost – Residual Value per unit Life in Units = $20, 000 – $2, 000 18, 000 = $ 1. 00 per unit
Units-of-Production Depreciation v Exer. Co’s depreciation in 2010: 4, 000 units x $1/unit = $ 4, 000
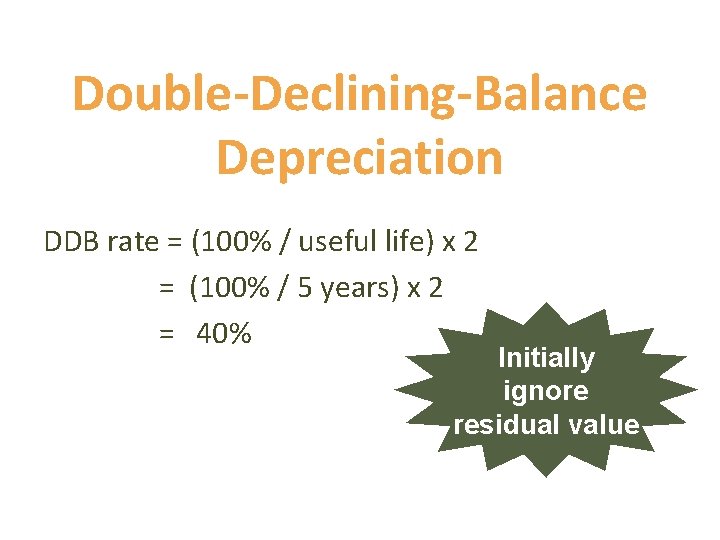
Double-Declining-Balance Depreciation DDB rate = (100% / useful life) x 2 = (100% / 5 years) x 2 = 40% Initially ignore residual value
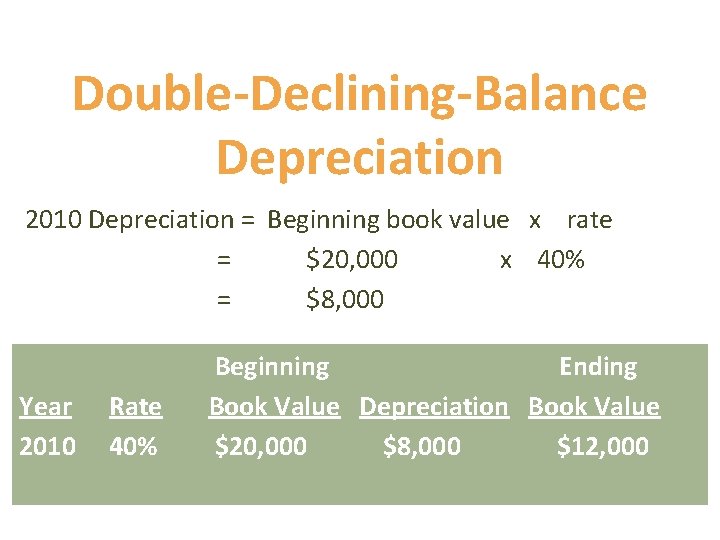
Double-Declining-Balance Depreciation 2010 Depreciation = Beginning book value x rate = $20, 000 x 40% = $8, 000 Year 2010 Rate 40% Beginning Ending Book Value Depreciation Book Value $20, 000 $8, 000 $12, 000
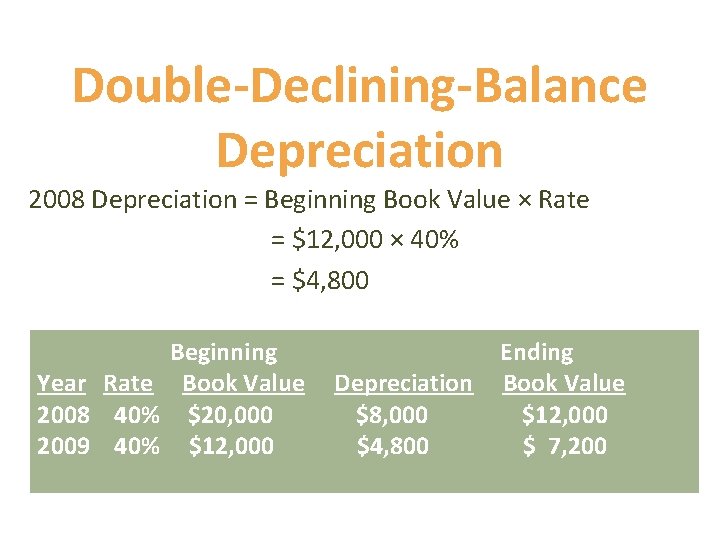
Double-Declining-Balance Depreciation 2008 Depreciation = Beginning Book Value × Rate = $12, 000 × 40% = $4, 800 Beginning Year Rate Book Value 2008 40% $20, 000 2009 40% $12, 000 Depreciation $8, 000 $4, 800 Ending Book Value $12, 000 $ 7, 200
Reasons for Choosing Straight-Line Depreciation Simplicity Reporting to stockholders Comparability Bonus plans
Reasons for Choosing Accelerated Methods v. Technological rate of change and competitiveness v. Minimize taxable income v. Comparability
Changes in Depreciation Estimates v. Recompute depreciation schedule using new estimates v. Record prospectively (i. e. , change should affect current and future years only) LO 6
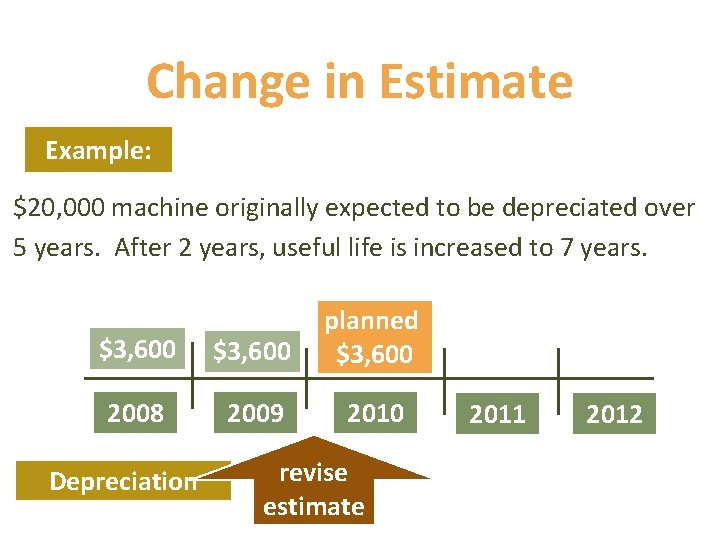
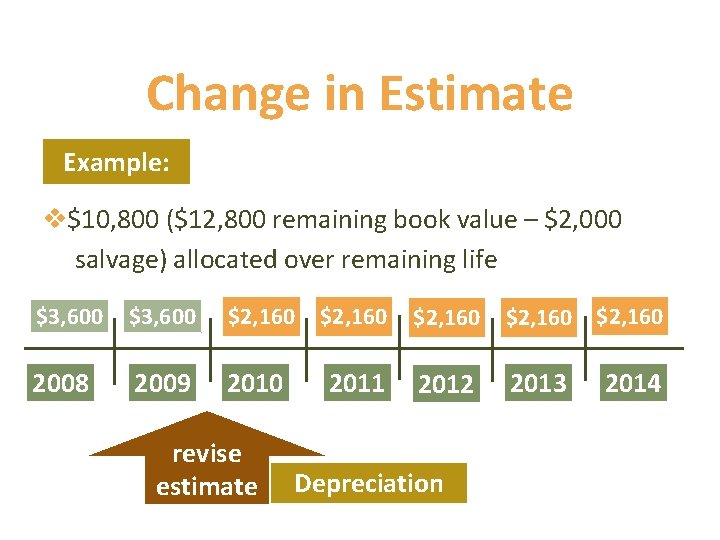
Change in Estimate Example: $20, 000 machine originally expected to be depreciated over 5 years. After 2 years, useful life is increased to 7 years. $3, 600 planned $3, 600 2008 2009 2010 Depreciation revise estimate 2011 2012
Change in Estimate Example: v$10, 800 ($12, 800 remaining book value – $2, 000 salvage) allocated over remaining life $3, 600 $2, 160 $2, 160 2008 2009 2010 2011 2012 2013 revise estimate Depreciation 2014
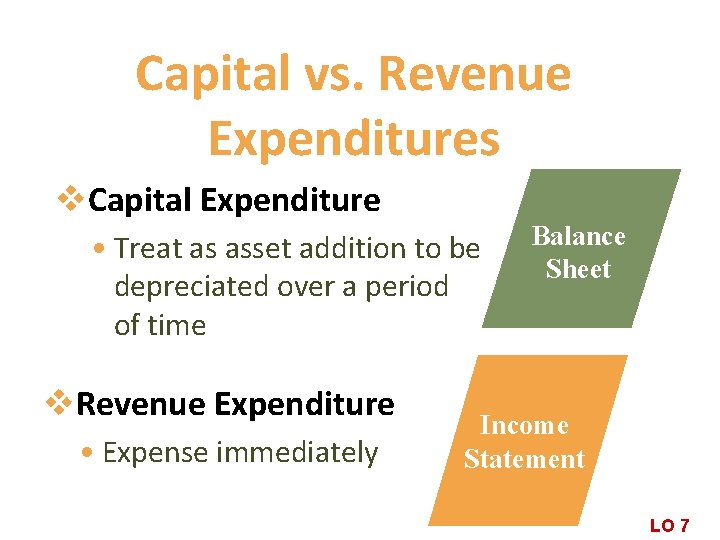
Capital vs. Revenue Expenditures v. Capital Expenditure • Treat as asset addition to be depreciated over a period of time v. Revenue Expenditure • Expense immediately Balance Sheet Income Statement LO 7
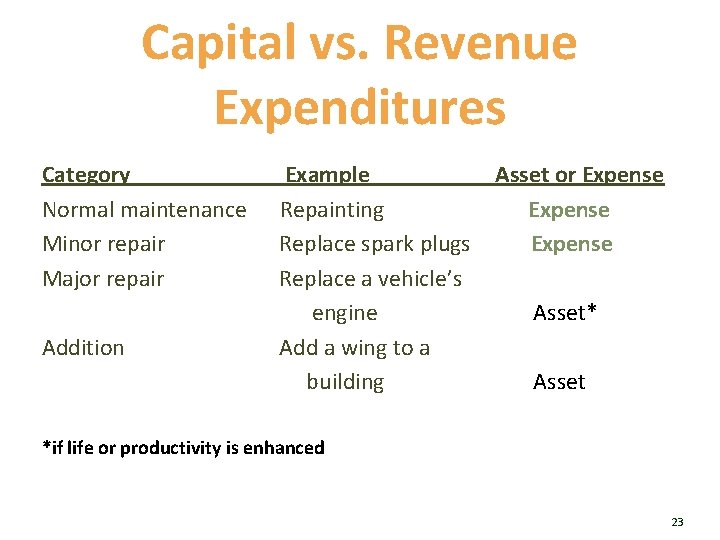
Capital vs. Revenue Expenditures Category Normal maintenance Minor repair Major repair Addition Example Repainting Replace spark plugs Replace a vehicle’s engine Add a wing to a building Asset or Expense Asset* Asset *if life or productivity is enhanced 23
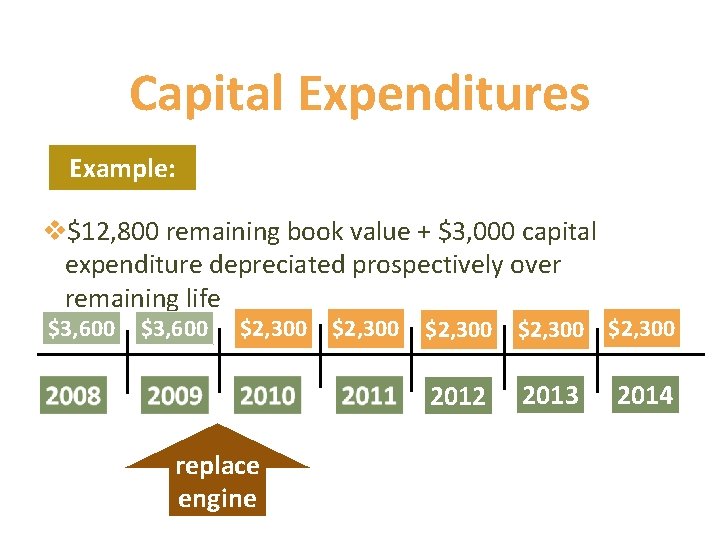
Capital Expenditures Example: v$12, 800 remaining book value + $3, 000 capital expenditure depreciated prospectively over remaining life $3, 600 $2, 300 replace engine $2, 300 2012 2013 2014
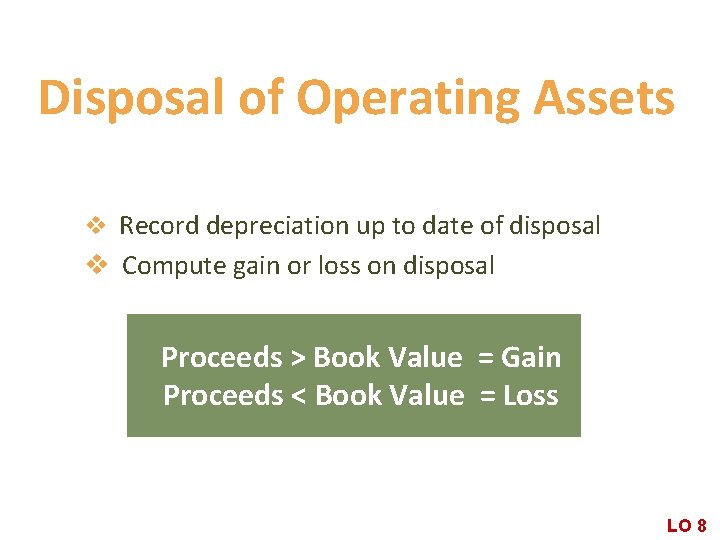
Disposal of Operating Assets v Record depreciation up to date of disposal v Compute gain or loss on disposal Proceeds > Book Value = Gain Proceeds < Book Value = Loss LO 8
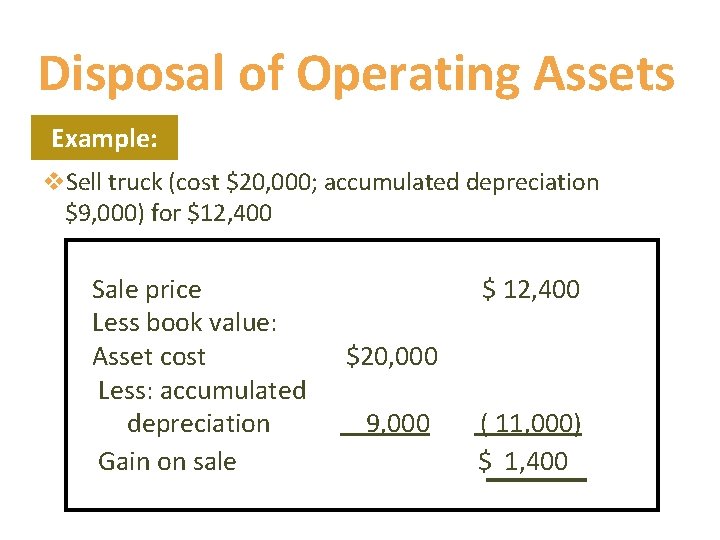
Disposal of Operating Assets Example: v. Sell truck (cost $20, 000; accumulated depreciation $9, 000) for $12, 400 Sale price Less book value: Asset cost Less: accumulated depreciation Gain on sale $ 12, 400 $20, 000 9, 000 ( 11, 000) $ 1, 400
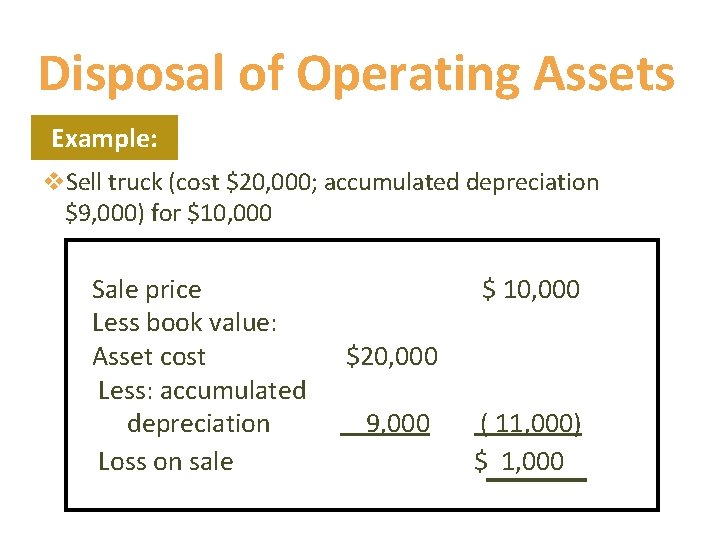
Disposal of Operating Assets Example: v. Sell truck (cost $20, 000; accumulated depreciation $9, 000) for $10, 000 Sale price Less book value: Asset cost Less: accumulated depreciation Loss on sale $ 10, 000 $20, 000 9, 000 ( 11, 000) $ 1, 000
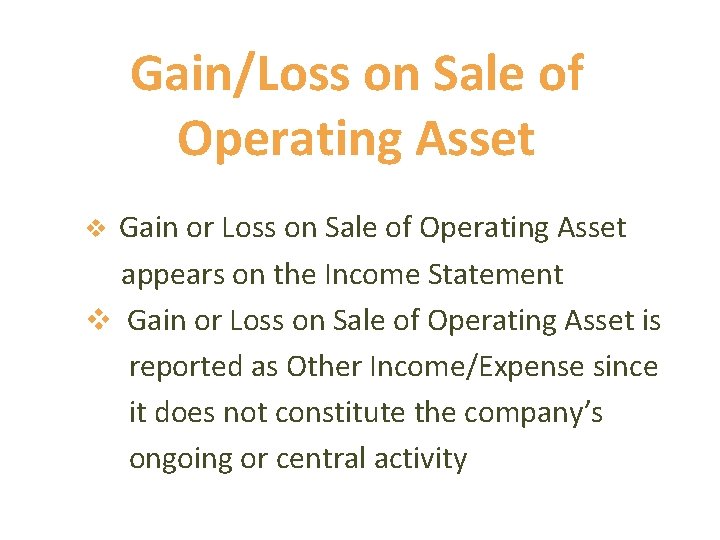
Gain/Loss on Sale of Operating Asset Gain or Loss on Sale of Operating Asset appears on the Income Statement v Gain or Loss on Sale of Operating Asset is reported as Other Income/Expense since it does not constitute the company’s ongoing or central activity v
IFRS and Property, Plant, and Equipment There are two important differences between U. S. GAAP and International Accounting Standards(IFRS): v. IFRS requires estimates of residual value and the life of the asset be reviewed at least annually. FASB standards does not require the annual review v. International Standards allow (but do not require) companies to revalue these assets to reflect their fair market values. FASB does not allow this revaluing to fair market value.
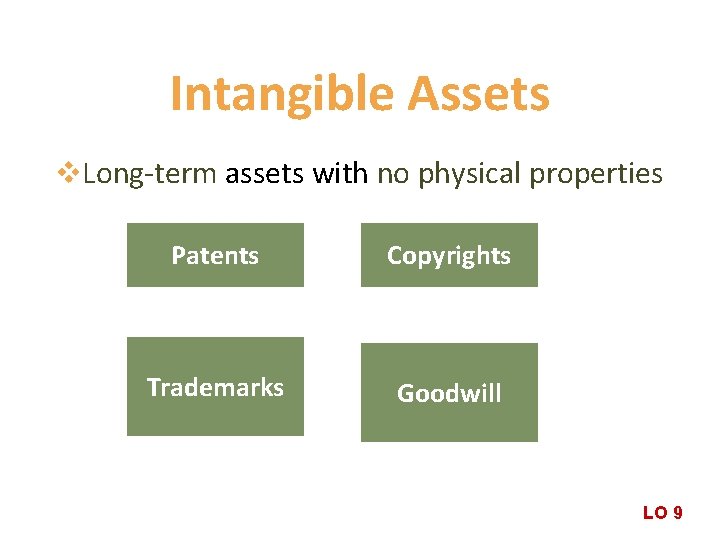
Intangible Assets v. Long-term assets with no physical properties Patents Copyrights Trademarks Goodwill LO 9
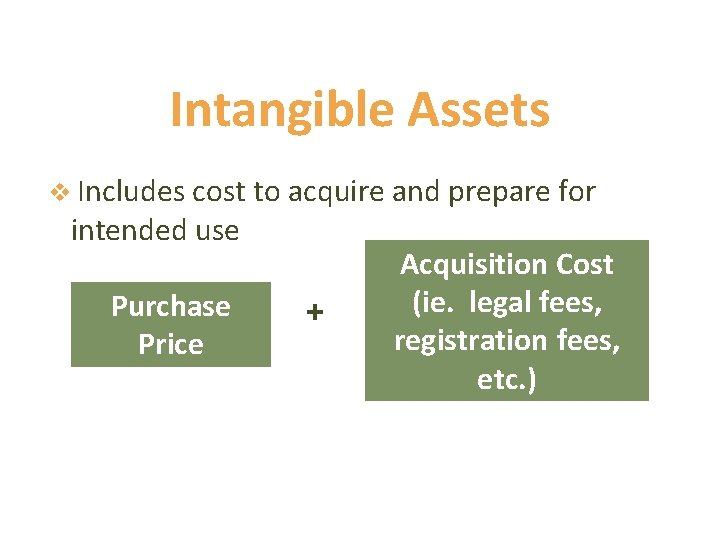
Intangible Assets v Includes cost to acquire and prepare for intended use Purchase Price + Acquisition Cost (ie. legal fees, registration fees, etc. ) +
Research & Development v. Must be expensed in period incurred v. Difficult to identify future benefits
Amortization of Intangibles v. Normally recorded using straight-line method v. Reported net of accumulated amortization v. Amortized over legal or useful life, whichever is shorter LO 10
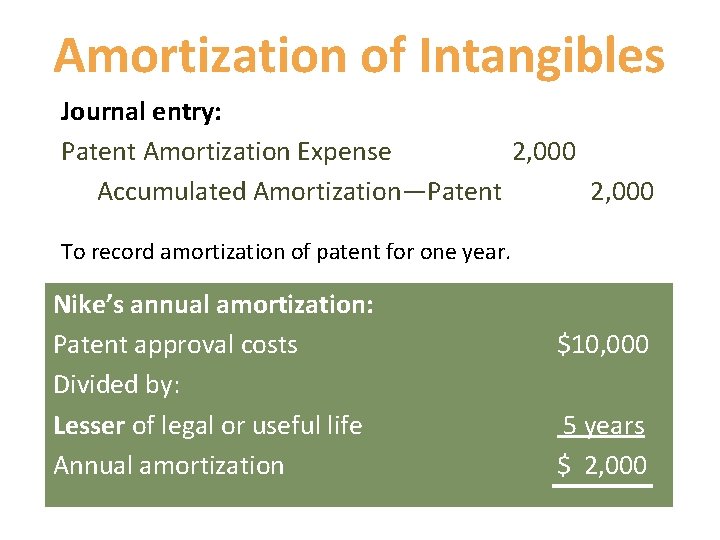
Amortization of Intangibles Journal entry: Patent Amortization Expense 2, 000 Accumulated Amortization—Patent 2, 000 To record amortization of patent for one year. Nike’s annual amortization: Patent approval costs Divided by: Lesser of legal or useful life Annual amortization $10, 000 5 years $ 2, 000
Intangibles with Indefinite Life v. Amortization is not recognized on an asset with an indefinite life eg. Trademarks, goodwill and broadcast licenses v. For intangibles with indefinite lives, impairment of these assets must be considered. v. If an impairment has occurred, a loss should be recognized
IFRS and Intangible Assets v. International Standards are more flexible in allowing the use of market values for intangible assets for those assets with an “active market” v. FASB requires all research and development costs be treated as an expense while International Standards require research cost be expensed and development costs can be capitalized if certain criteria are met
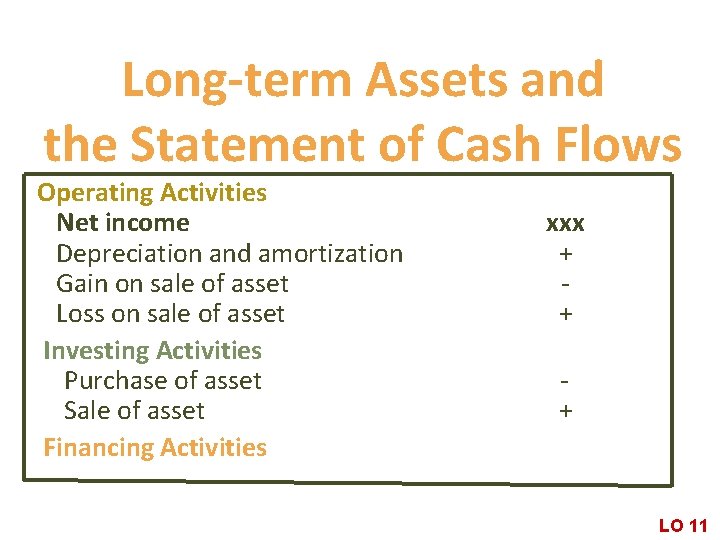
Long-term Assets and the Statement of Cash Flows Operating Activities Net income Depreciation and amortization Gain on sale of asset Loss on sale of asset Investing Activities Purchase of asset Sale of asset Financing Activities xxx + + + LO 11
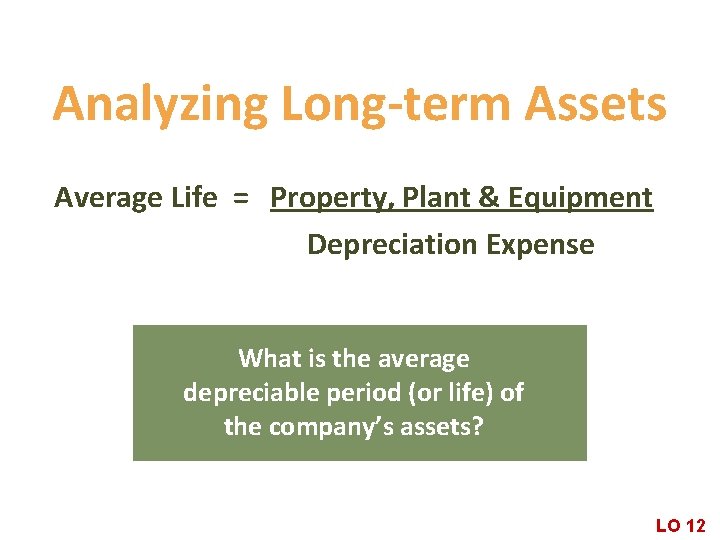
Analyzing Long-term Assets Average Life = Property, Plant & Equipment Depreciation Expense What is the average depreciable period (or life) of the company’s assets? LO 12
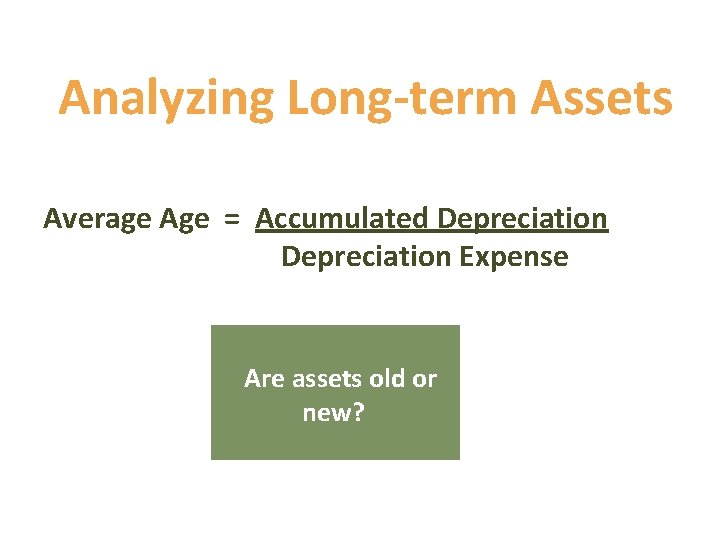
Analyzing Long-term Assets Average Age = Accumulated Depreciation Expense Are assets old or new?
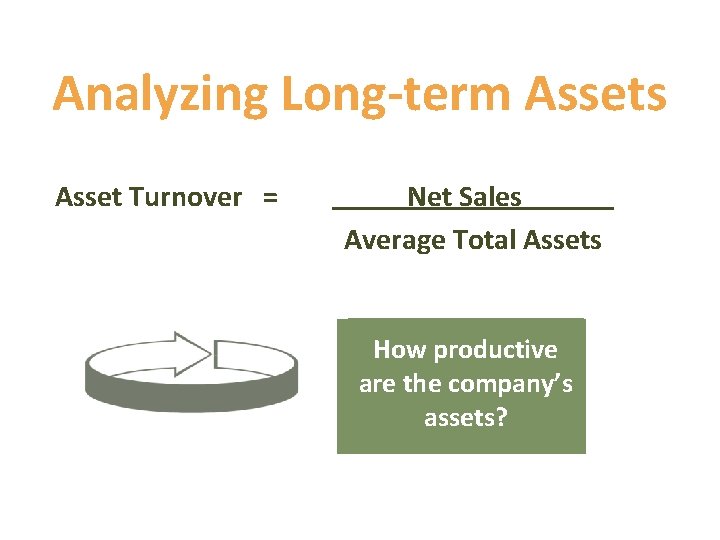
Analyzing Long-term Assets Asset Turnover = Net Sales Average Total Assets How productive are the company’s assets?
End of Chapter 8