4 2 Polynomial Functions and Models Understand the




- Slides: 15
4. 2 Polynomial Functions and Models ♦ Understand the graphs of polynomial functions. ♦ Evaluate and graph piecewise-defined functions Copyright © 2006 Pearson Education, Inc. Publishing as Pearson Addison-Wesley
Graphs of Polynomial Functions Copyright © 2006 Pearson Education, Inc. Publishing as Pearson Addison-Wesley Slide 4 - 2
Constant Polynomial Function Has no x-intercepts or turning points Copyright © 2006 Pearson Education, Inc. Publishing as Pearson Addison-Wesley Slide 4 - 3
Linear Polynomial Function Degree 1 and one x-intercept and no turning points. Copyright © 2006 Pearson Education, Inc. Publishing as Pearson Addison-Wesley Slide 4 - 4
Quadratic Polynomial Functions Degree 2, parabola that opens up or down. Can have zero, one or two x-intercepts. Has exactly one turning point, which is also the vertex. Copyright © 2006 Pearson Education, Inc. Publishing as Pearson Addison-Wesley Slide 4 - 5
Cubic Polynomial Functions Degree 3, can have zero or two turning points. Copyright © 2006 Pearson Education, Inc. Publishing as Pearson Addison-Wesley Slide 4 - 6
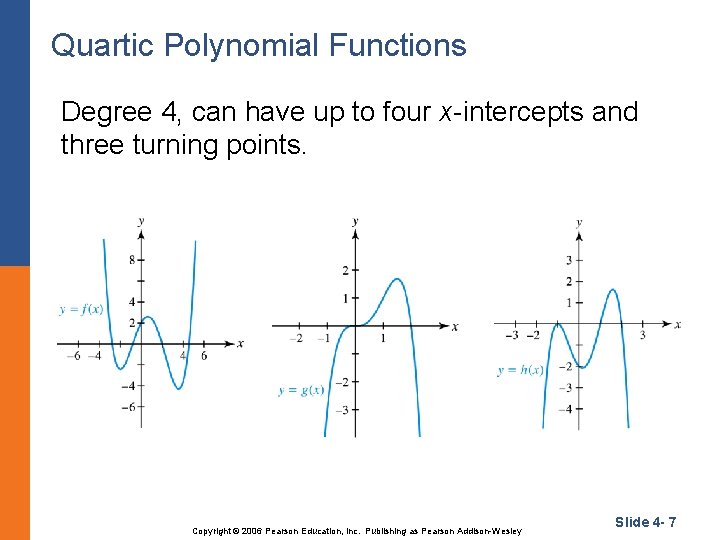
Quartic Polynomial Functions Degree 4, can have up to four x-intercepts and three turning points. Copyright © 2006 Pearson Education, Inc. Publishing as Pearson Addison-Wesley Slide 4 - 7
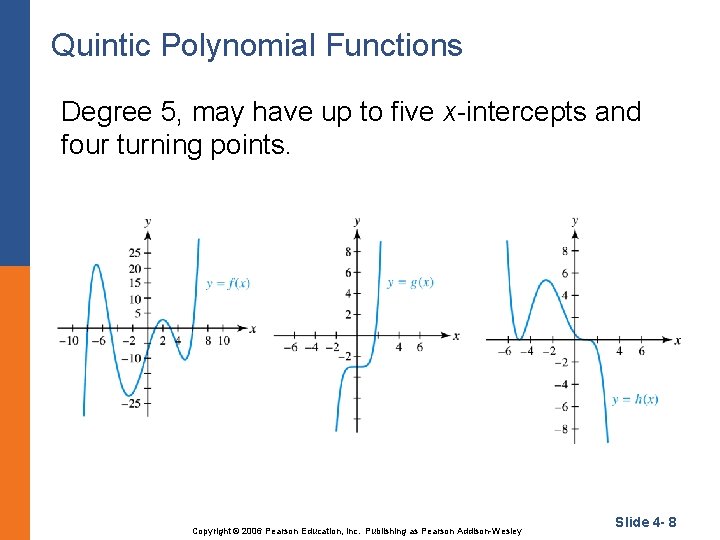
Quintic Polynomial Functions Degree 5, may have up to five x-intercepts and four turning points. Copyright © 2006 Pearson Education, Inc. Publishing as Pearson Addison-Wesley Slide 4 - 8
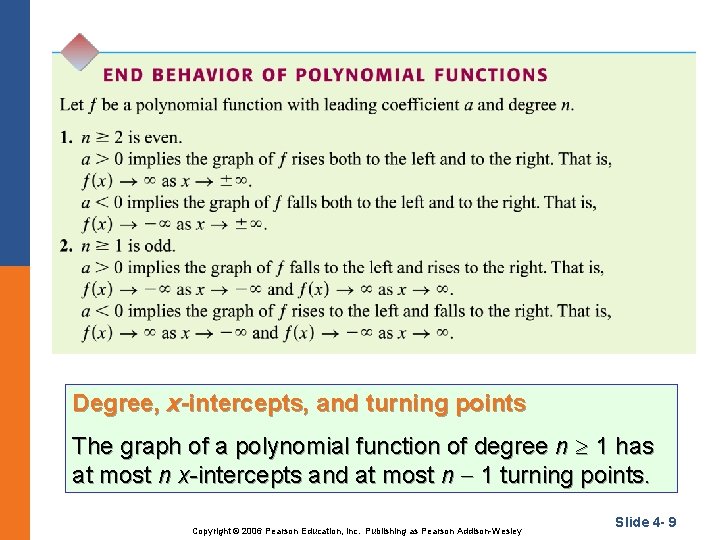
Degree, x-intercepts, and turning points The graph of a polynomial function of degree n 1 has at most n x-intercepts and at most n 1 turning points. Copyright © 2006 Pearson Education, Inc. Publishing as Pearson Addison-Wesley Slide 4 - 9
Example Use the graph of the polynomial function shown. a) How many turning points and x-intercepts are there? b) Is the leading coefficient a positive or negative? Is the degree odd or even? c) Determine the minimum degree of f. Solution Copyright © 2006 Pearson Education, Inc. Publishing as Pearson Addison-Wesley Slide 4 - 10
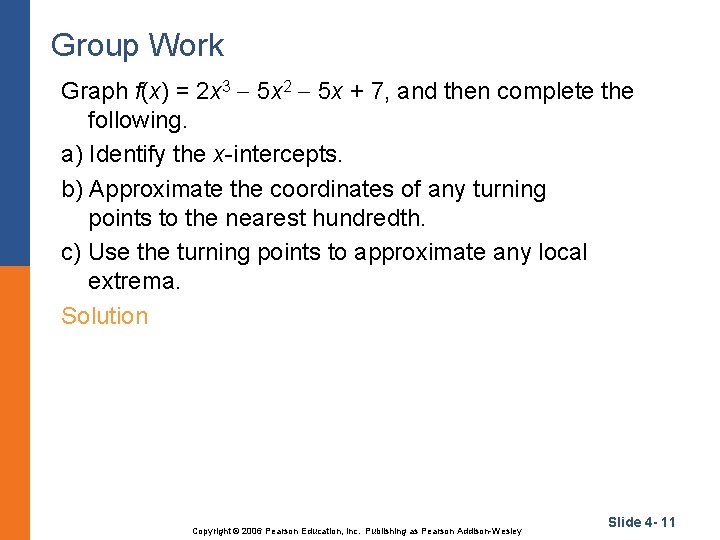
Group Work Graph f(x) = 2 x 3 5 x 2 5 x + 7, and then complete the following. a) Identify the x-intercepts. b) Approximate the coordinates of any turning points to the nearest hundredth. c) Use the turning points to approximate any local extrema. Solution Copyright © 2006 Pearson Education, Inc. Publishing as Pearson Addison-Wesley Slide 4 - 11
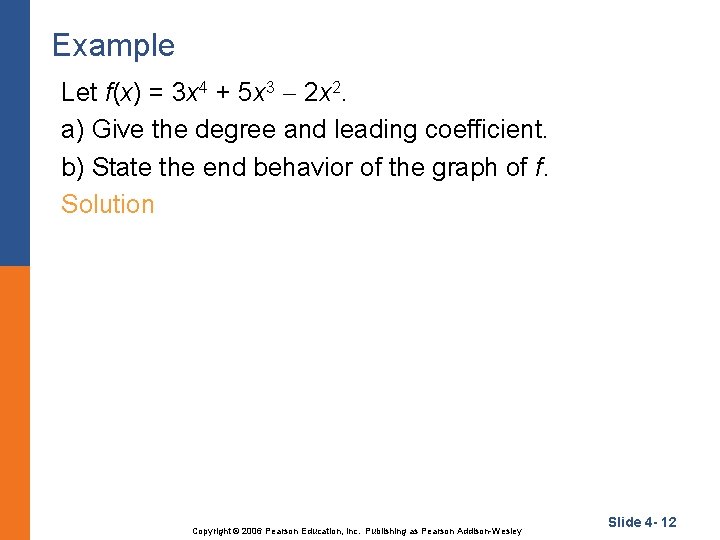
Example Let f(x) = 3 x 4 + 5 x 3 2 x 2. a) Give the degree and leading coefficient. b) State the end behavior of the graph of f. Solution Copyright © 2006 Pearson Education, Inc. Publishing as Pearson Addison-Wesley Slide 4 - 12
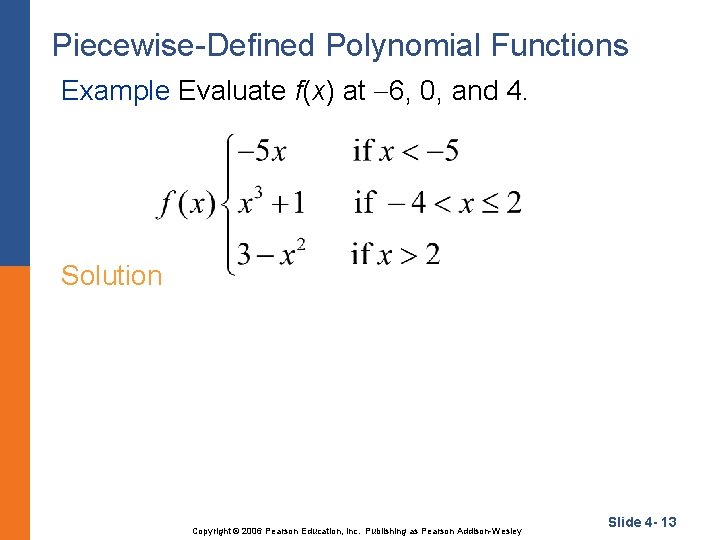
Piecewise-Defined Polynomial Functions Example Evaluate f(x) at 6, 0, and 4. Solution Copyright © 2006 Pearson Education, Inc. Publishing as Pearson Addison-Wesley Slide 4 - 13
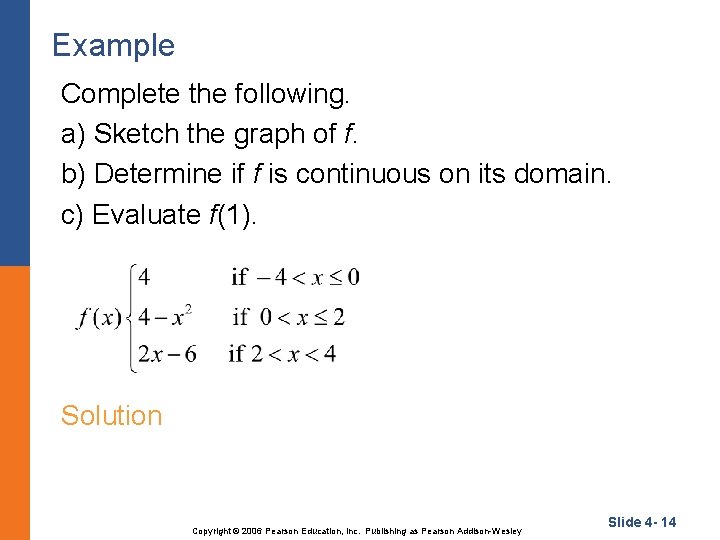
Example Complete the following. a) Sketch the graph of f. b) Determine if f is continuous on its domain. c) Evaluate f(1). Solution Copyright © 2006 Pearson Education, Inc. Publishing as Pearson Addison-Wesley Slide 4 - 14
Copyright © 2006 Pearson Education, Inc. Publishing as Pearson Addison-Wesley Slide 4 - 15