Graphing Quadratic Polynomial Functions Table of Contents 1

Graphing Quadratic & Polynomial Functions
 2. Graphing in Vertex")
Table of Contents 1. Introduction to Graphing Quadratics (19. 1) 2. Graphing in Vertex Form Using Transformations (19. 2) 3. Graphing in Standard Form (19. 3) 4. Graphing in Factored Form (20. 1 and 20. 2) 5. Graphing Polynomials (24. 1)

Introduction to Graphing Quadratics

Quadratics • Definition: Equations and expressions involving polynomials where the highest power is 2. • Graphically: always a “U” shape • Algebraically: Values increase at an increasing rate • Also named parabola
 of the U is calle")
Parts of Quadratic Graph The botto m (or top) of the U is calle d the v ertex, or the turni ng point. The verte x of a para bola openi ng upwa rd is also calle d the m inimu m point. The verte x of a para bola openi ng down ward is also calle d the m axim um point. The xinter cepts are calle d the r oots, or the zeros. To find thex inter cepts, set a x 2 + bx + c = 0. The ends of the grap h con tinue to positi ve infini ty (or negat ive infini ty) unles s the doma in (the x's to be grap hed) is other wise speci fied.

Vertex: Minimum vs. Maximum
2 + k Standard")
3 Forms of Quadratic Equations Vertex Form: y= a(x – h)2 + k Standard Form: 2 y = ax + bx + c Factored Form: y = k(x – a)(x – b)

Sketch the Graph
= - 3 x 2 X -3 -2 -1 0 1")
Sketch the Graph g(x)= - 3 x 2 X -3 -2 -1 0 1 2 3 Y Domain: ______ Range: _______
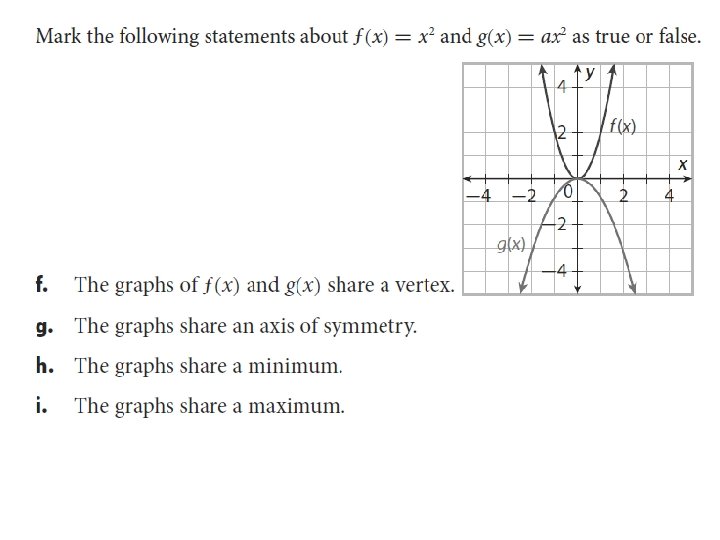
 = ax 2 2.")
Write a Function Given a Graph 1. Use form g(x) = ax 2 2. Plug in x-cord for x and y-cord of g(x) and solve for “a”

Write a Function Given a Graph

Satellite dishes reflect radio waves onto a collector by using a reflector dish shaped like a parabola. The graph shows the height h in feet of the reflector relative to the distance x in feet from the center of the satellite dish. Find the equation of the quadratic and describe what the function represents.
?")
Equation: __________ Describe: Vertex? Point: (60, 12)?

Graphing in Vertex Form Using Transformations

Graphing in Vertex Form 1. Identify the vertex. 2. Plot vertex and draw axis of symmetry. 3. Create table of values (pick 2 x-values bigger than vertex and 2 x-values smaller than vertex. )

Graph: y = (x + Identify the Vertex: _______ Is the vertex a min or max? End Behavior? X Y 2 3) -1

Graph: y = -(x – Identify the Vertex: _______ Is the vertex a min or max? End Behavior? X Y 2 2) +4

Up or Down? !

Skinny or Fat?

Transformations of Vertex Form Type of Transformation a h k Details

Graph: y = 2(x + Identify the: Vertex: ________ Is the vertex a min or max? Vertical Transformation? Horizontal Transformation? 2 3) -1

Identify the: Vertex: ________ Is the vertex a min or max? Vertical Transformation? Horizontal Transformation?

Graphing Using Standard Form

Standard Form of Quadratics Standard Form: 2 y = ax + bx + c Conditions: a, b and c must be real numbers and not be zero.

Graphing in Standard Form: •

Let’s Practice… 1. Calculate the vertex. y = - x 2 – 8 x – 15 a: ____ b: _____ c: _____ x-cord: y-cord:

Let’s Practice… 2. Calculate the vertex. y = x 2 – 4 x +5 a: ____ b: _____ c: _____ x-cord: y-cord:

Graphing in Standard Form: Part B: Find Roots/Zeros: A. Factor original equation. B. Set factors equal to zero and solve. C. The two solutions are the x-intercepts.

Let’s Practice… 3. Find zeros/roots. y = x 2 + 8 x + 15 Factor: Solve: x-intercepts:

#4: Graph: y = Identify a: ______ b: _____ c: _____ Vertex: ________ Zeros: 2 x + 5 x + 4

#5: Graph: 6 x + 8 = Identify a: ______ b: _____ c: _____ Vertex: ________ Zeros: 2 -x

#7: Graph: Identify a: ______ b: _____ c: _____ Vertex: ________ Zeros: 2 2 x – 5=-3

8. A baseball coach used a pitching machine to simulate pop flies during practice. The quadratic function h(t) = -16 t 2 + 80 t + 5 models the height in feet of the baseball after t seconds. The ball leaves the pitching machine and is caught at a height of 5 feet. How long is the baseball in the air?

# 9: Graph: Identify a: ______ b: _____ c: _____ Vertex: ________ Zeros: 2 3 x – 9 = -6

Graphing in Factored Form
(x – b) 1. Set factors (parentheses)")
Graph: Factored Form: y = k(x – a)(x – b) 1. Set factors (parentheses) equal to zero and solve. 2. Plot on graph. 3. X-value of vertex is half way between zeros (from step 1). 4. Plug in x-value to equation to find y-value of vertex.
(x – 3) Identify the: Zeros: _________ Calculate")
#1: Graph: y = (x – 1)(x – 3) Identify the: Zeros: _________ Calculate Vertex: ________ Is the vertex a min or max?

2. A tennis ball is tossed upward from a balcony. The height of the ball in feet can be modeled by the function y = -4(2 x + 1)(2 x – 3) where x is the time in seconds after the ball is released. Find the maximum height of the ball and the time it takes the ball to reach this height. Determine how long it takes the ball to hit the ground.
(x + 2) Identify the: Zeros: _________ Calculate")
#3: Graph: y = 2(x + 4)(x + 2) Identify the: Zeros: _________ Calculate Vertex: ________ Is the vertex a min or max?

#4: Graph: y = Identify the: Zeros: _________ Calculate Vertex: ________ Is the vertex a min or max? 2 x – 4 x - 5

#5: Graph: 6 x + 8 = Identify the: Zeros: _________ Calculate Vertex: ________ Is the vertex a min or max? 2 -x

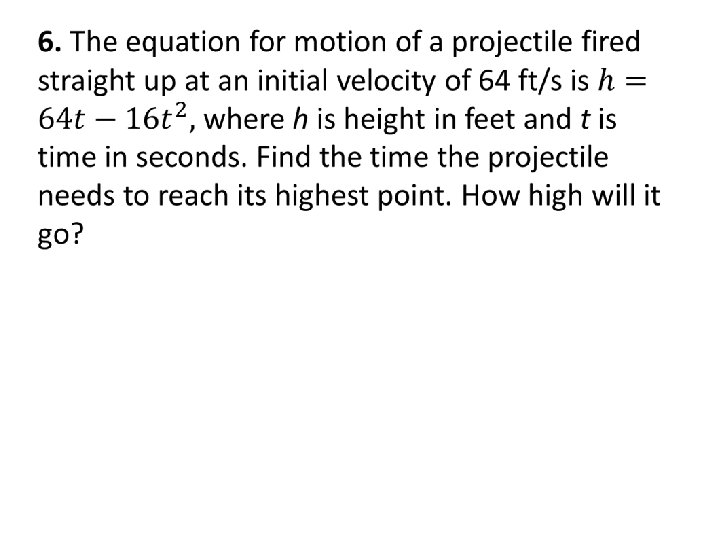
Mini Quiz 6. 7.

8.

9. 10.

Graphing Polynomials

Essential Understanding A polynomial function has distinguishing “behaviors. ” You can look at its algebraic form and know something about its graph. You can look at its graph and know something about its algebraic form.

Review: Standard Form of a Polynomial Function The standard form of a polynomial function arranges the terms by degree in descending numerical order.

Even vs. Odd Function Even function: highest degree is an even number Odd function: highest degree is an odd number Even or Odd? 1. 4 x 3 + 2 x 7 – 5 2. 5 x 9 – 11 x 2 + 8 x - 2 3. 5 x 4 + 3 x 3 -2 x 2

Even vs. Odd & End Behavior The degree of a polynomial function effects the end behavior, or the directions of the graph to the far left and to the far right. Up and Up Down and Down Up and Down

What’s the Pattern? ! All of these functions are EVEN.

What’s the Pattern? ! All of these functions are ODD.

End Behavior of a Polynomial Function You can determine the end behavior of a polynomial function of degree n from the leading coefficient in the standard form. Leading Coefficient Positive Negative Leading Degree= Even Leading Degree =Odd

What is the end behavior of the graph?

Odd vs. Even & Turning • Points The graph of a polynomial function of degree n has at most n-1 turning points. • The graph of a polynomial function of odd degree has an even number of turning points. • The graph of a polynomial function of even degree has an odd number of turning points.

Odd vs. Even & Turning Points Degree: _______ Turning Points: ________

Zeros • Like quadratic functions, polynomial functions have zeros. • Zeros occur where the function crosses or touches the x-axis. • f(x) = (x + 5)(x - 7)(3 x – 9)(2 x + 4)

Graphing Polynomials 1. Determine end behavior 2. Find zeros and plot on x-axis – Set each factor () equal to zero and solve. 3. Find y-intercept and plot on y-axis. – Plug in zero for x and solve. 4. Connect with a curve.
 = -(x + 2) (x – 4) (x + 6) End")
1. Graph: f(x) = -(x + 2) (x – 4) (x + 6) End Behavior: Roots: Y-Intercept:
 = -(x + 2) (x – 4) (x + 6)")
1 b. Graph: f(x) = -(x + 2) (x – 4) (x + 6)
 = (x - 4) (x – 5) (x + 2)(x +")
2. Graph: f(x) = (x - 4) (x – 5) (x + 2)(x + 3) End Behavior: Roots: Y-Intercept:
 = (x - 4) (x – 5) (x + 2)(x")
2 a. Graph: f(x) = (x - 4) (x – 5) (x + 2)(x + 3)

3.

4.

5. What function best represents the graph?

6.
- Slides: 68