32 alpha beta gamma delta epsilon zeta theta


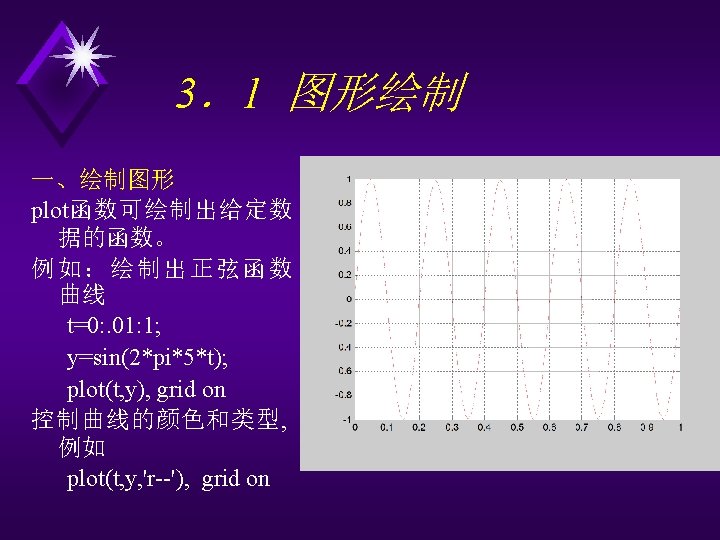


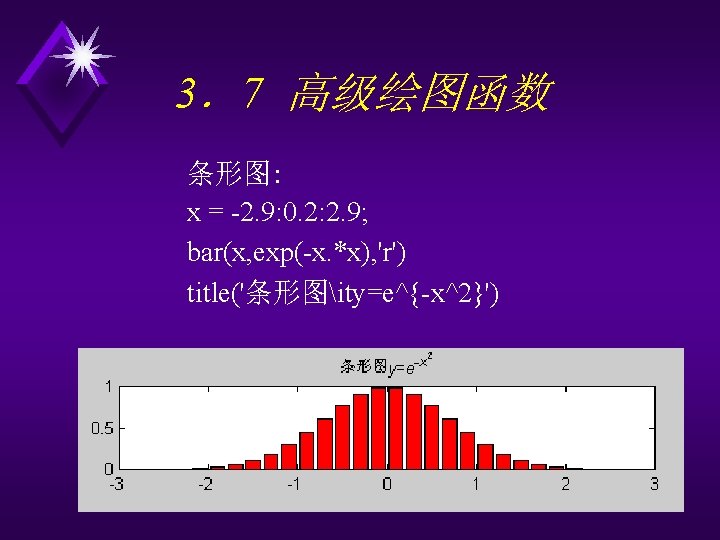
 字符序列 alpha beta gamma delta epsilon zeta theta lambda mu 字符 字符序列")
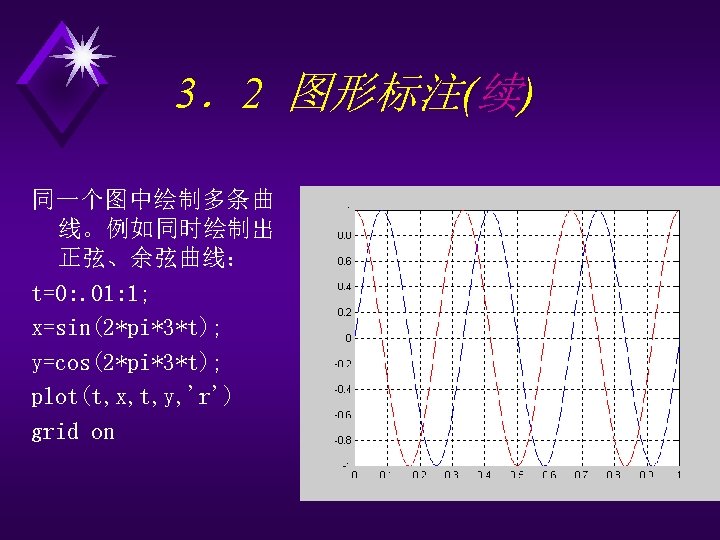
3.2 图形标注(续) 字符序列 alpha beta gamma delta epsilon zeta theta lambda mu 字符 字符序列 α phi β psi γ omega δ Gamma ε Delta ζ Theta η Lambda θ Pi λ Sigma μ Phi 见教材P 136 字符 φ ψ ω Γ Δ Θ Λ Π Σ Φ
 字符序列 pi rho sigma div ldots leq infty leftarrow uparrow pm partial")
3.2 图形标注(续) 字符序列 pi rho sigma div ldots leq infty leftarrow uparrow pm partial 字符 π ρ σ . . . 见教材P 136 字符序列 字符 Psi Ψ Omega Ω forall exists sim ~ geq leftrightarrow downarrow propto circ
 title('bf正弦曲线'), xlabel('itt'), ylabel('ity')")
3.2 图形标注(续) title('bf正弦曲线'), xlabel('itt'), ylabel('ity')
 title(‘it x^2 y_{12}^2’), xlabel(‘itt’), ylabel('ity_2')")
3.2 图形标注(续) title(‘it x^2 y_{12}^2’), xlabel(‘itt’), ylabel('ity_2')
 又例如: (legend为标注插图 说明函数) x=-2: . 1: 2; y 1=x. ^2; y 2=x.")
3.2 图形标注(续) 又例如: (legend为标注插图 说明函数) x=-2: . 1: 2; y 1=x. ^2; y 2=x. ^3; figure(1) plot(x, y 1, 'r-', x, y 2, 'k--'), grid on legend('ity=x^2', 'ity=x^3') title('ity=x^2rm和ity=x^3rm 曲线') xlabel('itx'), ylabel('ity')
 利用text函数, 采用其它字符标注: x=0: pi/50: 2*pi; y 1=sin(x); y 2=cos(x); figure(1) plot(x, y")
3.4 复杂图形绘制(续) 利用text函数, 采用其它字符标注: x=0: pi/50: 2*pi; y 1=sin(x); y 2=cos(x); figure(1) plot(x, y 1, 'k-', x, y 2, 'k-'), grid on text(pi, 0, 'leftarrow sin(alpha)') text(pi/4 -0. 05, 0, 'cos(alpha) rightarrow‘) title('sin(alpha)和cos(alpha)') xlabel('alpha'), ylabel('sin(alpha)和cos(alpha)')
![3. 5 坐标轴控制 e 1=0. 6*randn(300, 1); e 2=randn(300, 1); t=[1: 300]'*0. 001; t=err(:](http://slidetodoc.com/presentation_image_h2/287f208c23dc60b18aac40c357c64899/image-19.jpg "3. 5 坐标轴控制 e 1=0. 6*randn(300, 1); e 2=randn(300, 1); t=[1: 300]'*0. 001; t=err(:")
3. 5 坐标轴控制 e 1=0. 6*randn(300, 1); e 2=randn(300, 1); t=[1: 300]'*0. 001; t=err(: , 1); e 1=err(: , 2); e 2=err(: , 3); figure(1) subplot(2, 2, 1), plot(t, e 1), title('误差 1') subplot(2, 2, 3), plot(t, e 2), title('误差 2') subplot(2, 2, 2), plot(t, e 1) title('坐标轴调整后的误差 1') axis([0. 3 -4 4]) subplot(2, 2, 4), plot(t, e 2) title('坐标轴调整后的误差 2') axis([0. 3 -4 4])
![3.6 颜色控制: x=[-pi: pi/20: pi]; y=exp(-2*sin(x)); figure(1) plot(x, y, 'r-'), grid on xlabel('兰色的x轴标注', 'Color',](http://slidetodoc.com/presentation_image_h2/287f208c23dc60b18aac40c357c64899/image-20.jpg "3.6 颜色控制: x=[-pi: pi/20: pi]; y=exp(-2*sin(x)); figure(1) plot(x, y, 'r-'), grid on xlabel('兰色的x轴标注', 'Color',")
3.6 颜色控制: x=[-pi: pi/20: pi]; y=exp(-2*sin(x)); figure(1) plot(x, y, 'r-'), grid on xlabel('兰色的x轴标注', 'Color', 'b') ylabel('兰色的y轴标注', 'Color', 'b') title('绿色的标题(y=e^{-2 sin(x)})', 'Color', 'g') text(-0. 6, 3. 8, 'leftarrow黑色的曲线标注', 'Color', 'k')
![3.6 颜色控制(续) 灰度调色板: cmap=colormap; L=length(cmap); x=[1: L]; y=x'*ones(size(x)); figure(1) subplot(4, 1, 1) bar(x(1: 2),](http://slidetodoc.com/presentation_image_h2/287f208c23dc60b18aac40c357c64899/image-21.jpg "3.6 颜色控制(续) 灰度调色板: cmap=colormap; L=length(cmap); x=[1: L]; y=x'*ones(size(x)); figure(1) subplot(4, 1, 1) bar(x(1: 2),")
3.6 颜色控制(续) 灰度调色板: cmap=colormap; L=length(cmap); x=[1: L]; y=x'*ones(size(x)); figure(1) subplot(4, 1, 1) bar(x(1: 2), y(1: 2, : )) title('gray颜色板的颜色') colormap('gray')
 复杂的条形图: Y = round(rand(5, 3)*10); figure(1) subplot(2, 2, 1) bar(Y, 'group'), title")
3.7 高级绘图函数(续) 复杂的条形图: Y = round(rand(5, 3)*10); figure(1) subplot(2, 2, 1) bar(Y, 'group'), title 'Group' subplot(2, 2, 2) bar(Y, 'stack'), title 'Stack' subplot(2, 2, 3) barh(Y, 'stack'), title 'Stack' subplot(2, 2, 4) bar(Y, 1. 5), title 'Width = 1. 5'
![3.7 高级绘图函数(续) 饼图: x = [1. 1 2. 8 0. 5 2]; explode =](http://slidetodoc.com/presentation_image_h2/287f208c23dc60b18aac40c357c64899/image-24.jpg "3.7 高级绘图函数(续) 饼图: x = [1. 1 2. 8 0. 5 2]; explode =")
3.7 高级绘图函数(续) 饼图: x = [1. 1 2. 8 0. 5 2]; explode = [0 1 0 0 0]; figure(1) colormap hsv pie(x, explode)
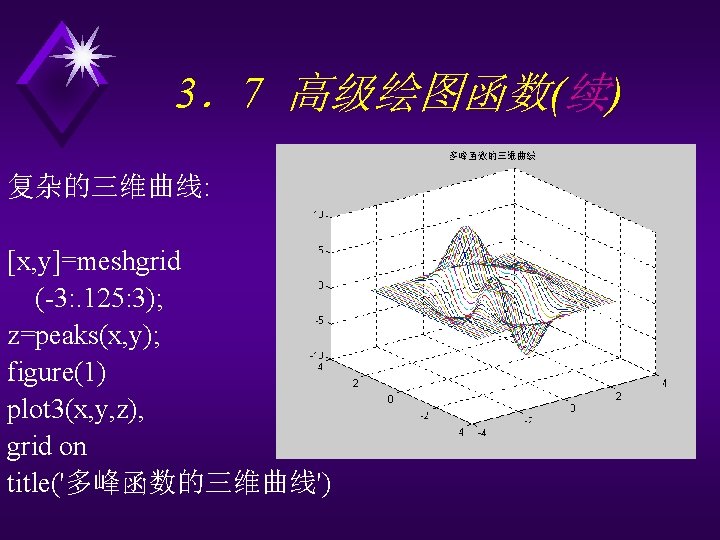
 简单的三维曲线: t = 0: pi/50: 8*pi; figure(1) plot 3(sin(t), cos(t), t) grid")
3.7 高级绘图函数(续) 简单的三维曲线: t = 0: pi/50: 8*pi; figure(1) plot 3(sin(t), cos(t), t) grid on, axis square title('三维曲线')


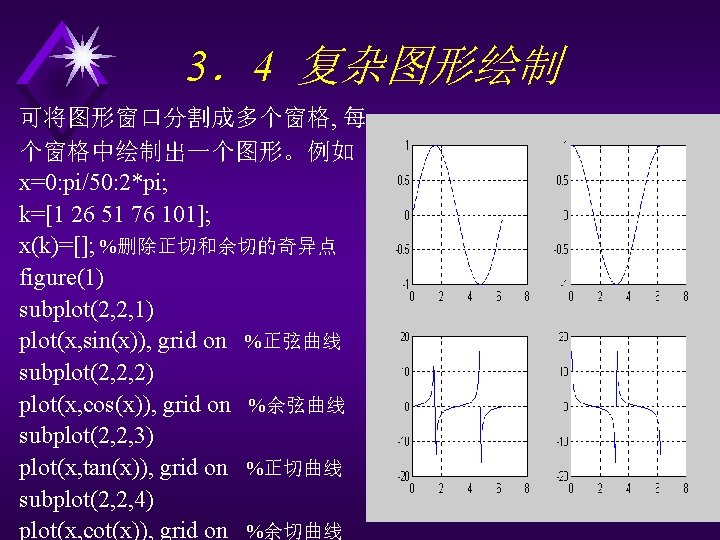
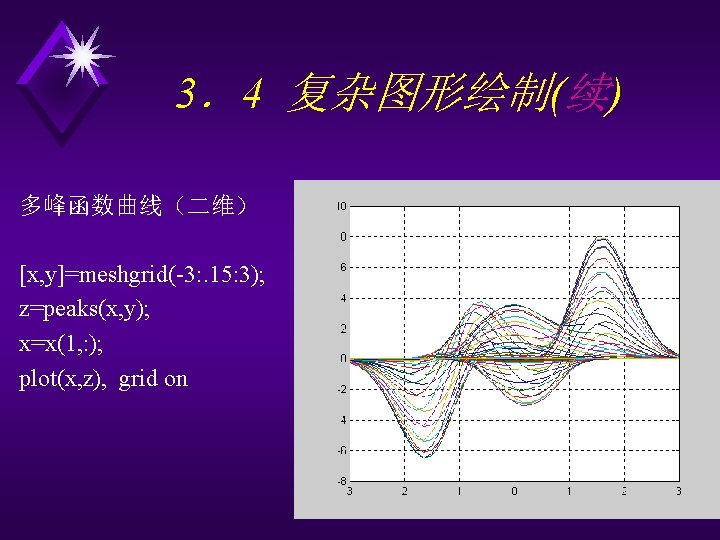
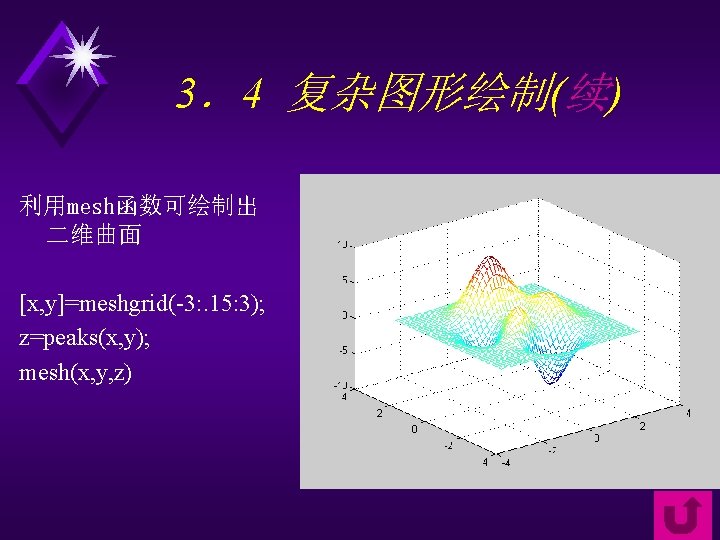
- Slides: 30