2018 Community Survey City of Washougal Washington Presented


- Slides: 37

2018 Community Survey City of Washougal, Washington Presented by June 2018

ETC Institute A National Leader in Market Research for Local Governmental Organizations …helping City and county governments gather and use survey data to enhance organizational performance for more than 35 years More than 2, 150, 000 Persons Surveyed Since 2007 for more than 900 cities in 49 States 2

Agenda • Purpose and Methodology • Bottom Line Upfront • Major Findings • 2 • Summary • Questions 3

Purpose • To objectively assess satisfaction among residents with the delivery of City services • To measure trends from previous surveys • To help determine priorities for the community • To compare the City’s performance with other communities regionally and nationally 4

Methodology • Survey Description q six-page survey; included many of the same questions that were asked in previous years q 3 rd Community Survey conducted for the City • Method of Administration q by mail and online to a random sample of City residents q each survey took approximately 15 -20 minutes to complete • Sample size: q goal number of surveys: 400 q goal far exceeded: 666 completed surveys q demographics of survey respondents accurately reflects the actual population of the City • Confidence level: 95% • Margin of error: +/- 3. 8% overall 5

Location of Survey Respondents Good representation throughout the City of Washougal 2018 Community Survey 6

Bottom Line Up Front �Residents Have a Positive Perception of the City q 60% are satisfied with the overall quality of City services; only 7% are dissatisfied �The City Is Moving in the Right Direction q Satisfaction ratings have increased or stayed the same in 36 of 54 areas since 2016, and increased or stayed the same in 31 of 54 areas since 2014 �Washougal Rates Higher Than Other Cities in the Overall Quality of City Services q The City rated 17% above the Northwest Regional Average and 11% above the U. S. Average in the overall quality of services provided by the City �Washougal Rates Higher Than Other Cities in Providing Customer Service q The City rated 21% above the Northwest Regional Average and the U. S. Average in the quality of customer service provided by City employees �Overall Priorities for Improvement: q Maintenance of City Streets q Effectiveness of Economic Development Efforts 7

Major Finding #1 Residents Have a Positive Perception of the City 8

More Than a 8 -1 Ratio of Residents Who Are Satisfied vs. Dissatisfied (60% vs. 7%) with the Overall Quality of Services Provided by the City 9

Most Services Receive High Ratings, but There Are Concerns with Maintenance of Streets 10

Overall Quality of Services Provided by the City of Washougal Legend Mean rating on a 5 -point scale 1. 0 -1. 79 Very Dissatisfied 1. 8 -2. 59 Dissatisfied 2. 6 -3. 39 Neutral 3. 4 -4. 19 Satisfied 4. 2 -5. 0 Very Satisfied No Response ETC INSTITUTE All areas are in BLUE, indicating that residents in all parts of the City are satisfied with the overall quality of City services 11

Major Finding #2 The City Is Moving in the Right Direction 12

Significant Increases From 2016: Significant Decreases From 2016: 13 13

Significant Increases From 2016: Significant Decreases From 2016: 14 14

Significant Increases From 2016: Significant Decreases From 2016: 15 15

Significant Increases From 2016: Significant Decreases From 2016: 16 16

Significant Increases From 2016: Significant Decreases From 2016: 17 17

Ongoing construction of major roads likely had a negative impact on perceptions of street maintenance Significant Increases From 2016: Significant Decreases From 2016: 18 18

Significant Increases From 2016: Significant Decreases From 2016: 19 19

Significant Increases From 2016: Significant Decreases From 2016: 20 20

Major Finding #3 How Washougal Compares to Other Communities 21

Significantly Higher: Significantly Lower: 22 22

Significantly Higher: Significantly Lower: 23 23

Major Finding #4 Priorities for Improvement 24

Overall Priorities: 25 25

26

Other Findings 27

61% Support the New Firework Restrictions or Support Even Further Restrictions 28

Over 60% Feel Retail Development Is Too Slow; For All Other Areas “Just Right” Is the Top Response 29

Over 75% Would Like to See Higher Levels of Service for Maintenance of Infrastructure Over 50% Would Like to See Higher Levels of Service for Rec Facilities & Parks/Open Space 30

31

57% Never Used the Dog Park Prior to its Closing 32

47% Would Never Use a New Dog Park 33

34

Summary 35

Summary �Residents Have a Positive Perception of the City q 60% are satisfied with the overall quality of City services; only 7% are dissatisfied �The City Is Moving in the Right Direction q Satisfaction ratings have increased or stayed the same in 36 of 54 areas since 2016, and increased or stayed the same in 31 of 54 areas since 2014 �Washougal Rates Higher Than Other Cities in the Overall Quality of City Services q The City rated 17% above the Northwest Regional Average and 11% above the U. S. Average in the overall quality of services provided by the City �Washougal Rates Higher Than Other Cities in Providing Customer Service q The City rated 21% above the Northwest Regional Average and the U. S. Average in the quality of customer service provided by City employees �Overall Priorities for Improvement: q Maintenance of City Streets q Effectiveness of Economic Development Efforts 36

Questions? THANK YOU!! 37
 Dada la siguiente secuencia rusia 2018 rusia 2018
 Tanzania national nutrition survey 2019
 Tanzania national nutrition survey 2020
 Gallup employee engagement survey 2015
 Shrm job satisfaction survey 2018
 Acls abcde secondary survey
 Washington state board for community and technical colleges
 Community right to know survey nj
 Community life survey
 Griffon ford model
 Cbd inner city suburbs
 Primate cities
 Harbor city community college
 City of temecula recreation
 Nyc youth and community development
 City of flagstaff community development
 Crossline headline
 Name of presentation
 Strange case of dr jekyll and mr hyde setting
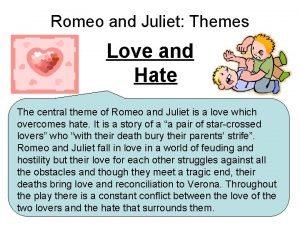
 Romeo and juliet hate theme
 Both passages have a(n) tone
 Name of the presenter
 How is power presented in ozymandias
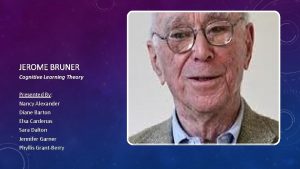
 Bruner theory of cognitive development
 Hyde as an outsider
 Talisman presented
 Main idea and supporting details definition
 How is the power of nature presented in the prelude
 Technological design model
 Bob cratchit quotes
 How is the text presented
 It looks like two parabolas back to back
 Ozymandias imagery
 Prism is presented with
 Cause and effect text example
 An introduction to technical drawing
 How are the events in the text presented
 Proudly presented by


