www pwc com Megatrends and the art of


- Slides: 12
www. pwc. com Megatrends and the art of the possible Automotive News World Congress January 13, 2015 Rick Hanna @Rick_Hanna
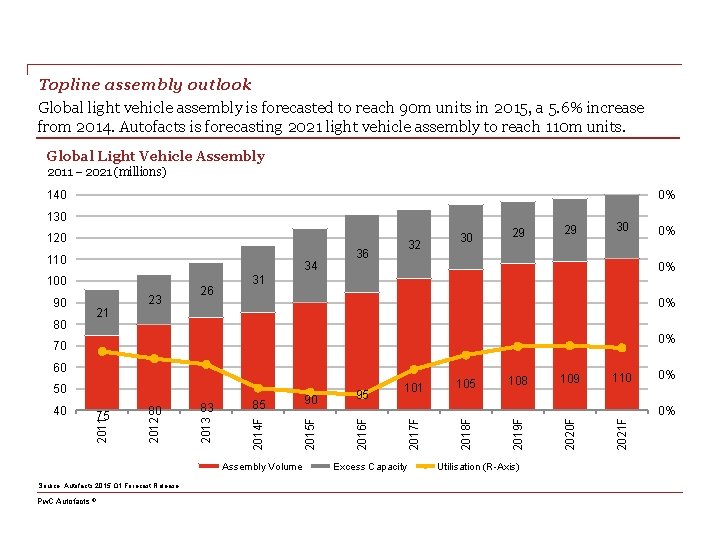
Topline assembly outlook Global light vehicle assembly is forecasted to reach 90 m units in 2015, a 5. 6% increase from 2014. Autofacts is forecasting 2021 light vehicle assembly to reach 110 m units. Global Light Vehicle Assembly 2011 – 2021 (millions) 140 0% 130 120 110 34 100 90 80 21 23 26 32 36 30 29 29 30 0% 31 0% 0% 70 Assembly Volume Source: Autofacts 2015 Q 1 Forecast Release Pw. C Autofacts ® Excess Capacity Utilisation (R-Axis) 109 110 2021 F 108 2020 F 2018 F 101 2017 F 95 2016 F 85 2015 F 83 2013 80 2012 2011 75 90 2014 F 50 105 2019 F 60 40 0% 0% 0%
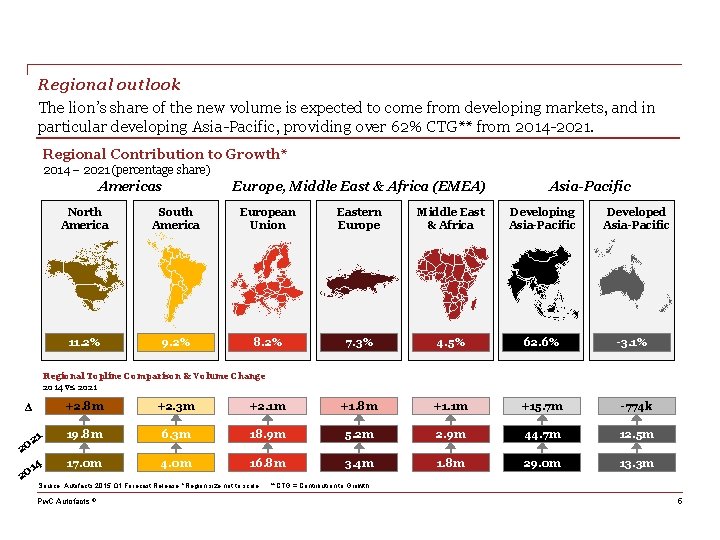
Regional outlook The lion’s share of the new volume is expected to come from developing markets, and in particular developing Asia-Pacific, providing over 62% CTG** from 2014 -2021. Regional Contribution to Growth* 2014 – 2021 (percentage share) Americas Europe, Middle East & Africa (EMEA) Asia-Pacific North America South America European Union Eastern Europe Middle East & Africa Developing Asia-Pacific 11. 2% 9. 2% 8. 2% 7. 3% 4. 5% 62. 6% Developed Asia-Pacific -3. 1% Regional Topline Comparison & Volume Change 2014 vs. 2021 +2. 8 m +2. 3 m +2. 1 m +1. 8 m +1. 1 m +15. 7 m -774 k 1 19. 8 m 6. 3 m 18. 9 m 5. 2 m 2. 9 m 44. 7 m 12. 5 m 4 17. 0 m 4. 0 m 16. 8 m 3. 4 m 1. 8 m 29. 0 m 13. 3 m ∆ 2 20 1 20 Source: Autofacts 2015 Q 1 Forecast Release *Region size not to scale Pw. C Autofacts ® **CTG = Contribution to Growth 5
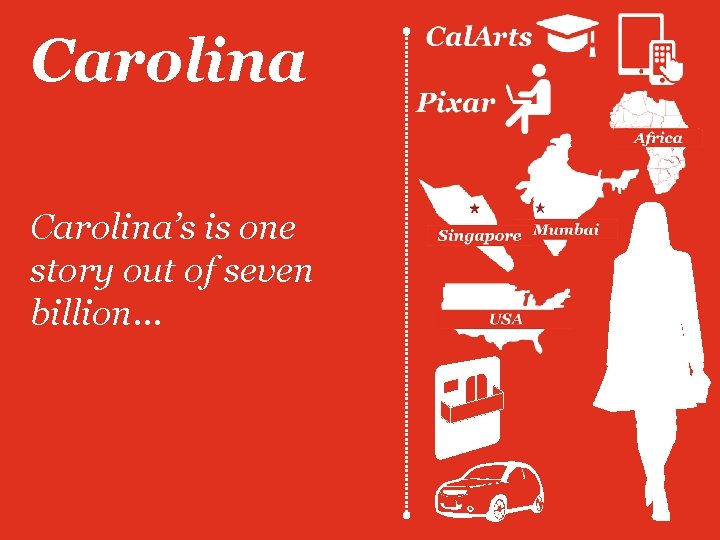
Carolina’s is one story out of seven billion…
Megatrends
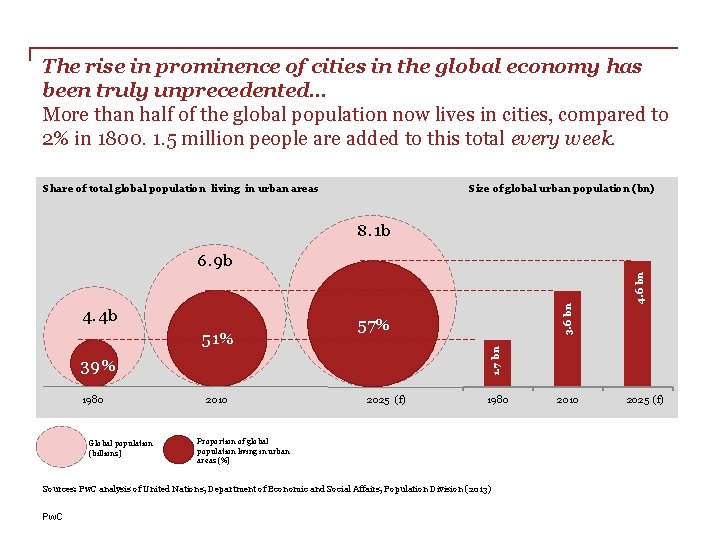
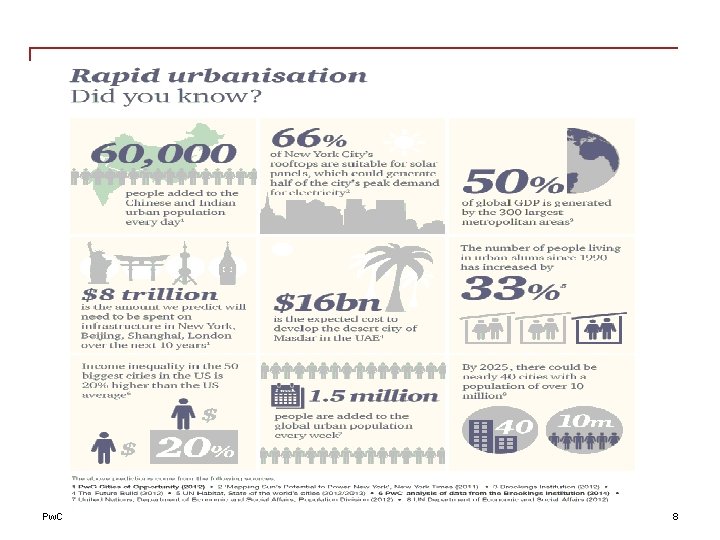
The rise in prominence of cities in the global economy has been truly unprecedented… More than half of the global population now lives in cities, compared to 2% in 1800. 1. 5 million people are added to this total every week. Share of total global population living in urban areas Size of global urban population (bn) 8. 1 b 51% 57% 39% 1980 Global population (billions) 2010 2025 (f) 1980 Proportion of global population living in urban areas (%) Sources: Pw. C analysis of United Nations, Department of Economic and Social Affairs, Population Division (2013) Pw. C 4. 6 bn 1. 7 bn 4. 4 b 3. 6 bn 6. 9 b 2010 2025 (f)
Pw. C 8
So what does this all mean? ?
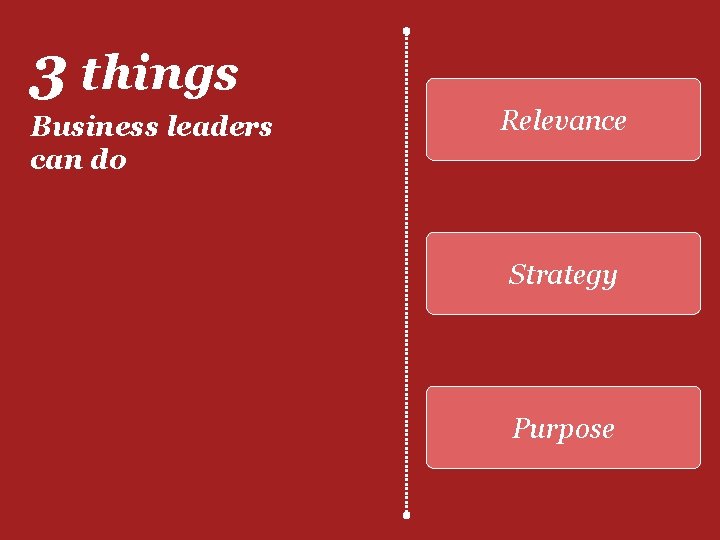
3 things Business leaders can do Relevance Strategy Purpose
© 2014 Pricewaterhouse. Coopers LLP, a Delaware limited liability partnership. All rights reserved. Pw. C refers to the US member firm, and may sometimes refer to the Pw. C network. Each member firm is a separate legal entity. Please see www. pwc. com/structure for further details. This content is for general information purposes only, and should not be used as a substitute for consultation with professional advisors.