WHY NORD STREAM 2 Chair The Economics of

- Slides: 22
WHY NORD STREAM 2 ? Chair “The Economics of Natural Gas” Paris Dauphine University 21 st of June 2019
Nord Stream 2 A fully privately funded project 100% Shareholder Project Developer provides up to 50 % of the estimated project cost 8 bn € CAPEX 9. 5 bn € total expenditure (including financing costs) Financial Investors support the project by providing up to 50 % of the financing, up to 950 Mn € each
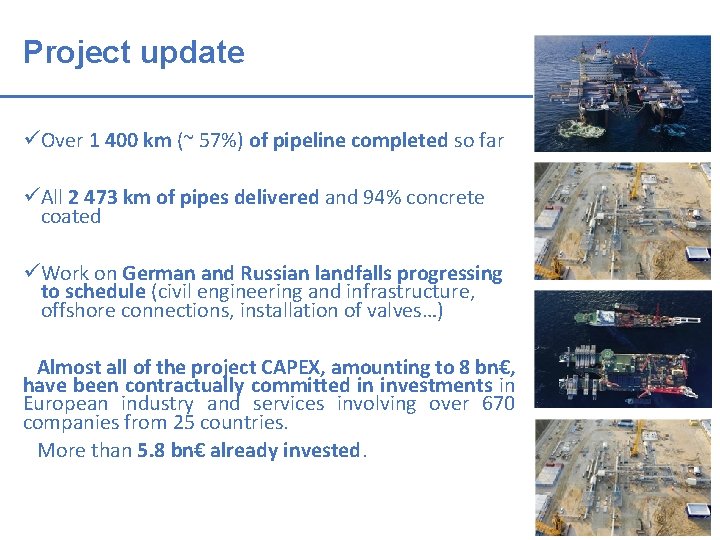
Project update üOver 1 400 km (~ 57%) of pipeline completed so far üAll 2 473 km of pipes delivered and 94% concrete coated üWork on German and Russian landfalls progressing to schedule (civil engineering and infrastructure, offshore connections, installation of valves…) Almost all of the project CAPEX, amounting to 8 bn€, have been contractually committed in investments in European industry and services involving over 670 companies from 25 countries. More than 5. 8 bn€ already invested.
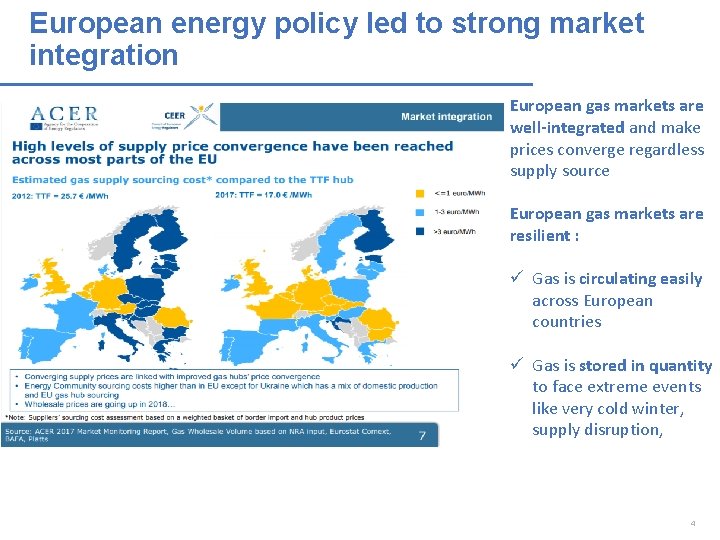
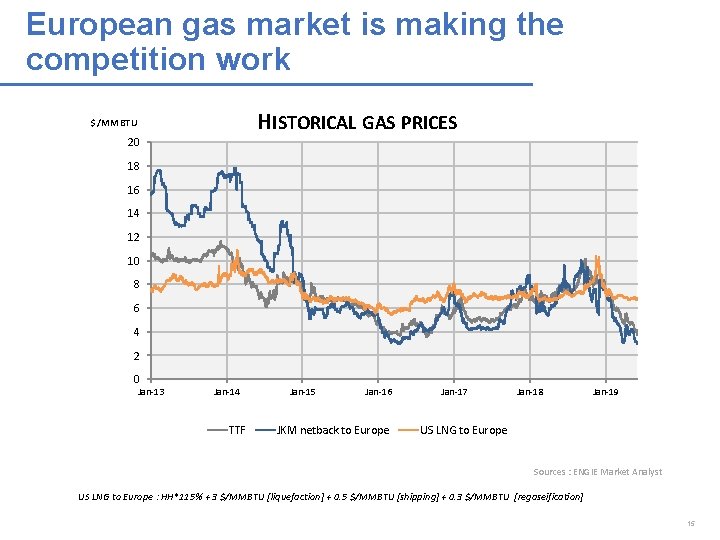
European energy policy led to strong market integration European gas markets are well-integrated and make prices converge regardless supply source European gas markets are resilient : ü Gas is circulating easily across European countries ü Gas is stored in quantity to face extreme events like very cold winter, supply disruption, 4
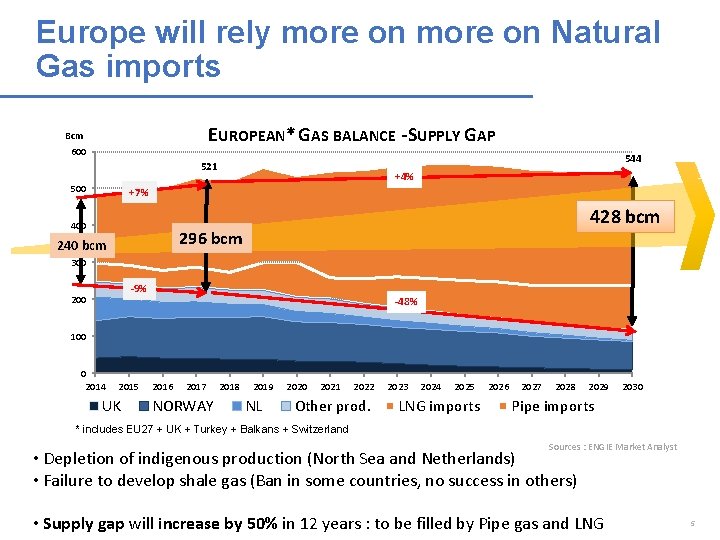
Europe will rely more on Natural Gas imports EUROPEAN* GAS BALANCE - SUPPLY GAP Bcm 600 544 521 500 +4% +7% 400 428 bcm 296 bcm 240 bcm 300 -9% 200 -48% 100 0 2014 2015 UK 2016 2017 NORWAY 2018 2019 NL 2020 2021 2022 Other prod. 2023 2024 2025 LNG imports 2026 2027 2028 2029 2030 Pipe imports * includes EU 27 + UK + Turkey + Balkans + Switzerland Sources : ENGIE Market Analyst • Depletion of indigenous production (North Sea and Netherlands) • Failure to develop shale gas (Ban in some countries, no success in others) • Supply gap will increase by 50% in 12 years : to be filled by Pipe gas and LNG 5
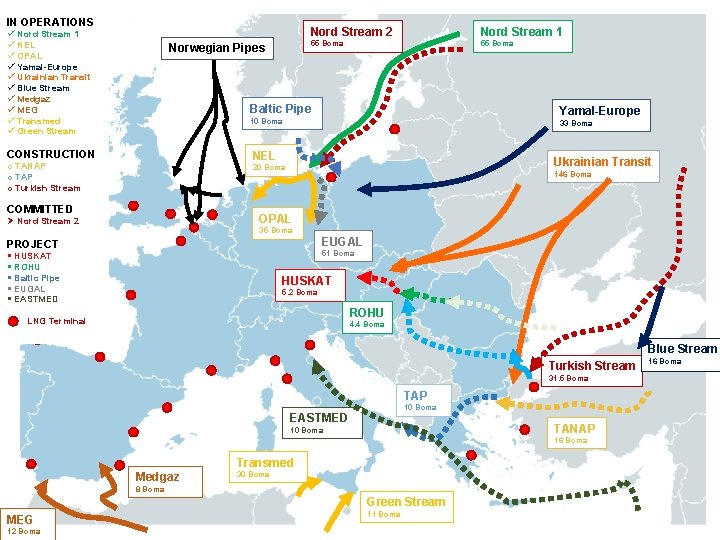
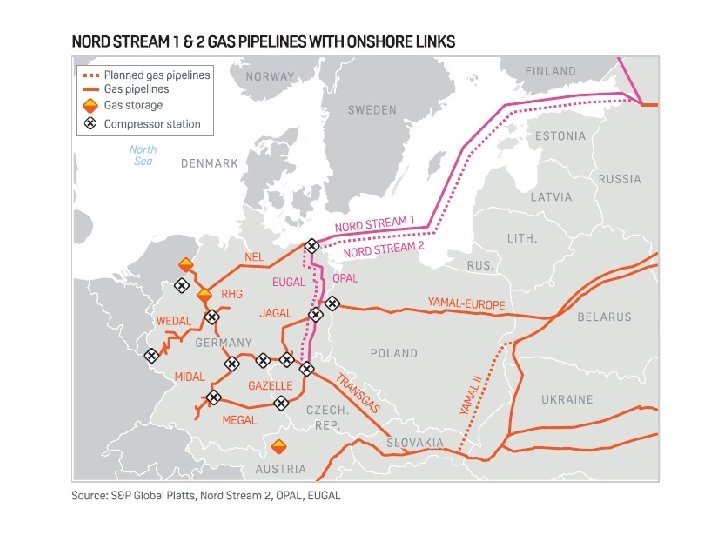
IN OPERATIONS ü Nord Stream 1 ü NEL ü OPAL ü Yamal-Europe ü Ukrainian Transit ü Blue Stream ü Medgaz ü MEG ü Transmed ü Green Stream Norwegian Pipes Nord Stream 2 Nord Stream 1 55 Bcma Baltic Pipe Yamal-Europe 10 Bcma CONSTRUCTION 33 Bcma NEL o TANAP o Turkish Stream Ukrainian Transit 20 Bcma COMMITTED 146 Bcma OPAL Ø Nord Stream 2 35 Bcma PROJECT EUGAL 51 Bcma § HUSKAT § ROHU § Baltic Pipe § EUGAL § EASTMED HUSKAT 5. 2 Bcma ROHU LNG Terminal 4. 4 Bcma Blue Stream Turkish Stream 31. 5 Bcma TAP 10 Bcma EASTMED TANAP 10 Bcma 16 Bcma Transmed Medgaz 30 Bcma 8 Bcma Green Stream MEG 12 Bcma 11 Bcma 16 Bcma
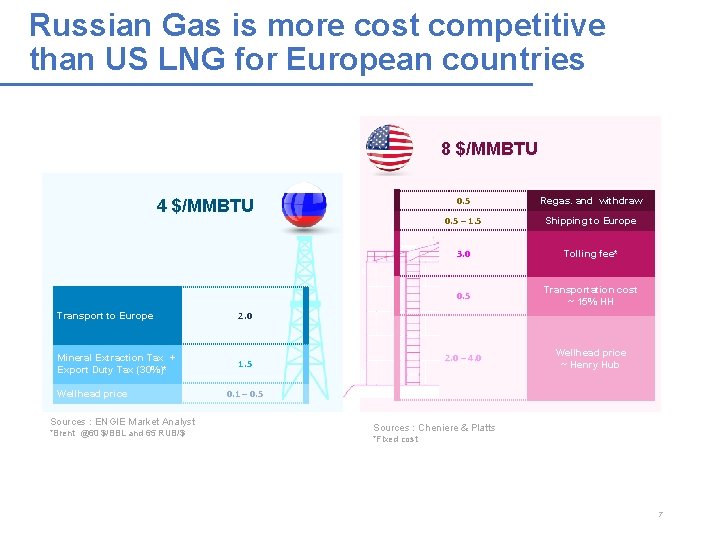
Russian Gas is more cost competitive than US LNG for European countries 8 $/MMBTU 4 $/MMBTU Transport to Europe 2. 0 Mineral Extraction Tax + Export Duty Tax (30%)* 1. 5 Wellhead price Sources : ENGIE Market Analyst *Brent @60 $/BBL and 65 RUB/$ 0. 5 Regas. and withdraw 0. 5 – 1. 5 Shipping to Europe 3. 0 Tolling fee* 0. 5 Transportation cost ~ 15% HH 2. 0 – 4. 0 Wellhead price ~ Henry Hub 0. 1 – 0. 5 Sources : Cheniere & Platts *Fixed cost 7
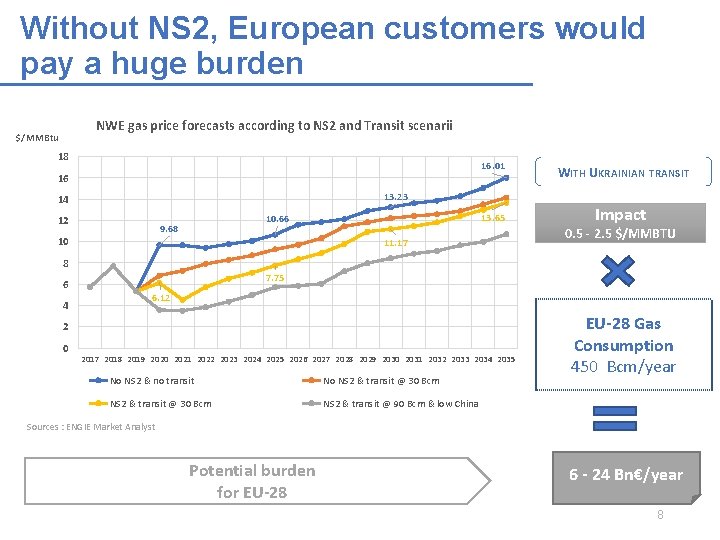
Without NS 2, European customers would pay a huge burden NWE gas price forecasts according to NS 2 and Transit scenarii $/MMBtu 18 16. 01 16 WITH UKRAINIAN TRANSIT 13. 23 14 12 10 13. 65 10. 66 9. 68 11. 17 Impact 0. 5 - 2. 5 $/MMBTU 8 7. 75 6 4 6. 12 2 0 2017 2018 2019 2020 2021 2022 2023 2024 2025 2026 2027 2028 2029 2030 2031 2032 2033 2034 2035 No NS 2 & no transit No NS 2 & transit @ 30 Bcm NS 2 & transit @ 90 Bcm & low China EU-28 Gas Consumption 450 Bcm/year Sources : ENGIE Market Analyst Potential burden for EU-28 6 - 24 Bn€/year 8
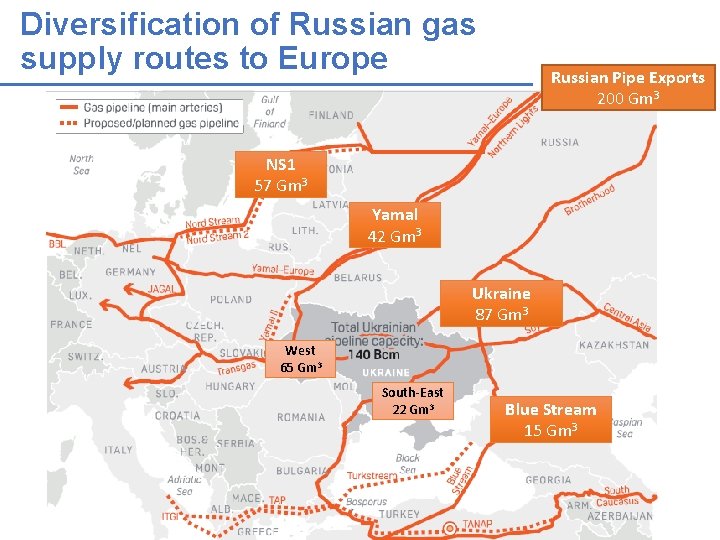
Diversification of Russian gas supply routes to Europe Russian Pipe Exports 200 Gm 3 NS 1 57 Gm 3 Yamal 42 Gm 3 Ukraine 87 Gm 3 West 65 Gm 3 South-East 22 Gm 3 Blue Stream 15 Gm 3
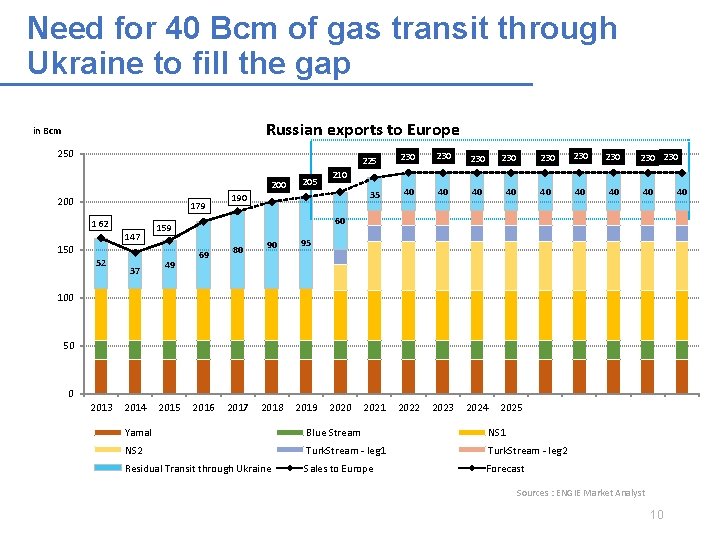
Need for 40 Bcm of gas transit through Ukraine to fill the gap Russian exports to Europe in Bcm 250 200 179 162 147 37 49 230 230 35 40 40 2021 2022 2023 2024 2025 230 210 190 40 60 159 150 52 205 225 69 80 90 95 2017 2018 2019 100 50 0 2013 2014 2015 2016 2020 Yamal Blue Stream NS 1 NS 2 Turk. Stream - leg 1 Turk. Stream - leg 2 Residual Transit through Ukraine Sales to Europe Forecast Sources : ENGIE Market Analyst 10 40
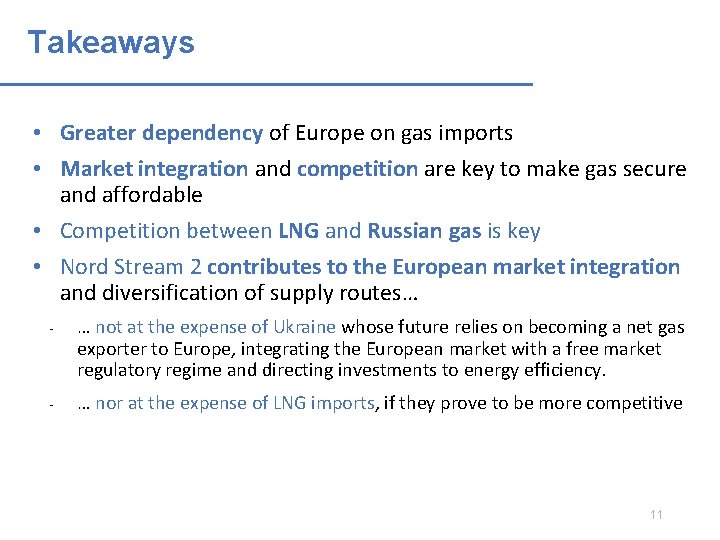
Takeaways • Greater dependency of Europe on gas imports • Market integration and competition are key to make gas secure and affordable • Competition between LNG and Russian gas is key • Nord Stream 2 contributes to the European market integration and diversification of supply routes… - … not at the expense of Ukraine whose future relies on becoming a net gas exporter to Europe, integrating the European market with a free market regulatory regime and directing investments to energy efficiency. - … nor at the expense of LNG imports, if they prove to be more competitive 11
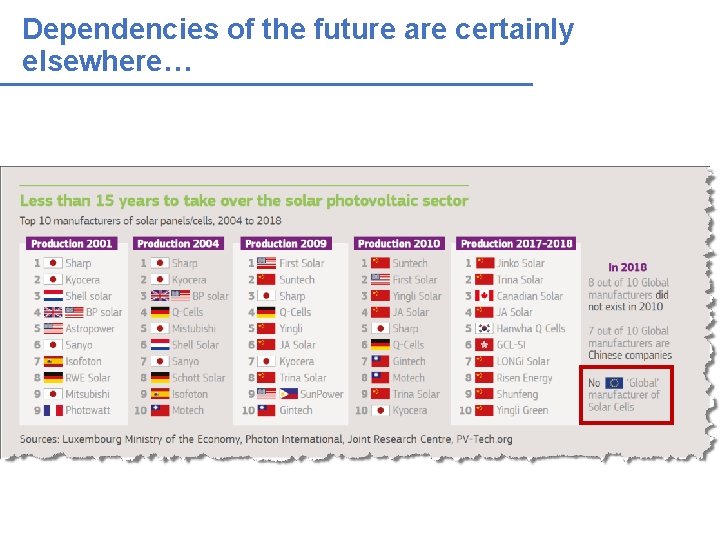
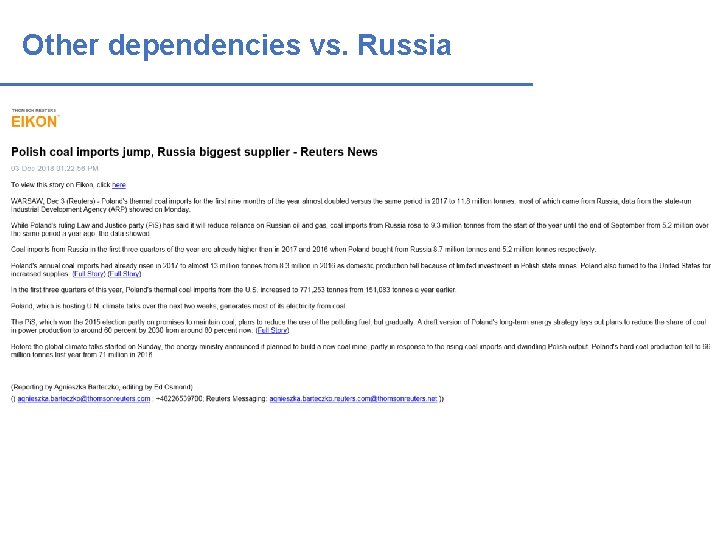
Dependencies of the future are certainly elsewhere…
Annexes
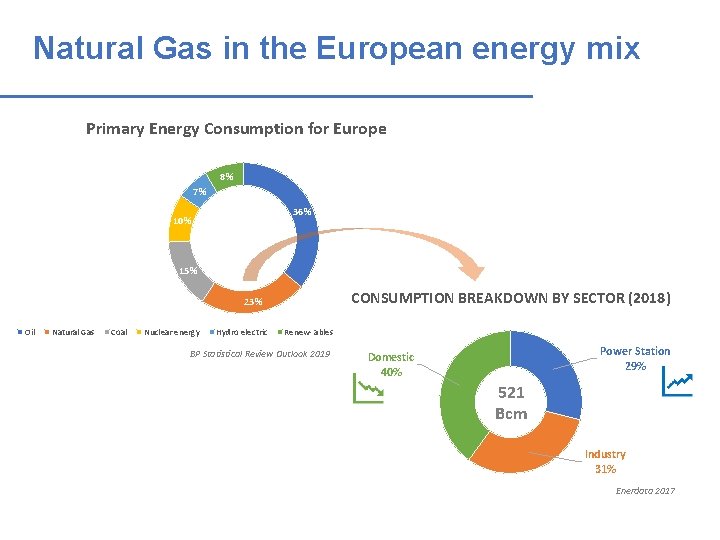
Natural Gas in the European energy mix Primary Energy Consumption for Europe 8% 7% 36% 10% 15% CONSUMPTION BREAKDOWN BY SECTOR (2018) 23% Oil Natural Gas Coal Nuclear energy Hydro electric Renew- ables BP Statistical Review Outlook 2019 Power Station 29% Domestic 40% 521 Bcm Industry 31% Enerdata 2017
European gas market is making the competition work HISTORICAL GAS PRICES $/MMBTU 20 18 16 14 12 10 8 6 4 2 0 Jan-13 Jan-14 TTF Jan-15 Jan-16 JKM netback to Europe Jan-17 Jan-18 Jan-19 US LNG to Europe Sources : ENGIE Market Analyst US LNG to Europe : HH*115% + 3 $/MMBTU [liquefaction] + 0. 5 $/MMBTU [shipping] + 0. 3 $/MMBTU [regaseification] 15
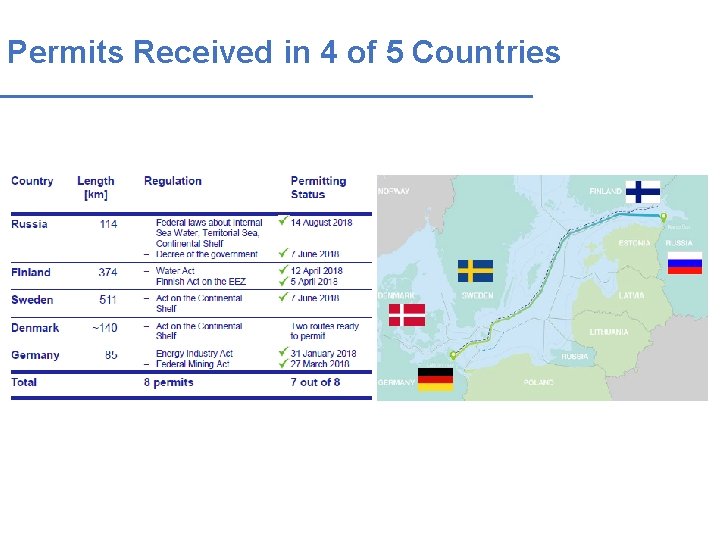
Permits Received in 4 of 5 Countries
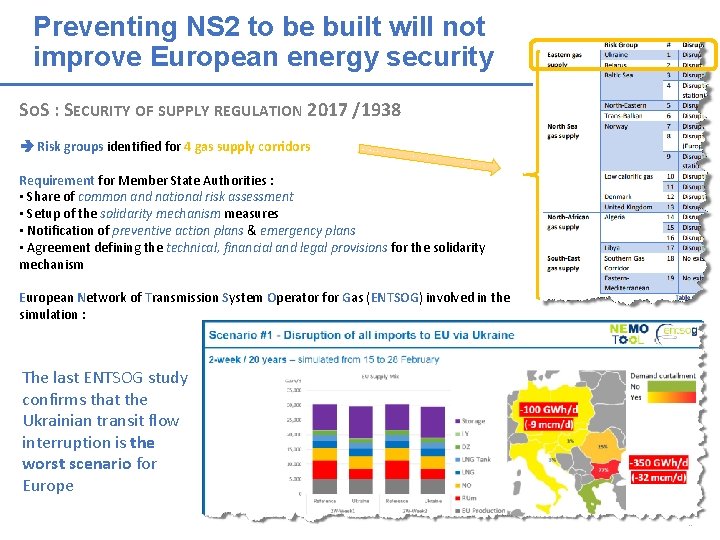
Preventing NS 2 to be built will not improve European energy security SOS : SECURITY OF SUPPLY REGULATION 2017 /1938 Risk groups identified for 4 gas supply corridors Requirement for Member State Authorities : • Share of common and national risk assessment • Setup of the solidarity mechanism measures • Notification of preventive action plans & emergency plans • Agreement defining the technical, financial and legal provisions for the solidarity mechanism European Network of Transmission System Operator for Gas (ENTSOG) involved in the simulation : The last ENTSOG study confirms that the Ukrainian transit flow interruption is the worst scenario for Europe 17
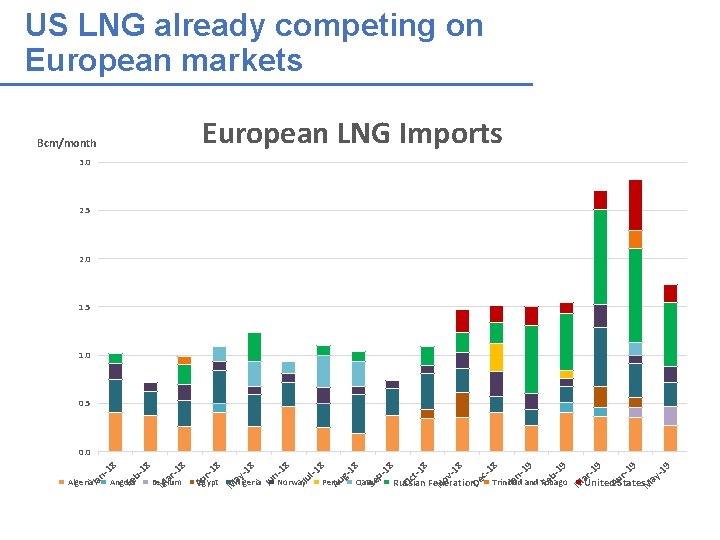
US LNG already competing on European markets European LNG Imports Bcm/month 3. 0 2. 5 2. 0 1. 5 1. 0 0. 5 ay M Ap -1 9 9 r-1 9 -1 United States M ar 19 Fe b- 19 Trinidad and Tobago Ja De n- 8 c 1 8 8 v 1 No Russian Federation Oc t Se Qatar -1 18 p- 18 Peru Au Ju Norway g- 8 l-1 18 Ju Nigeria n- ay -1 8 8 Egypt M r-1 Belgium Ap 8 -1 18 Angola M ar Ja Algeria Fe b- n- 18 0. 0
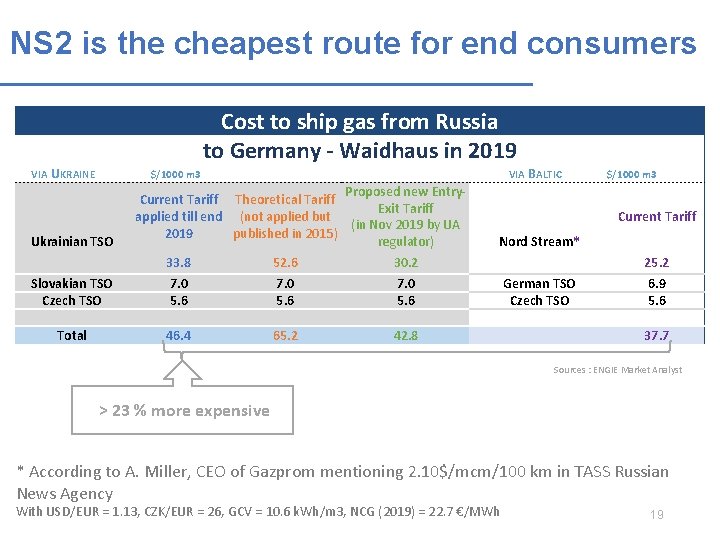
NS 2 is the cheapest route for end consumers Cost to ship gas from Russia to Germany - Waidhaus in 2019 VIA UKRAINE $/1000 m 3 Ukrainian TSO Slovakian TSO Czech TSO Total Proposed new Entry. Current Tariff Theoretical Tariff Exit Tariff applied till end (not applied but (in Nov 2019 by UA 2019 published in 2015) regulator) 33. 8 52. 6 30. 2 7. 0 5. 6 46. 4 65. 2 42. 8 VIA BALTIC $/1000 m 3 Current Tariff Nord Stream* German TSO Czech TSO 25. 2 6. 9 5. 6 37. 7 Sources : ENGIE Market Analyst > 23 % more expensive * According to A. Miller, CEO of Gazprom mentioning 2. 10$/mcm/100 km in TASS Russian News Agency With USD/EUR = 1. 13, CZK/EUR = 26, GCV = 10. 6 k. Wh/m 3, NCG (2019) = 22. 7 €/MWh 19
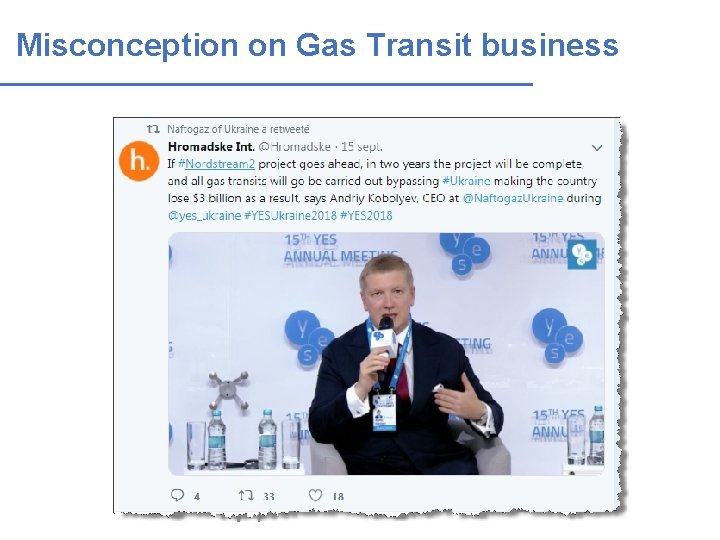
Misconception on Gas Transit business
Other dependencies vs. Russia