
Nord DRG full version based productivity reporting Jorma
Nord. DRG full version based productivity reporting Jorma Lauharanta Director of Helsinki University Hospital Area Nordic Casemix Conference 2010
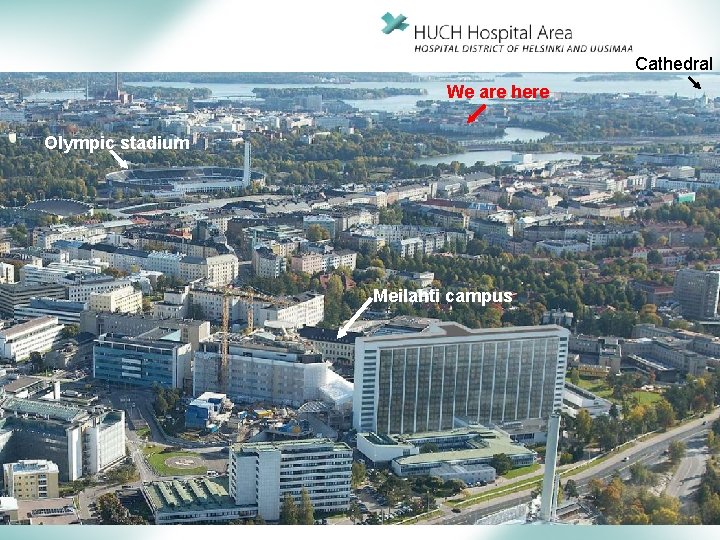
Cathedral We are here Olympic stadium Meilahti campus

The goal is health gain How to increase? Effectiveness Input Output Resources Visits Episodes etc Health gain No health gain Productivity = output/input How to minimize? Jorma Lauharanta
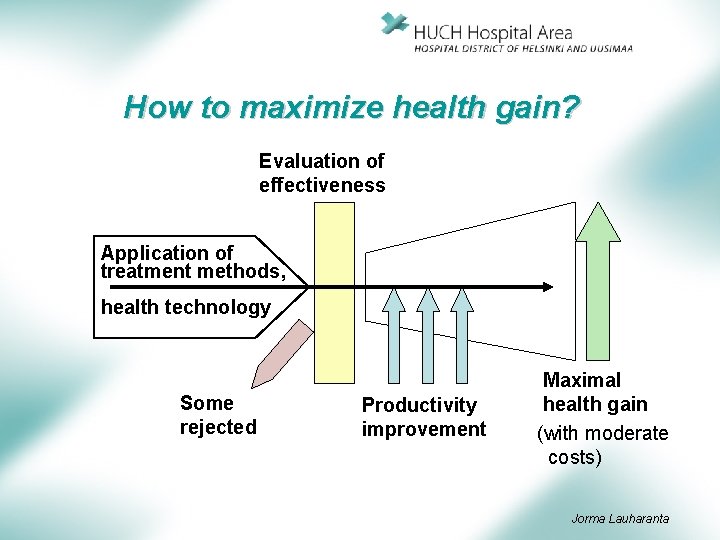
How to maximize health gain? Evaluation of effectiveness Application of treatment methods, health technology Some rejected Productivity improvement Maximal health gain (with moderate costs) Jorma Lauharanta
Requirements for productivity improvement A. Productivity measurement and monitoring system B. Productivity development programme some important items: 1. improvement of process fluency 2. increase in labour productivity 3. increased efficiency in use of capacity and use of space 4. elimination of overlap, centralisation, and economies of scale 5. new operating models etc.
Productivity support in HUCH • Long-term productivity development programme created • Clinicians/ clinical managers’ accountability increased -> new management system • Clinicians receive monthly reports of intermediate product utilization -> intermediate products per DRG group -> product level price-cost reports -> feedback about cost effects of clinical decisions • DRG-based productivity reporting
Price – cost comparisons
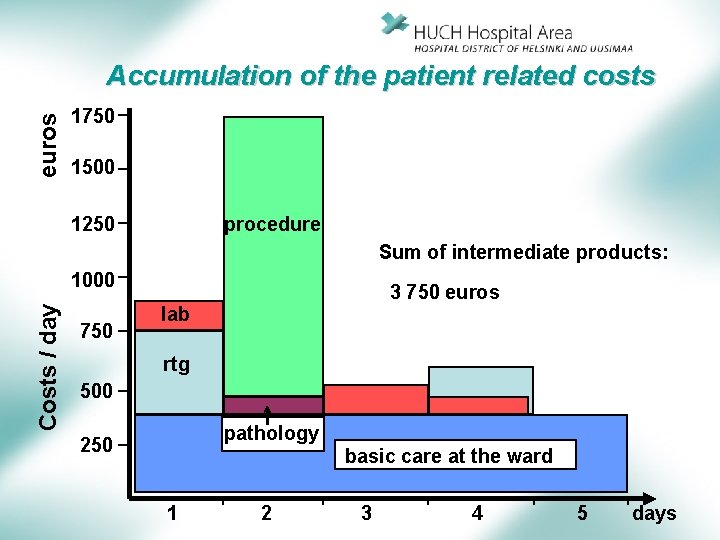
euros Accumulation of the patient related costs 1750 1500 1250 procedure Sum of intermediate products: Costs / day 1000 750 3 750 euros lab rtg 500 pathology 250 basic care at the ward 1 2 3 4 5 days
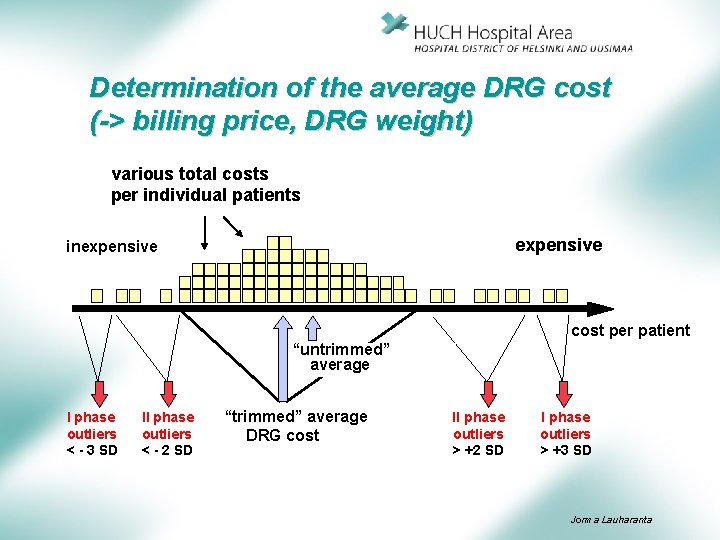
Determination of the average DRG cost (-> billing price, DRG weight) various total costs per individual patients expensive inexpensive cost per patient “untrimmed” average I phase outliers < - 3 SD II phase outliers < - 2 SD “trimmed” average DRG cost II phase outliers > +2 SD I phase outliers > +3 SD Jorma Lauharanta
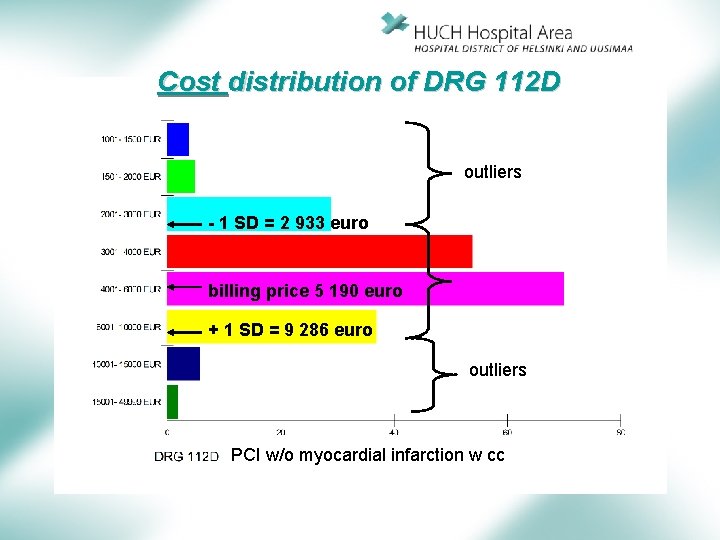
Cost distribution of DRG 112 D outliers - 1 SD = 2 933 euro billing price 5 190 euro + 1 SD = 9 286 euro outliers PCI w/o myocardial infarction w cc
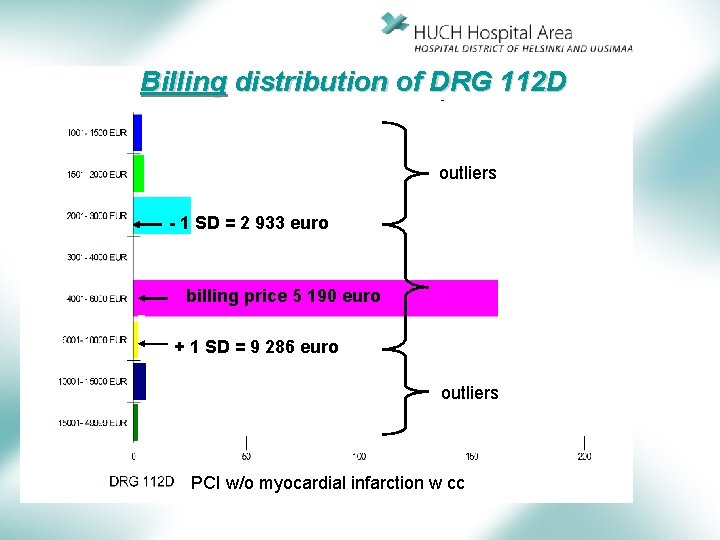
Billing distribution of DRG 112 D outliers - 1 SD = 2 933 euro billing price 5 190 euro + 1 SD = 9 286 euro outliers PCI w/o myocardial infarction w cc
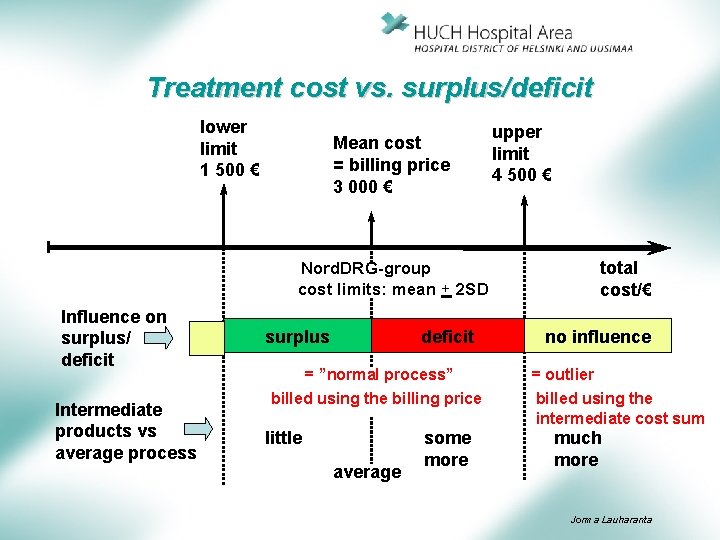
Treatment cost vs. surplus/deficit lower limit 1 500 € Mean cost = billing price 3 000 € upper limit 4 500 € total cost/€ Nord. DRG-group cost limits: mean + 2 SD Influence on surplus/ deficit Intermediate products vs average process surplus deficit = ”normal process” billed using the billing price little average some more no influence = outlier billed using the intermediate cost sum much more Jorma Lauharanta

Productivity measurement
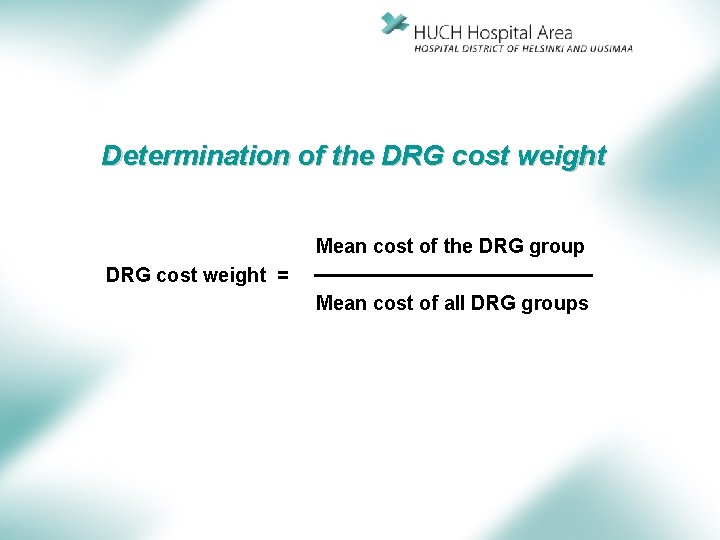
Determination of the DRG cost weight Mean cost of the DRG group DRG cost weight = Mean cost of all DRG groups
Methodology 1. Production volume DRG weight sum = “DRG points” - sum of DRG weight x number of cases for all DRG groups - same definition for outpatient and inpatient care - clinical unit employing “short therapy” instead of an inpatient/classic method receives the same cost weight as from the classic method (when number of cases in a Nord. DRG-O group is increased) 2. Productivity measures a) b) - Overall productivity DRG productivity index calculated as total costs /DRG point sum = “DRG point cost” Labour productivity DRG labour productivity index calculated as DRG point sum/FTE’s* (person-years) * FTE = Full Time Equivalent (labour input calculated as ”person years” as if all labour input was produced by full time employees) Method decribed in Finn Med J 47/2009, 4055 -4061
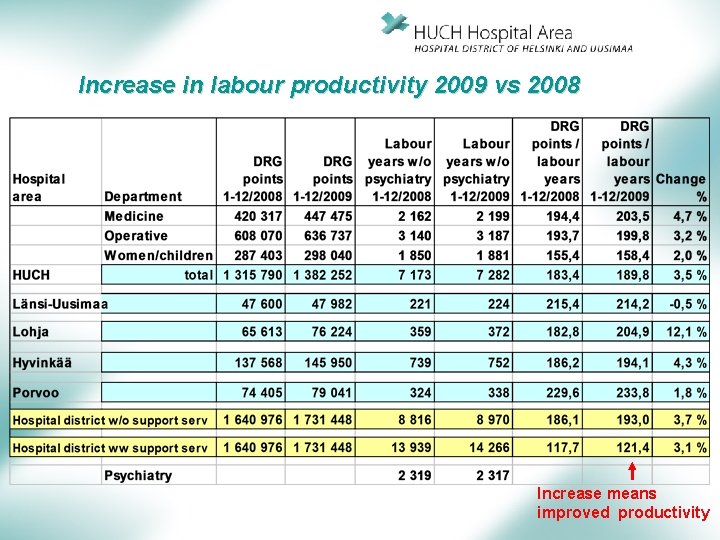
Increase in labour productivity 2009 vs 2008 Increase means improved productivity
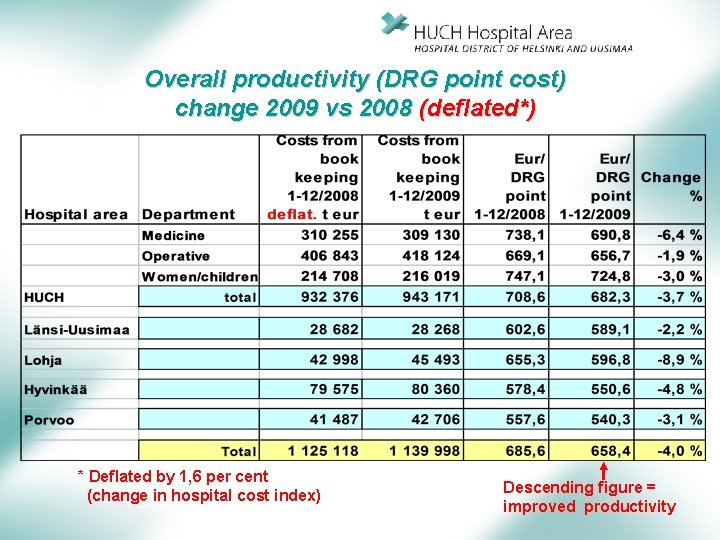
Overall productivity (DRG point cost) change 2009 vs 2008 (deflated*) * Deflated by 1, 6 per cent (change in hospital cost index) Descending figure = improved productivity
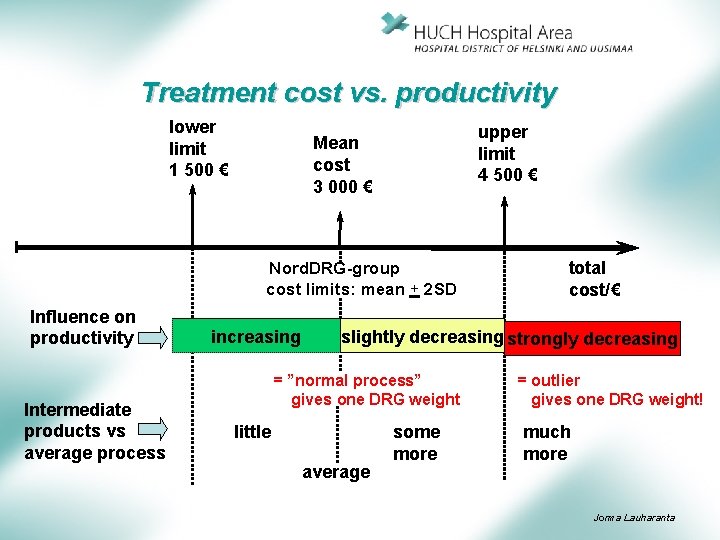
Treatment cost vs. productivity lower limit 1 500 € upper limit 4 500 € Mean cost 3 000 € Nord. DRG-group cost limits: mean + 2 SD Influence on productivity Intermediate products vs average process increasing total cost/€ slightly decreasing strongly decreasing = ”normal process” gives one DRG weight little average some more = outlier gives one DRG weight! much more Jorma Lauharanta
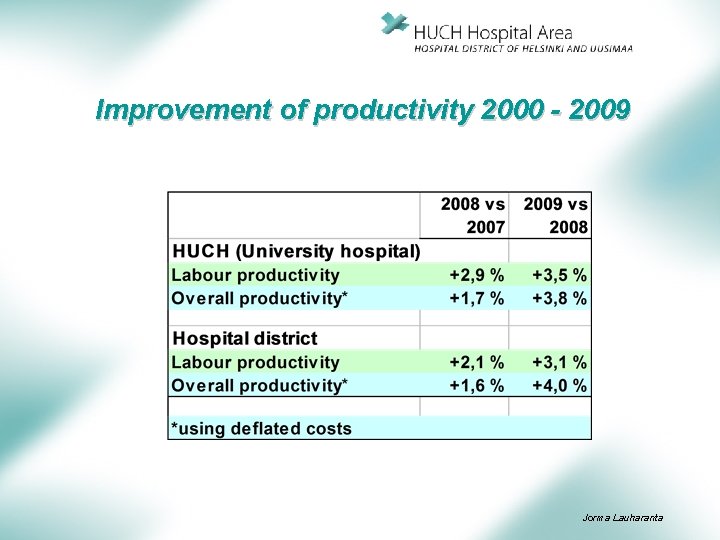
Improvement of productivity 2000 - 2009 Jorma Lauharanta
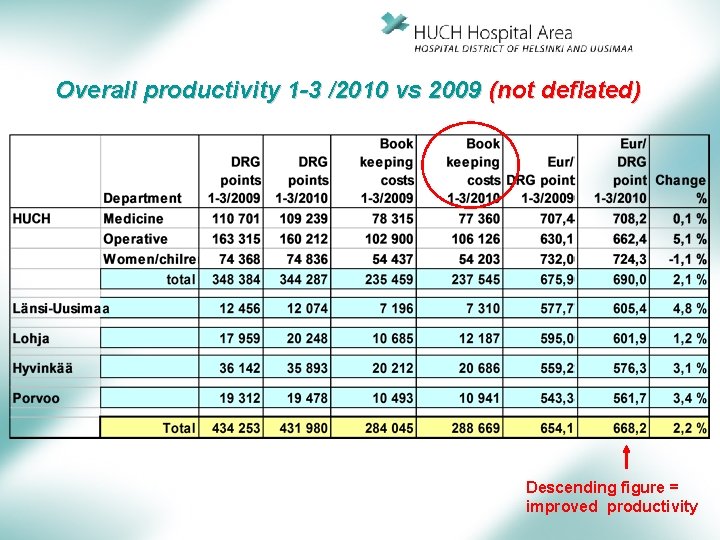
Overall productivity 1 -3 /2010 vs 2009 (not deflated) Descending figure = improved productivity
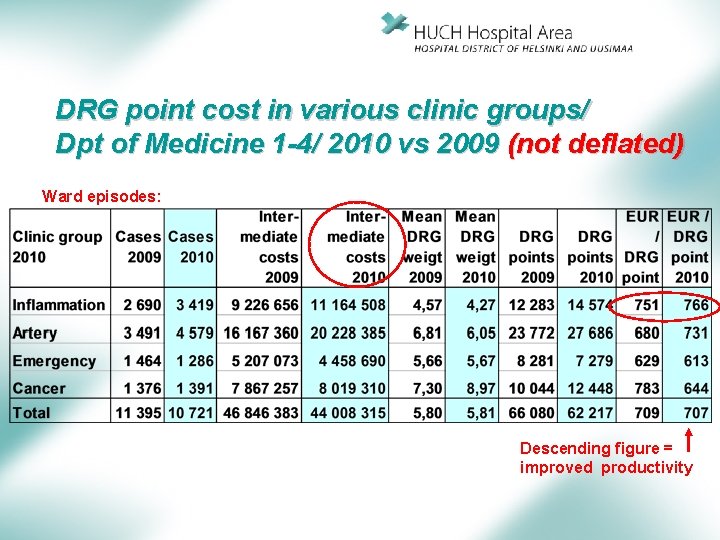
DRG point cost in various clinic groups/ Dpt of Medicine 1 -4/ 2010 vs 2009 (not deflated) Ward episodes: Descending figure = improved productivity
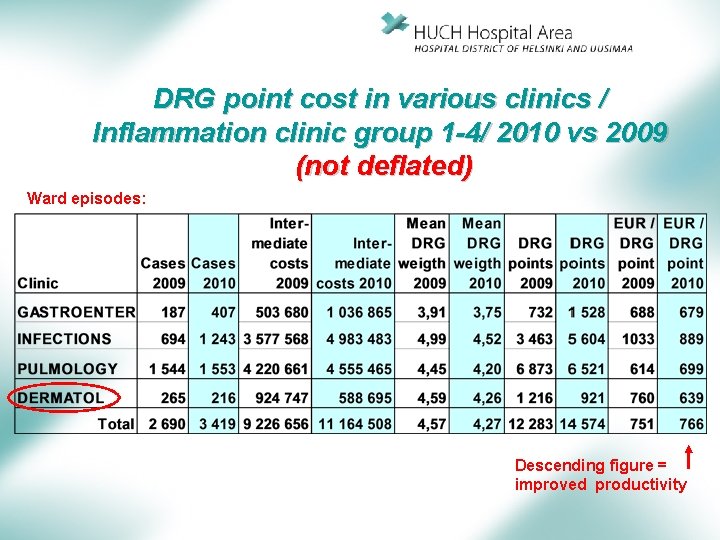
DRG point cost in various clinics / Inflammation clinic group 1 -4/ 2010 vs 2009 (not deflated) Ward episodes: Descending figure = improved productivity
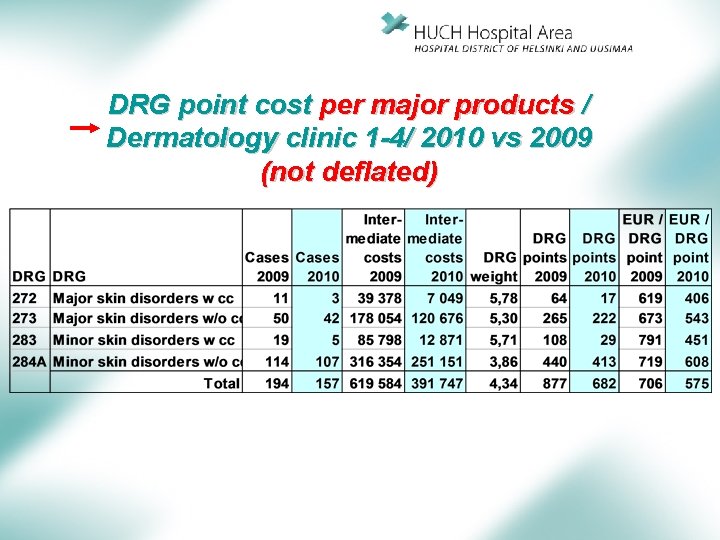
DRG point cost per major products / Dermatology clinic 1 -4/ 2010 vs 2009 (not deflated)

Conclusive remarks
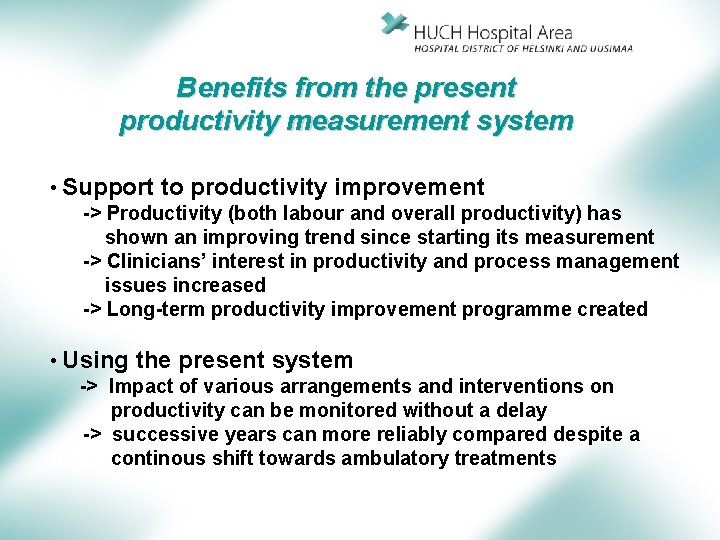
Benefits from the present productivity measurement system • Support to productivity improvement -> Productivity (both labour and overall productivity) has shown an improving trend since starting its measurement -> Clinicians’ interest in productivity and process management issues increased -> Long-term productivity improvement programme created • Using the present system -> Impact of various arrangements and interventions on productivity can be monitored without a delay -> successive years can more reliably compared despite a continous shift towards ambulatory treatments
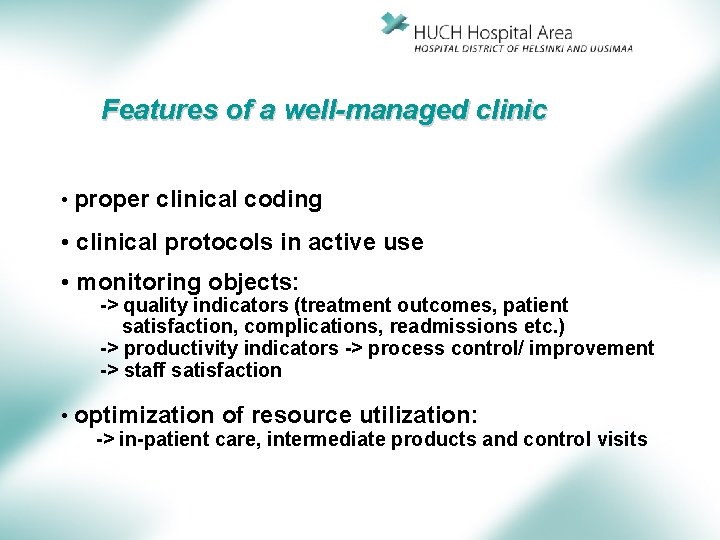
Features of a well-managed clinic • proper clinical coding • clinical protocols in active use • monitoring objects: -> quality indicators (treatment outcomes, patient satisfaction, complications, readmissions etc. ) -> productivity indicators -> process control/ improvement -> staff satisfaction • optimization of resource utilization: -> in-patient care, intermediate products and control visits
- Slides: 26