WHOUNICEF Joint Monitoring Programme for Water Supply and

- Slides: 31
WHO/UNICEF Joint Monitoring Programme for Water Supply and Sanitation (JMP) JMP Methodology and reconciling national and international monitoring of the MDG drinking water and sanitation target SADC/ECA Workshop By: Rolf Luyendijk, UNICEF Kampala, Uganda, 5 -8 May, 2008
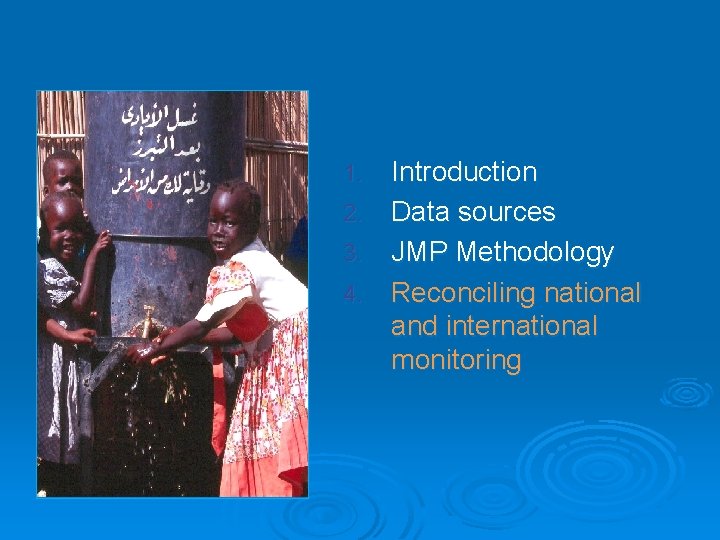
This presentation 1. 2. 3. 4. Introduction Data sources JMP Methodology Reconciling national and international monitoring
WHO-UNICEF Joint Monitoring Program (JMP) Ø Responsible for monitoring progress towards the MDG 7 Target 7 C l Global accountability and advocacy Ø Biennial updates of coverage estimates l Water supply, sanitation, urban, rural, total, household connections, by country, region and global
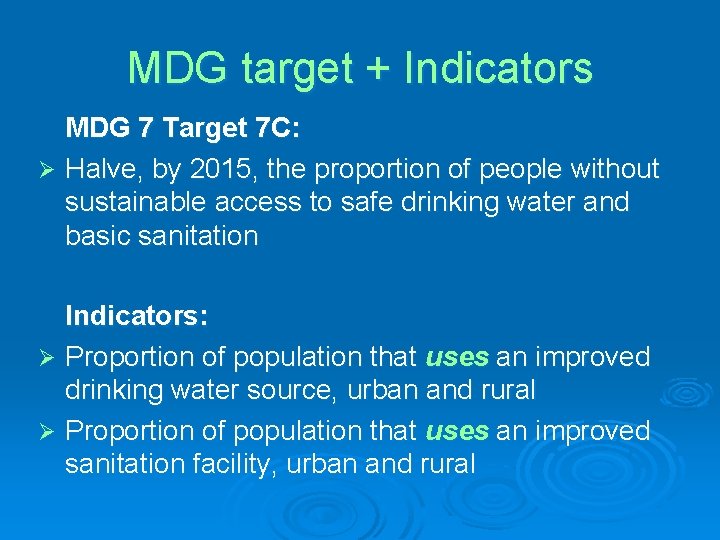
MDG target + Indicators MDG 7 Target 7 C: Ø Halve, by 2015, the proportion of people without sustainable access to safe drinking water and basic sanitation Indicators: Ø Proportion of population that uses an improved drinking water source, urban and rural Ø Proportion of population that uses an improved sanitation facility, urban and rural
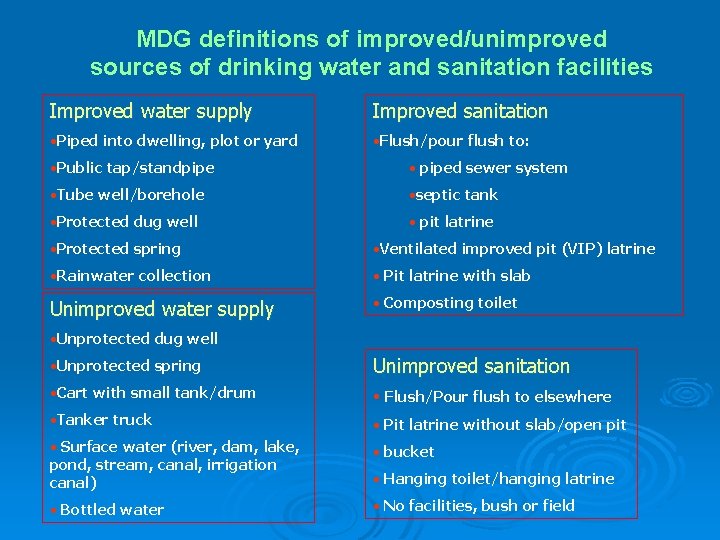
MDG definitions of improved/unimproved sources of drinking water and sanitation facilities Improved water supply Improved sanitation • Piped into dwelling, plot or yard • Flush/pour flush to: • Public tap/standpipe • piped sewer system • Tube well/borehole • septic tank • Protected dug well • pit latrine • Protected spring • Ventilated improved pit (VIP) latrine • Rainwater collection • Pit latrine with slab Unimproved water supply • Composting toilet • Unprotected dug well • Unprotected spring Unimproved sanitation • Cart with small tank/drum • Flush/Pour flush to elsewhere • Tanker truck • Pit latrine without slab/open pit • Surface water (river, dam, lake, pond, stream, canal, irrigation canal) • bucket • Bottled water • No facilities, bush or field • Hanging toilet/hanging latrine
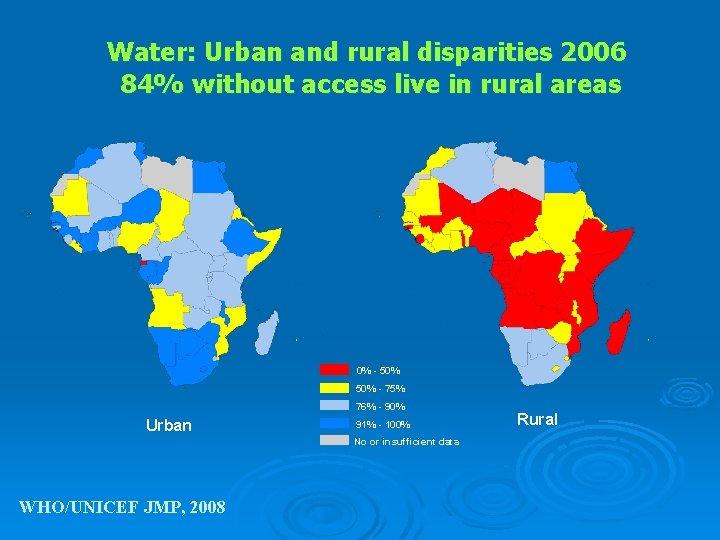
Water: Urban and rural disparities 2006 84% without access live in rural areas 0% - 50% - 75% 76% - 90% Urban 91% - 100% No or insufficient data WHO/UNICEF JMP, 2008 Rural
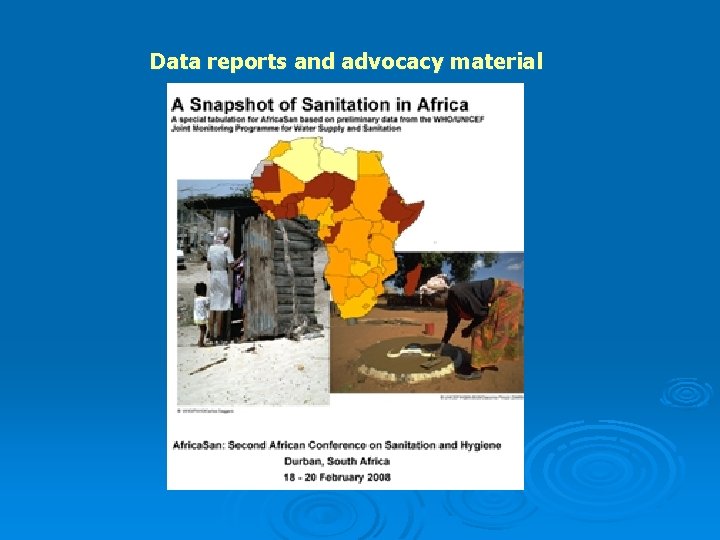
Data reports and advocacy material
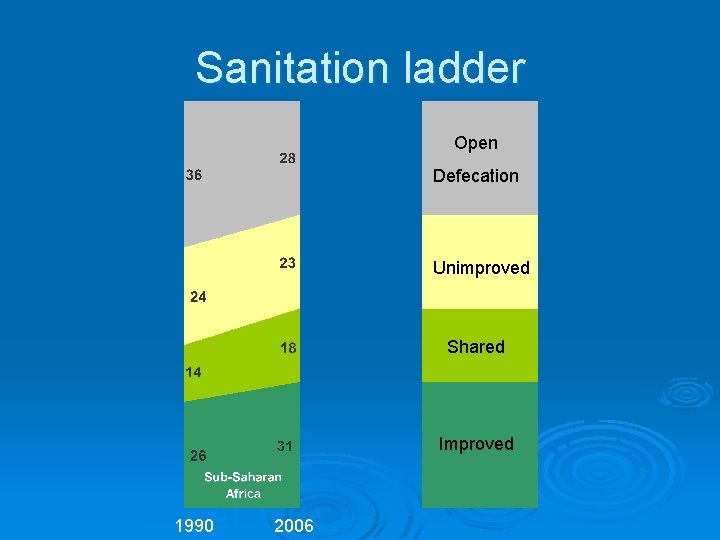
Sanitation ladder Open Defecation Unimproved Shared Improved 1990 2006
Introduction 2. Data sources 3. JMP Methodology 4. Rationale for monitoring 1.
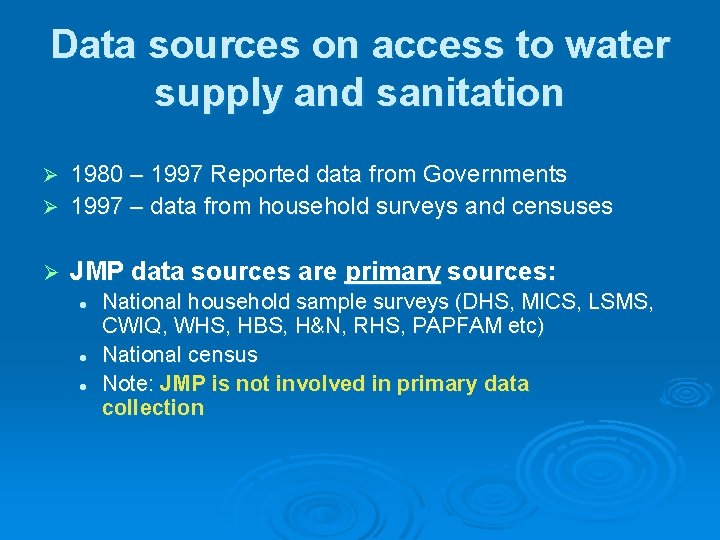
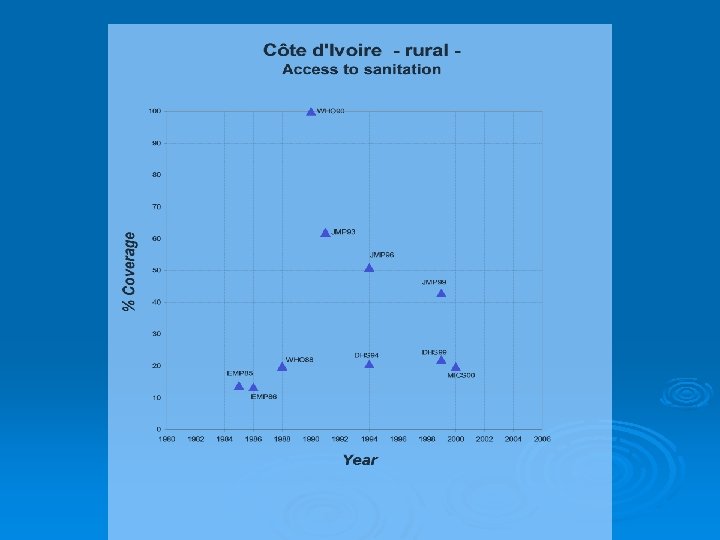
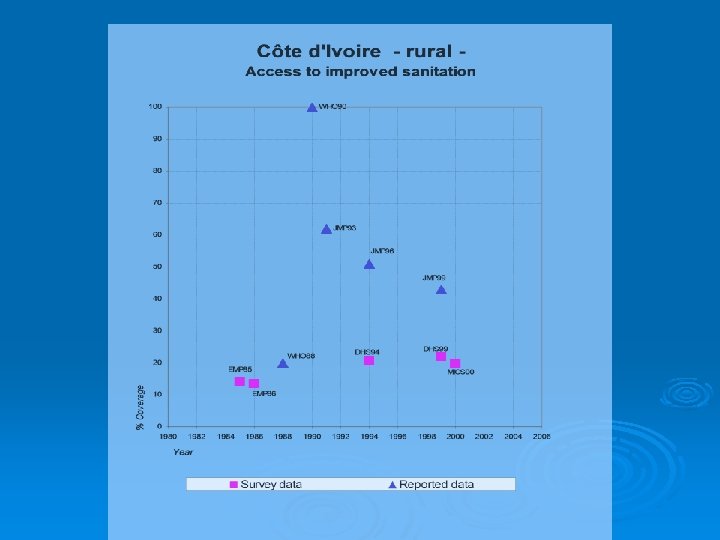
Data sources on access to water supply and sanitation 1980 – 1997 Reported data from Governments Ø 1997 – data from household surveys and censuses Ø Ø JMP data sources are primary sources: l l l National household sample surveys (DHS, MICS, LSMS, CWIQ, WHS, HBS, H&N, RHS, PAPFAM etc) National census Note: JMP is not involved in primary data collection
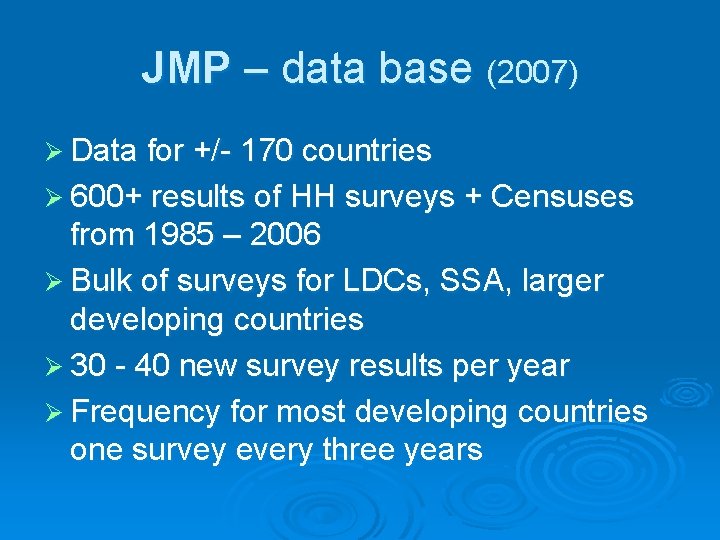
JMP – data base (2007) Ø Data for +/- 170 countries Ø 600+ results of HH surveys + Censuses from 1985 – 2006 Ø Bulk of surveys for LDCs, SSA, larger developing countries Ø 30 - 40 new survey results per year Ø Frequency for most developing countries one survey every three years
How does the JMP obtain data? UNICEF Country offices – annual submission of new survey/census data to HQ Ø MICS/DHS/WHS - through UNICEF, ORCMACRO and WHO Ø IHSN – International Household Survey Network Ø Web-searches from NSO websites Ø Direct contact with NSO’s Ø
Survey validation Ø Do we know the survey and survey authorities? Ø Is the survey nationally representative? Ø Do we have the original source documentation? Ø Reliability check against other indicators
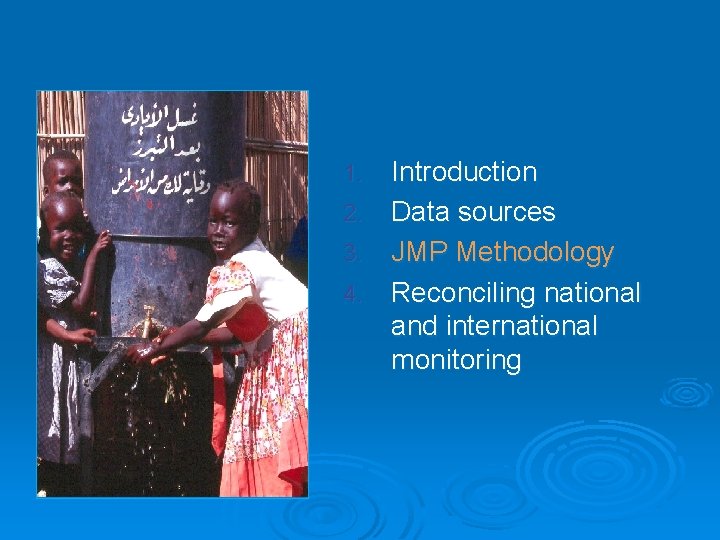
Introduction 2. Data sources 3. JMP Methodology 4. Reconciling national and international monitoring 1.
Monitoring MDG drinking water and sanitation targets A country’s responsibility q At global level: JMP q q Challenges: q q Track progress over time Track progress towards the MDG target vs. baseline year 1990 Ensure comparability over time Ensure comparability of data among countries (JMP specific challenge)
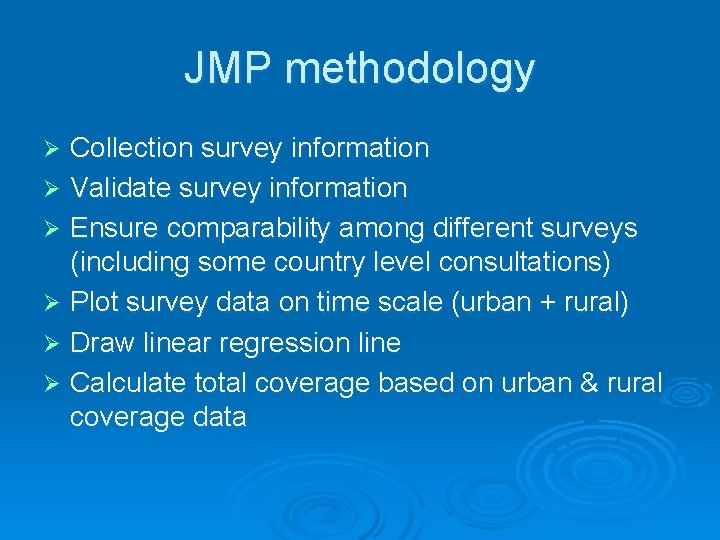
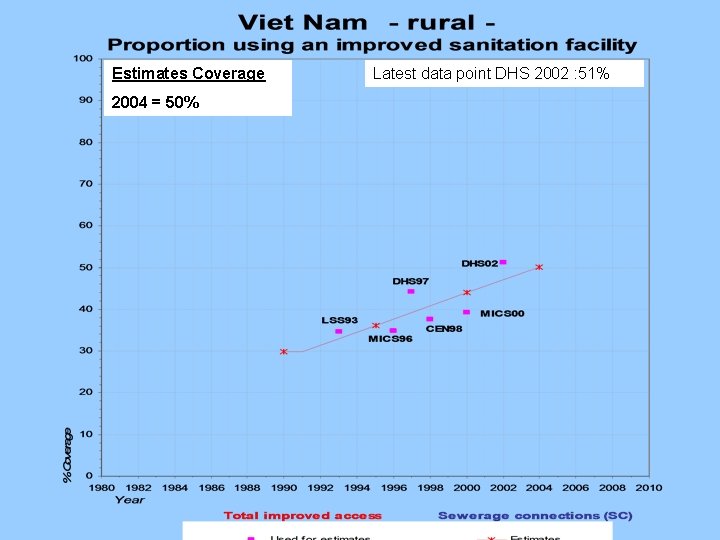
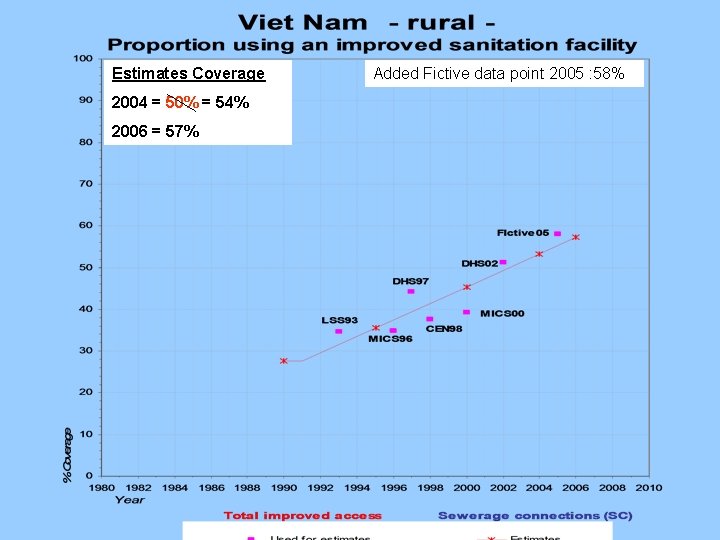
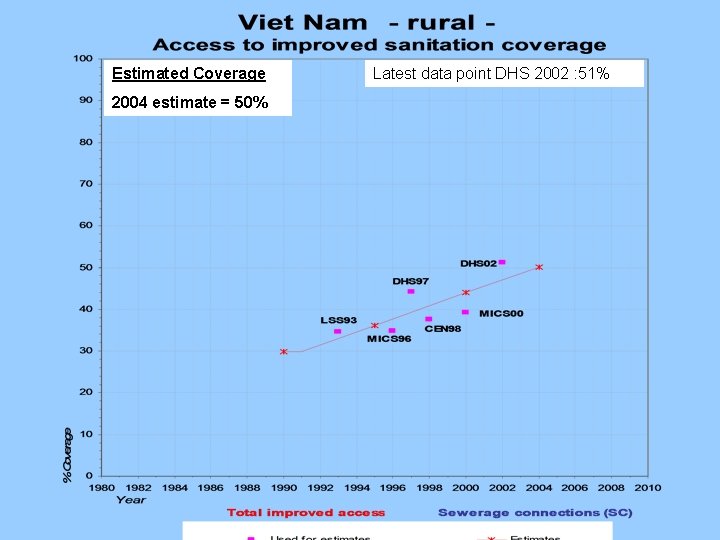
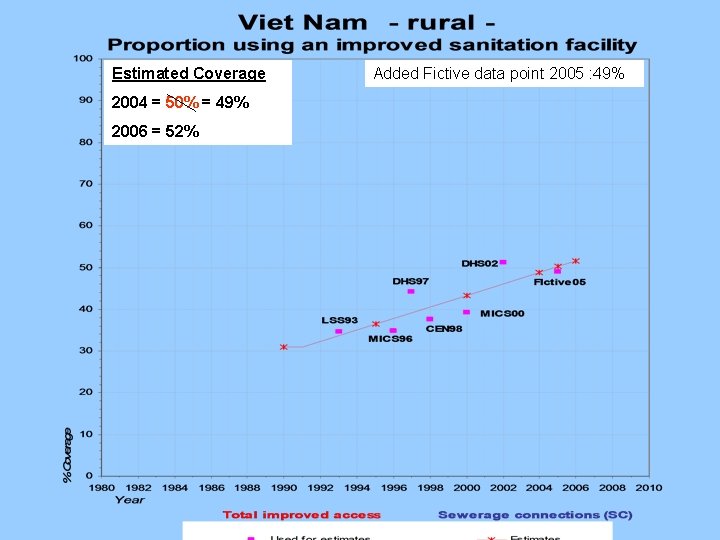
JMP methodology Collection survey information Ø Validate survey information Ø Ensure comparability among different surveys (including some country level consultations) Ø Plot survey data on time scale (urban + rural) Ø Draw linear regression line Ø Calculate total coverage based on urban & rural coverage data Ø
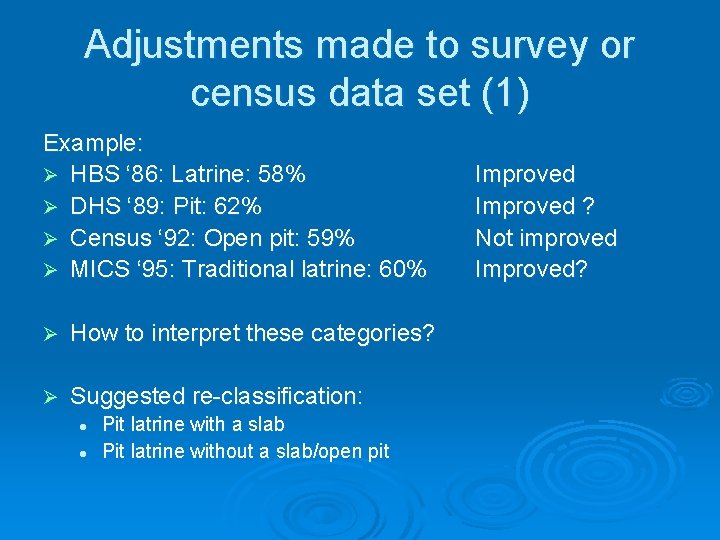
Adjustments made to survey or census data set (1) Example: Ø HBS ‘ 86: Latrine: 58% Ø DHS ‘ 89: Pit: 62% Ø Census ‘ 92: Open pit: 59% Ø MICS ‘ 95: Traditional latrine: 60% Ø How to interpret these categories? Ø Suggested re-classification: l l Pit latrine with a slab Pit latrine without a slab/open pit Improved ? Not improved Improved?
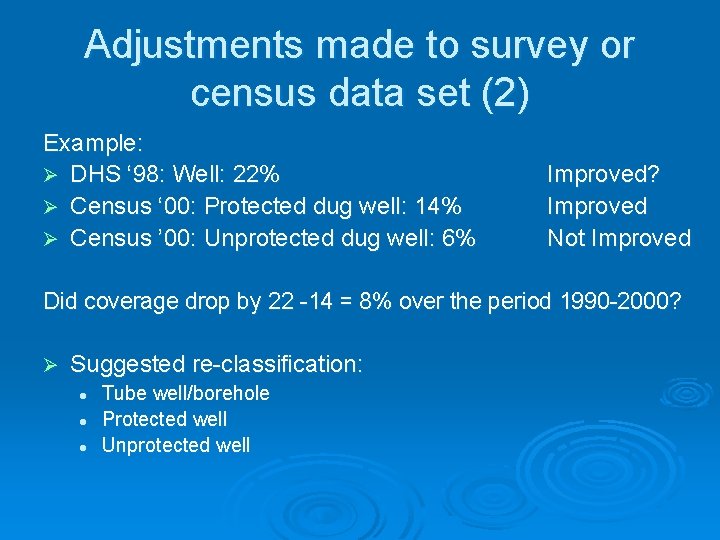
Adjustments made to survey or census data set (2) Example: Ø DHS ‘ 98: Well: 22% Ø Census ‘ 00: Protected dug well: 14% Ø Census ’ 00: Unprotected dug well: 6% Improved? Improved Not Improved Did coverage drop by 22 -14 = 8% over the period 1990 -2000? Ø Suggested re-classification: l l l Tube well/borehole Protected well Unprotected well
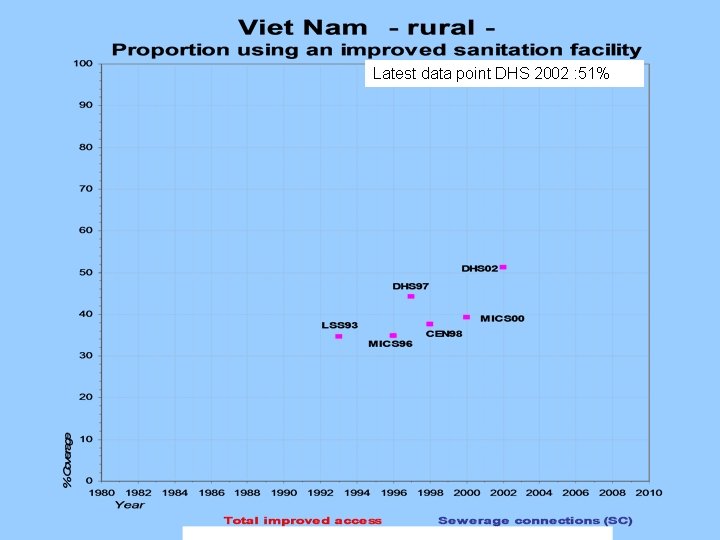
Latest data point DHS 2002 : 51%
Estimates Coverage 2004 = 50% Latest data point DHS 2002 : 51%
Estimates Coverage 2004 = 50% = 54% 2006 = 57% Added Fictive data point 2005 : 58%
Estimated Coverage 2004 estimate = 50% Latest data point DHS 2002 : 51%
2004 = 50%Coverage Estimated = 54% 2006 = 57% 2004 50% = 49% 2006 = 52% Added Fictive data point 2005 : 49% : 58%
JMP Methodology Ø Per country: l l Ø Population data from UN Population Division l l Ø Trendlines for urban and rural sanitation coverage Trendlines for urban and rural drinking water coverage Total population proportion urban population Calculate total national coverage l Note: JMP does not take total coverage data directly from surveys or census data
Introduction 2. Data sources 3. JMP Methodology 4. Reconciling national and international monitoring 1.
Data discrepancies Ø Ø Use of different definitions of access Use of different population data JMP always uses projections – countries often report on latest census or survey findings Difference in denominator population vs. households
Questions How to reconcile definitional issues between national and international monitoring? l l l Ø Ø Ø Should international definitions take into account (some) national definitions? E. g. shared facilities, traditional latrines? Should national data (and definitions) be published alongside international estimates? At what point should line ministries get involved in the discussion on definitions and what if they propose additional access criteria? How to ensure survey data compatibility for national and international monitoring? Reporting of latest survey data or use of projections? How to ensure international monitoring uses all available survey data?
JMP Methodology - Summary Ø Primarily based on user data derived from household surveys and censuses rather than data reported by governments Ø Adjustments made to full historical series to ensure comparability over time and between countries Ø Use linear regression to extrapolate and interpolate reference years instead of using the latest household survey data
JMP Website: www. wssinfo. org Ø JMP country files l l Four graphs with regressions line All HHS + census data per country Ø Regional and global coverage estimates Ø Core questions on water supply and sanitation for household surveys l l Standard indicators Definitions of service categories