Valueadded modeling VAM in education Value added refers


 in education Value added refers to \"extra\" feature(s) of an item")


 • Funding based on each")
 Running in Tennessee since 1993 and in many other")


 • At the conclusion of a value-added analysis, a number")
 • Inappropriate allocation: Teachers with seniority are given more choice")


- Slides: 23
Value-added modeling (VAM) in education Value added refers to "extra" feature(s) of an item of interest (product, service, person etc. ) that go beyond the standard expectations and provide something "more" while adding little or nothing to its cost. Value-added features give competitive edges.
Educational context Teacher’s evaluation is a difficult, sensitive, subjective and multifaceted issue. Evaluate teachers based on students’ “progress-improvement” during a certain time period (usually a school-year)
Why VAM? Measuring the annual student progress instead of a fixed grade enables the researcher to isolate other variables such as school environment, socioeconomic status and focus on teacher’s work.
VAM features • No Child Left Behind Act (NCLB) • Funding based on each school district’s “Adequate Yearly Progress” (AYP) • Many states have used empirical data to allocate funding and have also developed quantitative tools • VAM combines statistically adjusted test score gains achieved by a teacher’s students. Teachers are then compared to other teachers in the district based on these adjusted aggregate gains. • Statistically demanding procedures, need to develop understandable guides for policymakers.
Educational Value-Added Assessment System (EVAAS) Running in Tennessee since 1993 and in many other states. The basic model is an equation that expresses the score of a student at the end of a particular grade in a particular year as the sum of three components: Student score = District average + Teacher effect+ Error term So Teacher effect ≈ Student score - District average
EVAAS in the following year Student score the next year = District average + Teacher effect from previous year + Error term
EVAAS – final step If we subtract the first-year score from the second-year score, we obtain the gain made by the student. According to the model, this must be the sum of: • Average gain for that grade in the district • Teacher effect of the second-year teacher • The two error terms That is, ignoring the error terms, the teacher effect in the second year is the difference between the gain experienced by the student in that year and the average gain in the district for that same year.
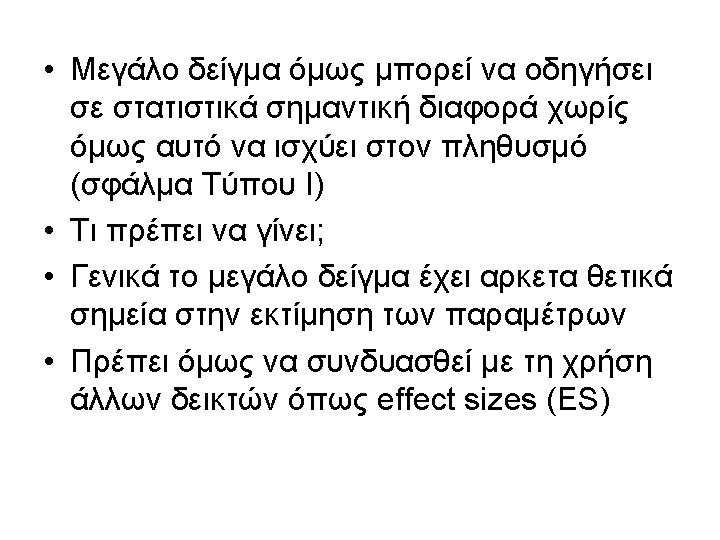
Points of concern (1) • At the conclusion of a value-added analysis, a number is associated with each teacher. This is a measure of teacher effectiveness (or teacher effect? ) • Problem with causal interpretation of the specific measure • To achieve causality, the researcher needs to apply randomization (experimental procedure)difficult in practice
Points of concern (2) • Inappropriate allocation: Teachers with seniority are given more choice in the schools and classes they teach, parental influence • Context effects: Student learning during the year is not just a function of a student’s ability and effort, and the teacher’s pedagogical skills. It is also affected by such factors as peer-to-peer interactions, overall classroom climate, resources. • Missing data • Not much data for every teacher especially in small districts, thus imprecise estimates
Using the reliability coefficient • Focus on estimating the probability that the Cronbach’s alpha exceeds a prespecified desirable level of accuracy in cluster sampling. • The researcher obtains a very precise idea about the value of the coefficient alpha while incorporating her/his own prior beliefs about the study.
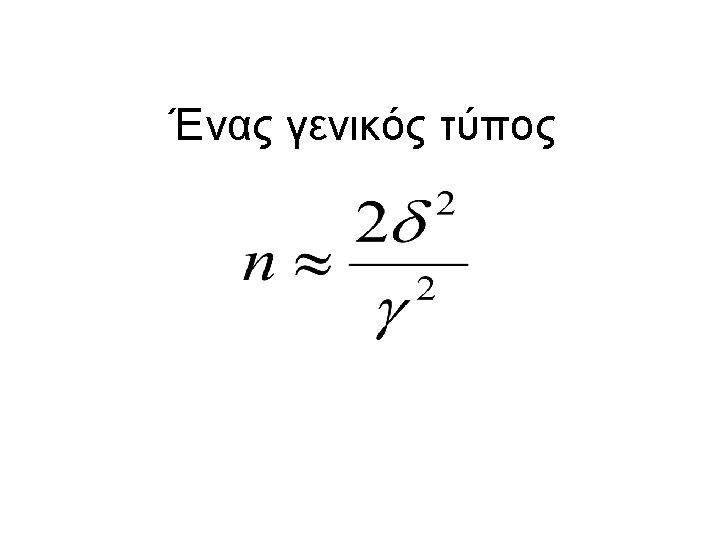
Optimal Sample Size It is a function of how strict the researcher is in estimating the probability of the alpha coefficient exceeding a threshold value and our previous knowledge about this probability.