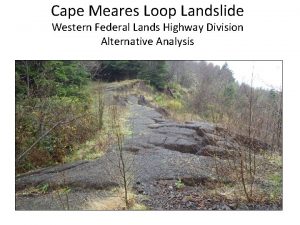
Update on Economic Analysis for Cape Hatteras National


- Slides: 31

Update on Economic Analysis for Cape Hatteras National Seashore Carol Mansfield, Christine Poulos and Laurel Clayton January 3, 2008 P. O. Box 12194 · 3040 Cornwallis Road · Research Triangle Park, NC 27709 Phone: 919 -541 -8053 · Fax: 919 -541 -6683 · carolm@rti. org · www. rti. org 1

Plan for economic analysis Plan includes: 2 n Primary, secondary and ripple-effect (regional) impacts considered in the economic analysis n Specific information needed for the economic analysis model n Data available and data collection

Valuing Park Management Changes 3

Valuing Park Management Changes, con’t 4

Describing Impacts 5 n Describe baseline (i. e. , no action alternative) qualitatively and quantitatively n Describe qualitative changes, relative to baseline, due to proposed alternative n Estimate quantitative changes where possible n Monetize quantitative changes where possible n Calculate net benefits, impacts on small businesses, ripple effects (regional economic impact)

Baseline/No Action Alt. n Baseline defined as: Current management n In the park n 6 l Baseline park visitation by area, season, activity (visitor days) l Baseline conditions in park for visitors l Baseline conditions in park of natural resources, diversity and abundance, status In the region l Baseline resident population by area, season, activity l Baseline visitation to region by area, season, activity, type of trip (day trip, overnight trip, group size) l Baseline economic activity by area, season, type of business l Baseline substitute areas by activity, season

Calculating Baseline Visitor Days by Activity 7

Baseline (Current) Visitation – Visitor Days n n 8 NPS statistics l Traffic counters, ferries, airports, building counts (visitor center, lighthouse) l Multipliers to account for group size Other data l Fly over counts l Visitor counts as part of surveys in CAHA l Parcel maps, building use and occupancy data for housing/rental/hotel units, local population l Fishing permit data

Baseline Visitation Distribution of visitation estimates Probability n Minimum Maximum Visitor Days 9

Calculating Baseline Visitor Days by Activity 10

Baseline visitation by activity *Multiply person days by percent engaged in different activities Activity ORV to fish ORV for other beach visit ORV to surf/kiteboard Fish from shore, no ORV Fish from boat Surf/kiteboard Other beach visit Bird watch Other activity (will be specified) 11 Max % Mean % Min %

Baseline visitor characteristics n n 12 Characteristics l Activity l Group size l Trip length l Spending patterns Sources l Traffic counters at specific access ramps l Park visitation data l CAHA Visitor surveys (Vogelsong, SDR Consulting, NPS Visitor Survey Project 2002) l National surveys (Nat. Survey Hunting, Fishing, Wildlife Recreation, National Survey of Recreation and the Environment, NOAA survey, NMFS)

Baseline conditions n n 13 n Conditions in the park l By area/season: Crowding, facilities available, mix of activities, weather l By area/season: Natural resource diversity and abundance Region l Population of communities l Number of businesses by area, type, season u Percent of customers who visit park by area, type, season u Size (revenue, employees) Substitute areas by activity, season

ORV Management Plan n n 14 ORV management plan may change l season/time activities permitted l location activities permitted l access points for pedestrians and ORVs Primary impacts: changes in l Quantity and quality of facilities and services in the park l Quality of environment for visitors in the park l Abundance and diversity of natural resources in the park

ORV Management Plan, con’t n 15 Primary impacts, continued: l Changes in perceptions of visitor experience l Change in visitation patterns -- depends on u preferences for activities u conditions in the park u substitute sites for activities u seasonal demand for lodging

Calculating Change in Visitation for an Alternative 16

Change in Visitation Share Activity ORV to fish % range ORV to surf/kiteboard Fish from shore, no ORV Fish from boat Surf/kiteboard Other beach visit Bird watch Other activity 17 Not visit Fish from boat Other beach visit Not visit

Change in Visitation, con’t n 18 Sources l Visitor surveys (Vogelsong, SDR Consulting) l Interviews with businesses, park staff l Fishing permit data l Lodging occupancy data

Change in Consumer Surplus for Visitors 19 n Consumer surplus is a measure of enjoyment n Changes can be positive or negative n Change in consumer surplus depends on n l activity/location choice l preferences for activities l old/new conditions in the park l substitute sites for activities Recreational use and passive use values

Calculating Change in Consumer Surplus 20

Change in Consumer Surplus for Visitors 21 n Use existing studies to estimate change in consumer surplus in monetary terms n Loomis, John. 2005. Updated outdoor recreation use values on national forests and other public lands. Gen. Tech. Rep. PNW-GTR-658. Portland, OR: U. S. Department of Agriculture, Forest Service, Pacific Northwest Research Station. 26 p. n Other published studies on relevant activities

Calculating Change in Producer Surplus 22

Secondary Impacts n Change in spending patterns multiplied by change in visitation by type of visitor (trip length and activity) n Estimate change in producer surplus n 23 l Estimate revenue change for industry categories based on spending changes l Multiply by profit rates Changes can be positive or negative

Spending Categories 24 n Lodging n Food (grocery and restaurant) n Recreational equipment (fishing, boating, beach stuff, surfing) n Gas n Gifts/incidentals n Access fees

Net Benefits of Alternative Relative to Baseline 25 n Total Benefits = Change in consumer surplus + change in producer surplus n Total Costs = Change in consumer surplus + change in producer surplus n Net Benefits = Benefits – Costs n Discount rate: 3% and 7%

Ripple Effects on Regional Economy 26 n Use change in revenue for industry categories n Estimate changes in l income l employment n Use IMPLAN software n Compare impacts for zip codes of most affected areas, Dare/Hyde counties and for state of North Carolina

Availability of CS Estimates Recreational Available Fishing (shore, boat) CAHA/NC Boating CAHA/NC Swimming CAHA/NC ORV Use SE Region (in Nat’l Forest, not on beach) Surf/Kiteboarding SE Region (TX) Beach use (CS for beach access, beach quality, water quality) CAHA/NC/SE Region Birding SE Region (TX) Wildlife Watching CAHA/NC/SE Region Sightseeing NC/SE Region Spiritual/Inspirational/ 27 Not Available Aesthetic/Educational X

Planned Primary Data Collection n Data on impacts of alternatives and data for small business impact analysis n Survey of businesses in CAHA area n 28 l Lodging (hotels/motels, rental companies, home owners? ) l Recreational equipment (fishing, boating, beach stuff, surfing, etc. ) Short survey conducted by telephone, needs OMB approval unless we survey 9 or fewer businesses

Additional Data Collection Possibilities n n 29 Counts of visitors on random days (without interviews) l Data on baseline visitation (compare with other counts), snapshot of observed activity patterns l Does not need OMB approval Survey of beach house renters/users, hotel guests, county residents l Current visitation levels – number of visitors, activities, length of stay l Expenditures by category l Reported behavior if management changes l Value of beach activity day under management changes

Additional Data Collection Possibilities, con’t n Survey of visitors (intercept) l n 30 Concentrate on off seasons Surveys need OMB approval (may take up to 90 days or more)

Next Steps n 31 Review and collect additional information on: l visitation stats l surveys of visitors l literature on consumer surplus for specific activities n Draft survey of businesses n Finalize the analysis plan
 Map of north carolina lighthouses
 Shadow paging recovery technique
 Economic growth vs economic development
 Conclusion of growth and development
 Economics unit 1 lesson 2 difficult choices
 Webdhis gauteng
 What is a cape
 Henlopen soccer club
 Kniffen house types
 Cape meares loop
 Cape information technology unit 1 notes
 Cape funding list
 Cape coral charter school authority
 Ford transit cape cod
 Bitou cape
 Exhibition stands south africa
 Upper cape tech nursing program
 University of cape coast
 Joshua fiske
 Cape breton university
 Ley lines bali
 Elim - cape south coast
 Jim gordon cape wind
 Cape technologies
 Cbrm water utility
 Rovos rail 2011 schedule
 Osd cape
 Cape buffalo and cattle egrets relationship
 Cape software
 Cape flats nature reserve
 Milkor centurion
 Henlopen soccer club

