Units Content Section 1 Statistical investigation Section 2


- Slides: 35
Unit’s Content • Section 1 Statistical investigation. • Section 2 Monitoring seabird populations on Skomer. • Section 3 How well can you estimate? • Section 4 Four case studies. • Section 5 Tackling your own investigation. 2006 04 24 Kananah / Asheeri MU 120 -A Unit 4 Seabirds 1
Section 1 Statistical investigation 2006 04 24 Kananah / Asheeri MU 120 -A Unit 4 Seabirds 2
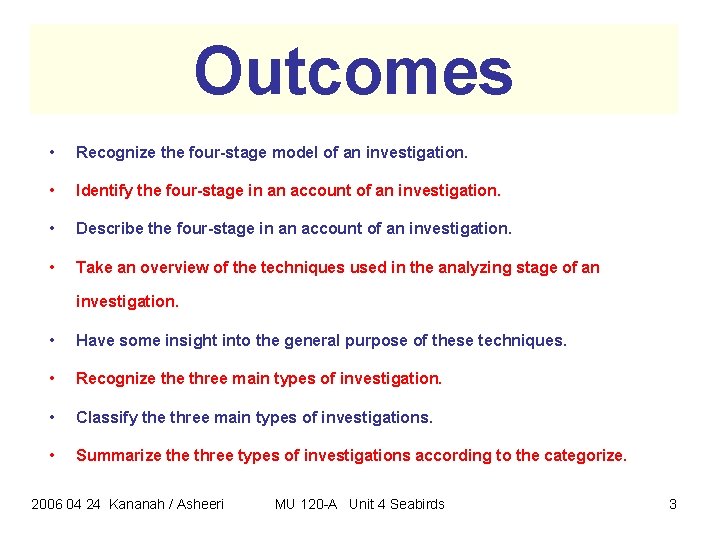
Outcomes • Recognize the four-stage model of an investigation. • Identify the four-stage in an account of an investigation. • Describe the four-stage in an account of an investigation. • Take an overview of the techniques used in the analyzing stage of an investigation. • Have some insight into the general purpose of these techniques. • Recognize three main types of investigation. • Classify the three main types of investigations. • Summarize three types of investigations according to the categorize. 2006 04 24 Kananah / Asheeri MU 120 -A Unit 4 Seabirds 3
New concepts 1 - Investigation. 2 - Statistical investigation. 3 - Primary data. 4 - Secondary data. 2006 04 24 Kananah / Asheeri MU 120 -A Unit 4 Seabirds 4
Investigation A scientific or academic examination of the facts of a subject or problem 2006 04 24 Kananah / Asheeri MU 120 -A Unit 4 Seabirds 5
Statistical investigation A statistical examination of the facts of a subject or problem 2006 04 24 Kananah / Asheeri MU 120 -A Unit 4 Seabirds 6
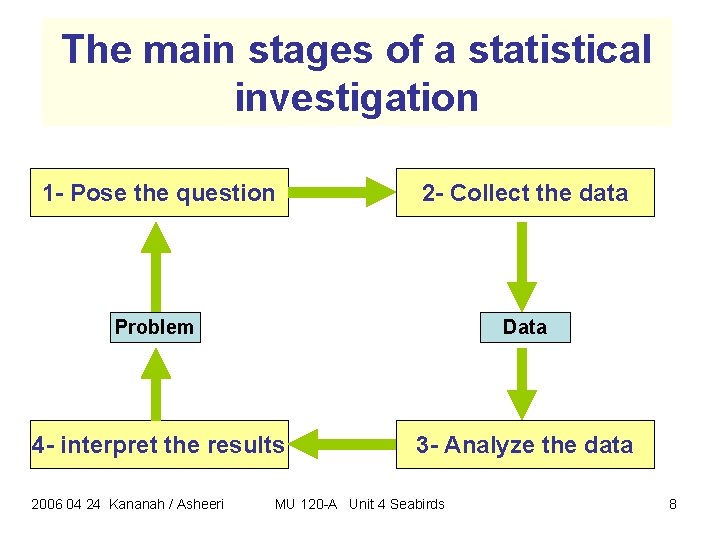
Decisions are made on judgments which in turn may involve certain key stages. 2006 04 24 Kananah / Asheeri MU 120 -A Unit 4 Seabirds 7
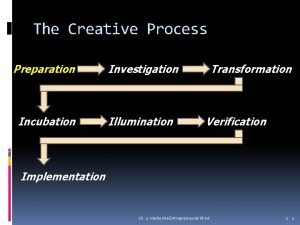
The main stages of a statistical investigation 1 - Pose the question 2 - Collect the data Problem Data 4 - interpret the results 3 - Analyze the data 2006 04 24 Kananah / Asheeri MU 120 -A Unit 4 Seabirds 8
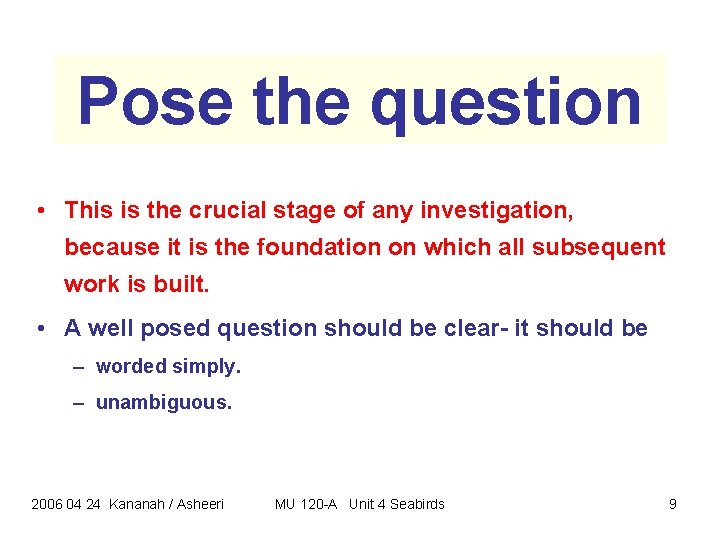
Pose the question • This is the crucial stage of any investigation, because it is the foundation on which all subsequent work is built. • A well posed question should be clear- it should be – worded simply. – unambiguous. 2006 04 24 Kananah / Asheeri MU 120 -A Unit 4 Seabirds 9
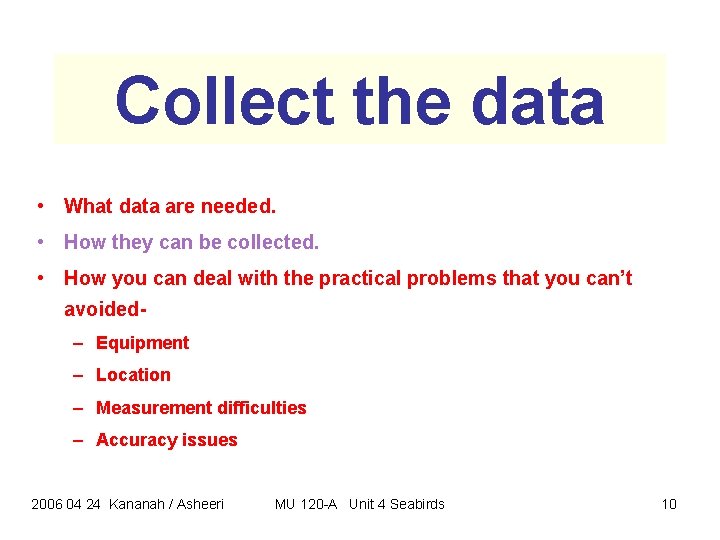
Collect the data • What data are needed. • How they can be collected. • How you can deal with the practical problems that you can’t avoided– Equipment – Location – Measurement difficulties – Accuracy issues 2006 04 24 Kananah / Asheeri MU 120 -A Unit 4 Seabirds 10
Primary data • Is the data you collect yourself. • Example: the results of a scientific experiment which you have carried out 2006 04 24 Kananah / Asheeri MU 120 -A Unit 4 Seabirds 11
Secondary data • Is the data which someone else has already collected. • Examples: – Government statistics – Sport results 2006 04 24 Kananah / Asheeri MU 120 -A Unit 4 Seabirds 12
Analyze the data • There are many statistical diagrams and numerical computations available for analyzing data. • This is the stage where the calculator is invaluable. 2006 04 24 Kananah / Asheeri MU 120 -A Unit 4 Seabirds 13
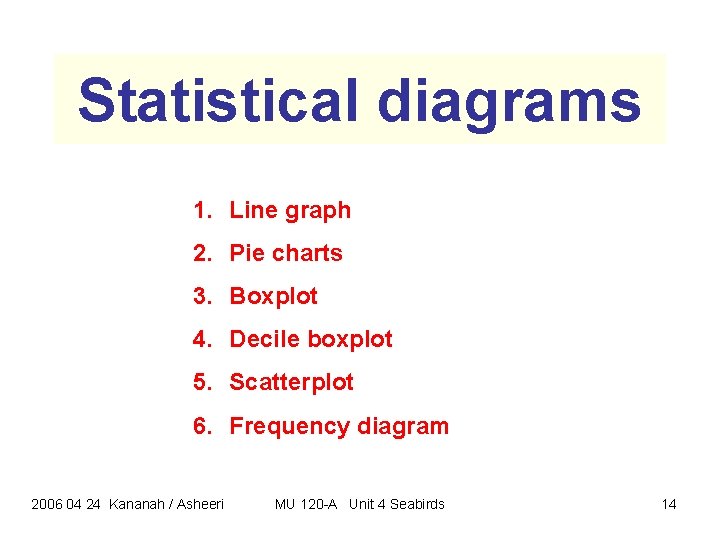
Statistical diagrams 1. Line graph 2. Pie charts 3. Boxplot 4. Decile boxplot 5. Scatterplot 6. Frequency diagram 2006 04 24 Kananah / Asheeri MU 120 -A Unit 4 Seabirds 14
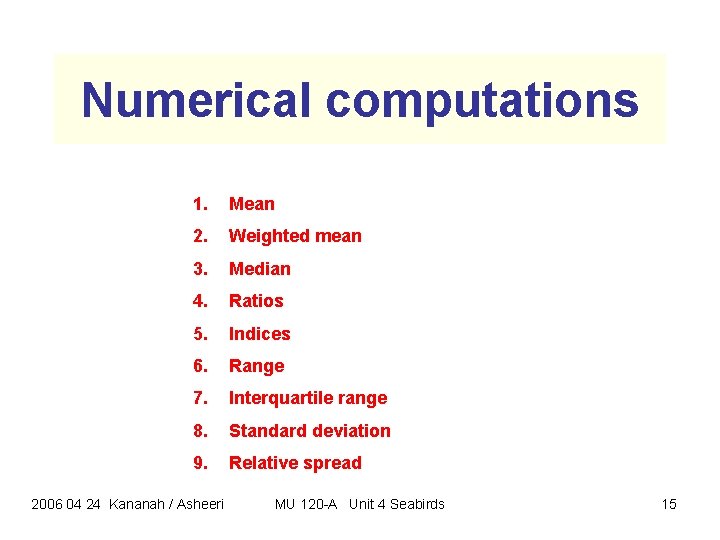
Numerical computations 1. Mean 2. Weighted mean 3. Median 4. Ratios 5. Indices 6. Range 7. Interquartile range 8. Standard deviation 9. Relative spread 2006 04 24 Kananah / Asheeri MU 120 -A Unit 4 Seabirds 15
Interpret the results • Consider explanations • Draw conclusions 2006 04 24 Kananah / Asheeri MU 120 -A Unit 4 Seabirds 16
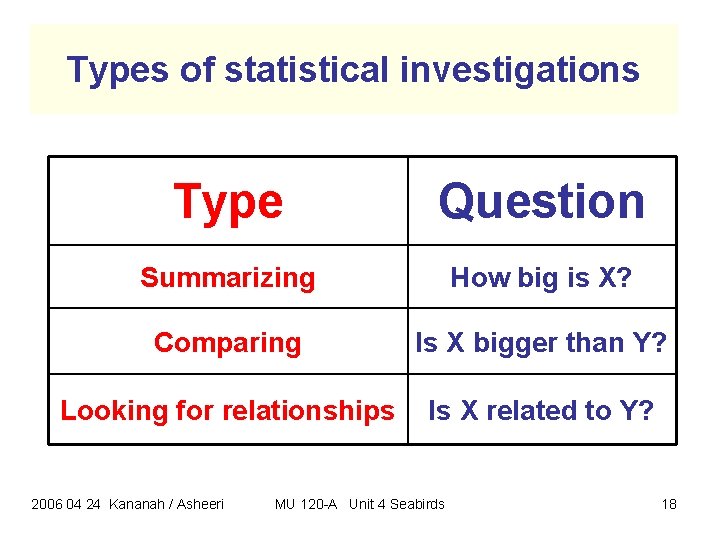
Types of statistical investigations • There are three board types of statistical investigation. • Each type can be characterized by a simple question. 2006 04 24 Kananah / Asheeri MU 120 -A Unit 4 Seabirds 17
Types of statistical investigations Type Question Summarizing How big is X? Comparing Is X bigger than Y? Looking for relationships Is X related to Y? 2006 04 24 Kananah / Asheeri MU 120 -A Unit 4 Seabirds 18
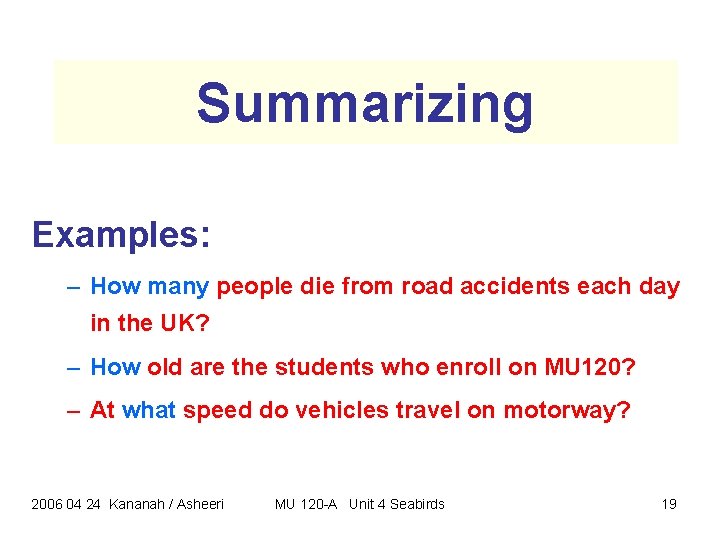
Summarizing Examples: – How many people die from road accidents each day in the UK? – How old are the students who enroll on MU 120? – At what speed do vehicles travel on motorway? 2006 04 24 Kananah / Asheeri MU 120 -A Unit 4 Seabirds 19
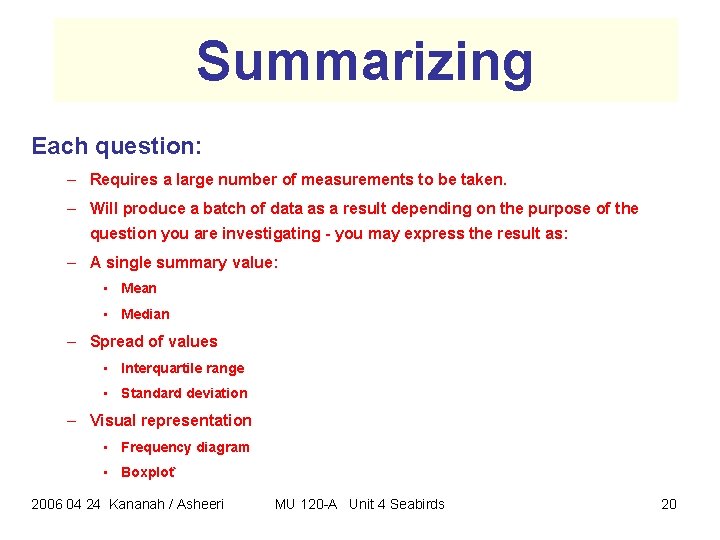
Summarizing Each question: – Requires a large number of measurements to be taken. – Will produce a batch of data as a result depending on the purpose of the question you are investigating - you may express the result as: – A single summary value: • Mean • Median – Spread of values • Interquartile range • Standard deviation – Visual representation • Frequency diagram • Boxplot` 2006 04 24 Kananah / Asheeri MU 120 -A Unit 4 Seabirds 20
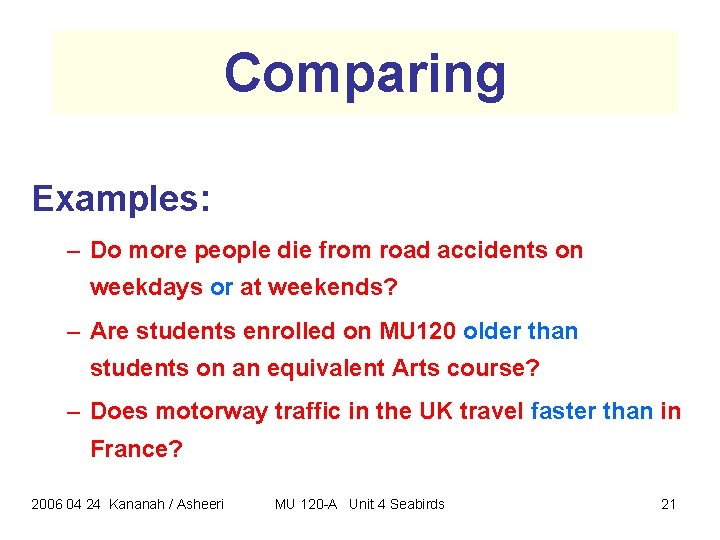
Comparing Examples: – Do more people die from road accidents on weekdays or at weekends? – Are students enrolled on MU 120 older than students on an equivalent Arts course? – Does motorway traffic in the UK travel faster than in France? 2006 04 24 Kananah / Asheeri MU 120 -A Unit 4 Seabirds 21
Comparing Two separate batches of data must be obtained, comparing them using: – Numerical computations – Visual diagrams 2006 04 24 Kananah / Asheeri MU 120 -A Unit 4 Seabirds 22
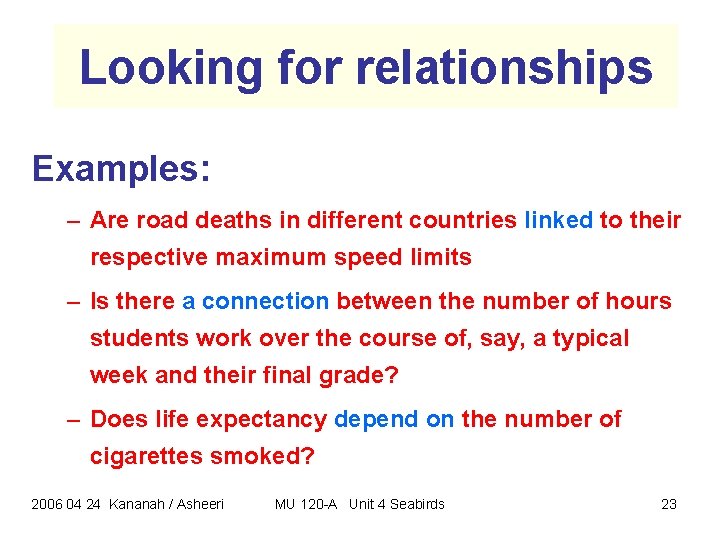
Looking for relationships Examples: – Are road deaths in different countries linked to their respective maximum speed limits – Is there a connection between the number of hours students work over the course of, say, a typical week and their final grade? – Does life expectancy depend on the number of cigarettes smoked? 2006 04 24 Kananah / Asheeri MU 120 -A Unit 4 Seabirds 23
Looking for relationships Is a good idea to plot the data on a scatterplot and look for pattern. Note: the existence of close association between two variables does not prove that one has caused the other Do Q 1 RBA P 25 2006 04 24 Kananah / Asheeri MU 120 -A Unit 4 Seabirds 24
Section 2 Monitoring seabird populations on Skomer 2006 04 24 Kananah / Asheeri MU 120 -A Unit 4 Seabirds 25
Section 3 How well can you estimate? 2006 04 24 Kananah / Asheeri MU 120 -A Unit 4 Seabirds 26
Section 4 Four case studies 2006 04 24 Kananah / Asheeri MU 120 -A Unit 4 Seabirds 27
Outcomes 1 - Classify investigations into three broad investigation types. 2 - Apply the discrete/continuous distinction to variables. 3 - Explain how the four-stages model can be used to structure the planning, conduct and write-up of statistical investigations. 2006 04 24 Kananah / Asheeri MU 120 -A Unit 4 Seabirds 28
Film review One of the members of the course team is a regular Guardian reader and is particularly interested in the reviews of films which are about to be shown on television. Over a period of time, he gained the impression that more older films were being selected for review than newer ones. He decided to carry out a statistical investigation to see if this was in fact the case. 2006 04 24 Kananah / Asheeri MU 120 -A Unit 4 Seabirds 29
1. Posing Does the Guardian TV reviewer tend to select older films? 2006 04 24 Kananah / Asheeri MU 120 -A Unit 4 Seabirds 30
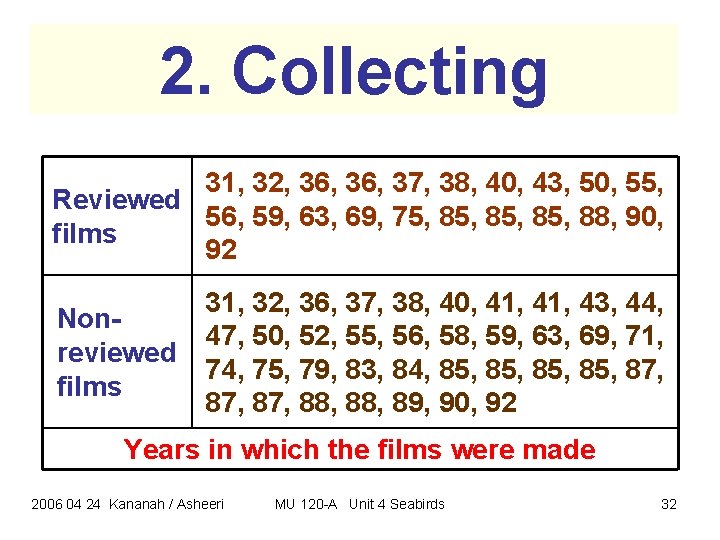
2. Collecting • He decided to look at the films that were shown on the UK television over a particular week. • Data on the years in which the films were made were collected from the TV Guide of the Guardian of 9 October 1993. • These are shown, sorted into ascending order, in Table below. • Note that all the years have been abbreviated so that, for example, 1931 is shown as 31. 2006 04 24 Kananah / Asheeri MU 120 -A Unit 4 Seabirds 31
2. Collecting 31, 32, 36, 37, 38, 40, 43, 50, 55, Reviewed 56, 59, 63, 69, 75, 85, 88, 90, films 92 Nonreviewed films 31, 32, 36, 37, 38, 40, 41, 43, 44, 47, 50, 52, 55, 56, 58, 59, 63, 69, 71, 74, 75, 79, 83, 84, 85, 85, 87, 87, 88, 89, 90, 92 Years in which the films were made 2006 04 24 Kananah / Asheeri MU 120 -A Unit 4 Seabirds 32
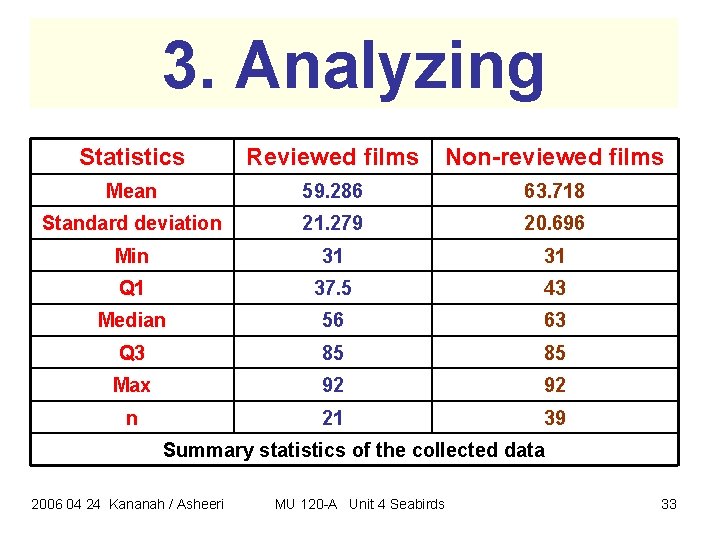
3. Analyzing Statistics Reviewed films Non-reviewed films Mean 59. 286 63. 718 Standard deviation 21. 279 20. 696 Min 31 31 Q 1 37. 5 43 Median 56 63 Q 3 85 85 Max 92 92 n 21 39 Summary statistics of the collected data 2006 04 24 Kananah / Asheeri MU 120 -A Unit 4 Seabirds 33
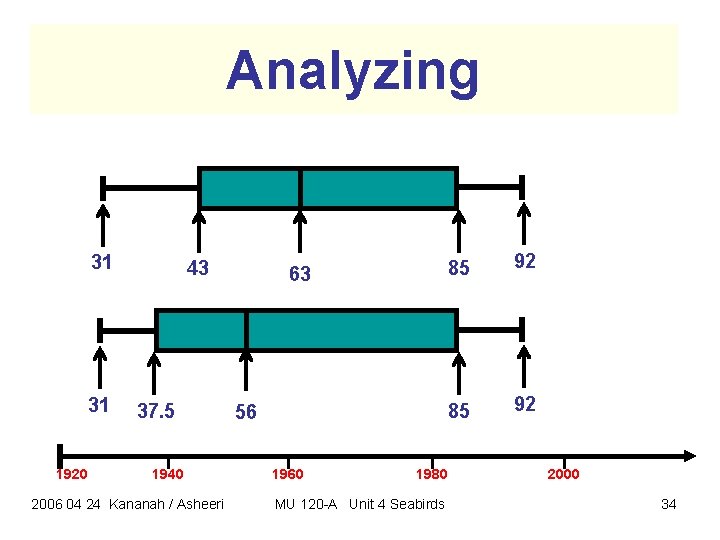
Analyzing 31 31 1920 43 37. 5 1940 2006 04 24 Kananah / Asheeri 63 56 1960 1980 MU 120 -A Unit 4 Seabirds 85 92 2000 34
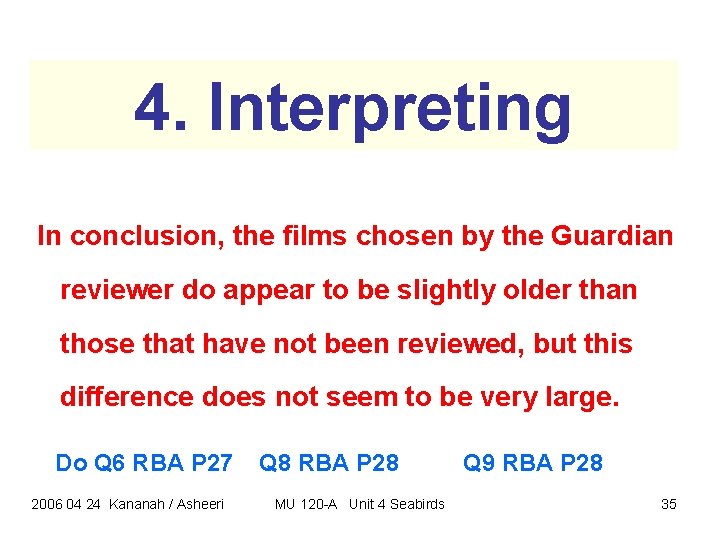
4. Interpreting In conclusion, the films chosen by the Guardian reviewer do appear to be slightly older than those that have not been reviewed, but this difference does not seem to be very large. Do Q 6 RBA P 27 2006 04 24 Kananah / Asheeri Q 8 RBA P 28 MU 120 -A Unit 4 Seabirds Q 9 RBA P 28 35