United States Migration Patterns Internal Internal US Migration
")
 • U. S. settlement patterns – Movement is East to")
 • Westward Expansion/Manifest Destiny – “US should possess the whole")
 • Westward Expansion/Manifest Destiny – “US should possess the whole")


 •")


 Push Factors • urban decay – crowded housing (apts. ) •")


- Slides: 27
United States Migration Patterns (Internal)
Internal US Migration (interregional) • U. S. settlement patterns – Movement is East to West – Colonial settlement clustered on the East Coast • Limited to coastal areas by British – Proclamation Line of 1763 • Intervening obstacle – Appalachian Mountains • Gravity Model • Ties to Atlantic trade – Improved transportation opens interior • Scots – Irish frontiersmen • Erie Canal
Internal US Migration (interregional) • Westward Expansion/Manifest Destiny – “US should possess the whole continent” – Oregon Trail (1840 s) – California Gold Rush (1849)
Internal US Migration (interregional) • Westward Expansion/Manifest Destiny – “US should possess the whole continent” – Oregon Trail (1840 s) – California Gold Rush (1849) • Settlement of the Great Plains – Homestead Act (1862) » remember link to immigration » govt. encourages migration » Make wasteland productive – Railroads (comp. 1869) » sells land grants – becomes arable land » steel plow, windmills » barbed wire
• 7 million African-Americans • 1910 – 1970 – Two waves (WWI and WWII) • rural South to urban North Great Migration
• 7 million African-Americans • 1910 – 1970 • rural South to urban North – Push factors • Economic – poverty, share-cropping Great Migration
Sharecropping “cycle of poverty”
• 7 million African-Americans • 1910 – 1970 • rural South to urban North Great Migration – Push factors • Economic (in addition to sharecropping) – eviction due to mechanized farming • Cultural – discrimination » Jim Crow laws » Plessy v Ferguson (sep. but equal) » = separate but NOT equal » Voting restrictions (literacy tests, poll taxes, etc. ) – Violence » KKK, lynching
• 7 million African-Americans • 1910 – 1970 • rural South to urban North Great Migration – Pull factors • Industrial jobs (economic) – White factory workers off fighting world wars » Armed forces are segregated • better treatment (cultural)? – face segregation and discrimination – Some suffer from ghettoization – De facto vs. de jure segregation • “Great Return” or The “New Great Migration” – Since 1980 s. African-Amer return to South – Urban North to Urban/Suburban South • Chgo lost 200 k black residents in the last census – What cultural push/pull factors are involved in this counter-migration? • Push – Middle-class African-Americans leaving city due to cultural push factors (gang violence, police brutality) • Pull – Cultural reconnection with family/Southern culture – For economic, see Rust Belt → Sun Belt (later)
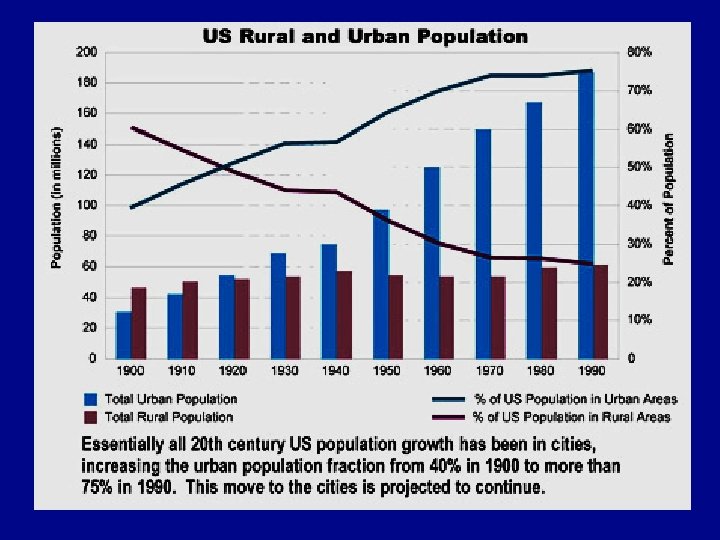
• from rural to urban areas – “urbanization” • Stage 2 (industrialization) • US = late 1800 s thru mid 1900 s – Primary reason = economic – Push = farm mechanization – Pull = industrial jobs in cities • What effects does urbanization have? – Secular attitudes » 1920 s culture clash – children = economic burdens – LOWER CBR/NIR • from urban to rural areas • “counterurbanization” – form of countermigration • primary reasons are cultural – country lifestyle, easier pace Interregional migration in the United States
Migration from Rust Belt to Sun Belt • Push factors – weather • cold winters – declining industry • “Rustbelt” • high costs – strong unions – high regulation – high taxes » e. g. to combat polluting effects of industry • business move to avoid higher costs – Highways/trucks make this relocation possible (no longer tied to RR hubs) – if job growth happens elsewhere = people follow economic growth • Urban decay (see suburbanization) as a push factor
• Pull factors – warmer climate • “Sunbelt” – Mild winters, golf year-round Sun Belt • AC becomes widespread in 1950 s and 1960 s – makes summers bearable in South! – Low business costs • non-union environment – South = “right-to-work” states » weakens unions – regulation/taxes kept low » on purpose to attract industry
1968 2020
• Pull factors – warmer climate • “Sunbelt” – Mild winters, golf year-round Sun Belt • AC becomes widespread in 1950 s and 1960 s – makes summers bearable in South! – Low business costs • non-union environment – South = “right-to-work” states » weakens unions – regulation/taxes kept low » on purpose to attract industry – high population growth • Since 1970 – +25 electoral votes • 2000 – 30 – 88% of all US pop. growth
Changing Center of the U. S. Population • Center of population has moved consistently from east to west – representing evidence of westward migration, territorial expansion, Manifest Destiny • Note southward trend since mid-20 th century – Represents Rustbelt to Sunbelt migration
Intraregional migration in the United States • Migration from “central city” to suburban areas – “suburbanization” = biggest migration since 1950 • pre-WWII = most city residents lived densely – Multifamily units, close to downtown, dependent on public transit
Chicago population density 1950
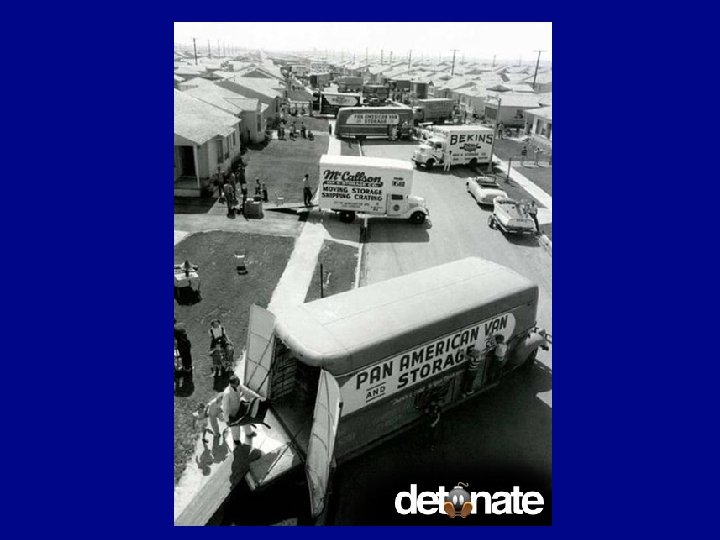
Intraregional migration in the United States • Migration from “central city” to suburban areas – “suburbanization” = biggest migration since 1950 • pre-WWII = most city residents lived densely – two decades of hardship/sacrifice (Great Depression & WWII) • post WWII = America is king! optimism abounds – enormous pent up demand!!!! Rationing is over! » therefore…. spend, spend → consumerism – returning veterans → housing shortage → govt. programs » Almost entirely excluded African-Americans (redlining) » FHA , GI Bill – Optimistic populations have babies » Baby Boom → space needed to raise children – Biggest factor facilitating this migration: » Automobiles » affordable, highways built, can live farther from work • Is there a countermigration from suburb to city = – “gentrification” (this will be covered in Unit 6) » The movement of middle class (mostly white) people into formerly “distressed” central city neighborhoods
• tremendous growth of the suburbs in 20 th century America • “suburbs” are a part of the urban region. – movement from the city to the suburbs = intraregional – movement from rural areas to city/suburbs = urbanization = interregional
Suburbanization (mostly cultural) Push Factors • urban decay – crowded housing (apts. ) • 1950 Chicago = 3. 7 million people in a MUCH smaller footprint Pull factors • suburban lifestyle – space • detached homes, yards, garages • room for kids – poverty • crime • unemployment – low poverty • low crime • poverty and crime are linked not race/ethnicity and crime – industry moves due to highways – schools • underfunded • school desegregation/busing – scared of the “other” • new immigrants = different • African-Americans – “de jure” segregation struck down • results in “white flight” – mostly white middle-class flee urban problems for “suburban lifestyle”? – increases inner city decline as middle class taxes flow from city to suburbs – schools • • safe, well-funded, no gangs good government • better services • low taxes • “American dream” – or is it “homogeneity” they seek?
Push Factors
Pull Factors
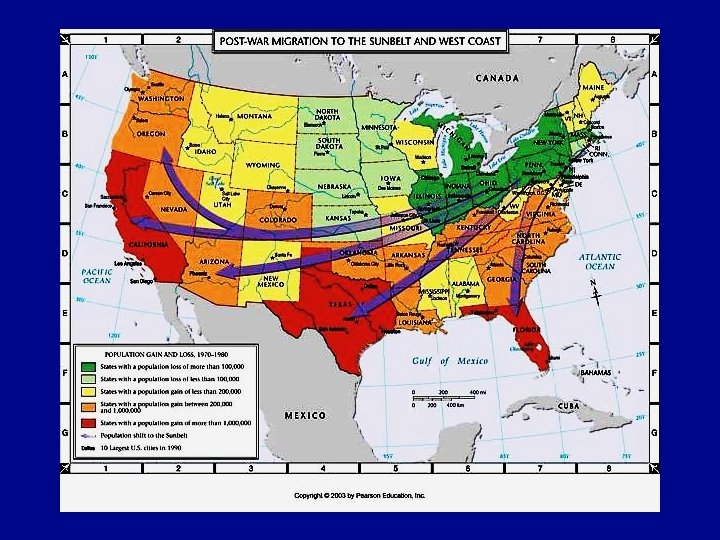
• Where do you see evidence of suburbanization on this map? – Population gain in counties surrounding Cook/Chicago. – Population loss in Cook/Chgo – Population gain in areas outside St. Louis. • What other migration trend can be supported by this map? – Urbanization • Population loss in rural areas • Other? – “rural” counties with population gains are mostly small cities with universities. – represents small-scale urbanization and brain gain migration to university towns.
Intraregional Migration in the United States • Note that the biggest flow is from city to suburbs. – Suburbanization • Biggest migration trend in post-WWII America! Know this! • Note that all flows have an opposite flow though not necessarily of the same magnitude – countermigration