Trains statustests M Gheata Train types run centrally

- Slides: 15

Trains status&tests M. Gheata

Train types run centrally • FILTERING – Default trains for p-p and Pb-Pb, data and MC (4) • Special configuration need to be applied for the different cases (pre-configure stage) • Std AOD, muons and vertexing • Running automatically after reco – On-demand filtering using special tender settings • Generally for pass 2 • Std AOD, muons and vertexing – Quite stable code, to be moved in Release – Vertexing is cuts dependent (needs many passes), to be done on demand as post-filtering from now on (? ) – Memory stable (~2 GB) but CPU and disk consuming – A queue of trains according priorities for non default trains (? ) • Discussed and approved weekly • PWG trains – Just started to be run centrally, finished tests – Probably many trains per PWG needed, managed by PWG

PWG 1 QA train • 20 different modules, 1 to come (FMD) – Heavy memory requirements (above 3 GB) • Cleanup needed, see next slides – Train gets kicked out by some sites • Merging is heavy for runs with too many chunks – Memory in the last merging step gets too big – Process only 10% of chunks • Some new trigger classes used recently (CINT 7, EMC 7, …) – QA train was set for k. MB, now we need to run it with k. Any. Int plus other triggers • All tasks requesting a special trigger should filter from the trigger mask and fill separate histograms (within the memory limit) • Requirements described in Savannah bug #84007 • To be run with the Release

Testing QA wagons • Prepare checking scripts to be run on a test machine – Testing each QA wagon independently on a local dataset – Checking is based on syswatch. root – Future support in the alien plug-in for producing the scripts • Simple check and fit of memory profiles extracted by the analysis manager – Doing a linear fit in a specified range (stable regions) and extracting memory value + leak – Subtracting the baseline given by Event. Selection task + OCDB connect – Not easy to set-up automatically due to memory jumps

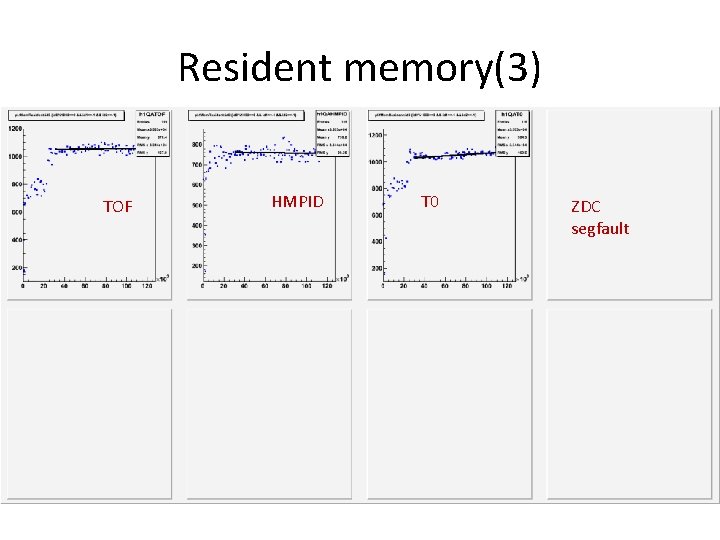
Most recent checks • Versions tested on pcaliense 05 – Root v 5 -28 -00 e – Ali. Root v 4 -21 -28 -AN • Run tested: 152371 from LHC 11 c – 120 K events • Wagons that did not finished the test: – ZDC (segfault) – savannah #78558 • 20 wagons checked in parallel (few hours)

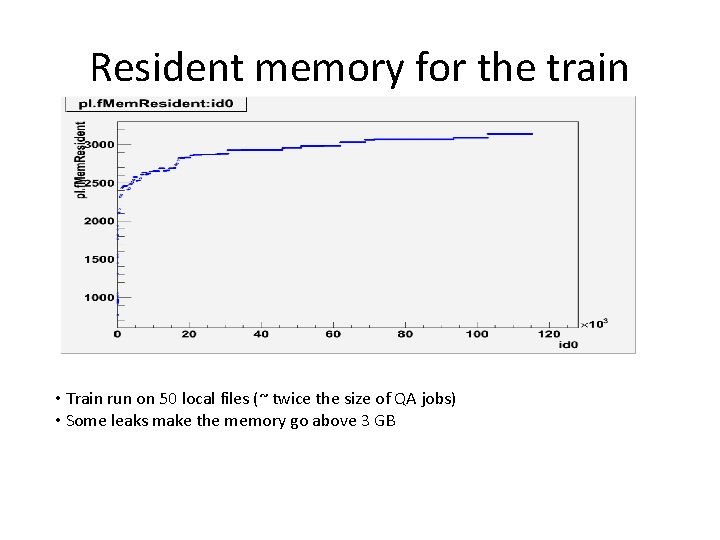
Resident memory for the train • Train run on 50 local files (~ twice the size of QA jobs) • Some leaks make the memory go above 3 GB

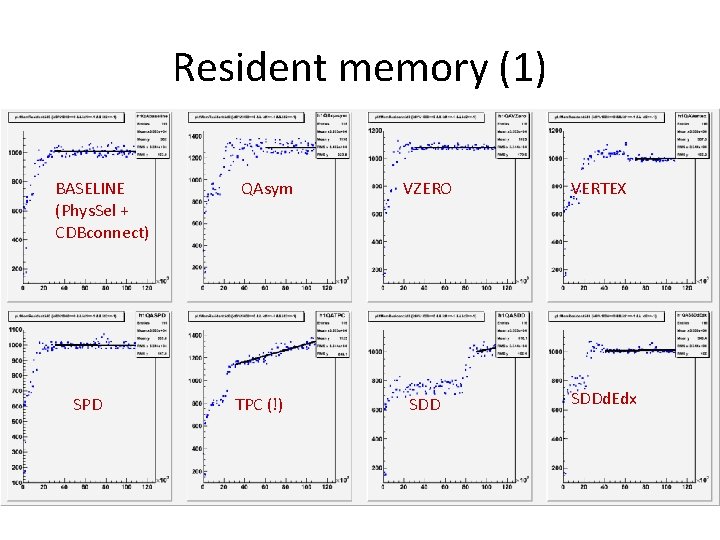
Resident memory (1) BASELINE (Phys. Sel + CDBconnect) SPD QAsym TPC (!) VZERO VERTEX SDDd. Edx

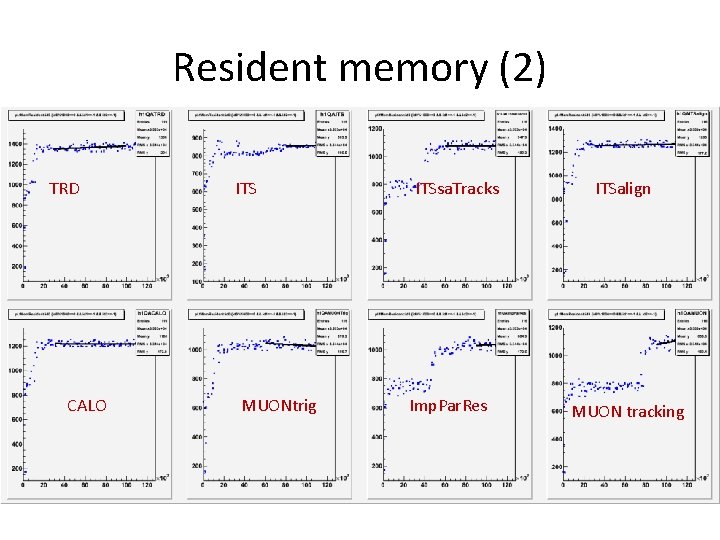
Resident memory (2) TRD CALO ITS MUONtrig ITSsa. Tracks Imp. Par. Res ITSalign MUON tracking

Resident memory(3) TOF HMPID T 0 ZDC segfault

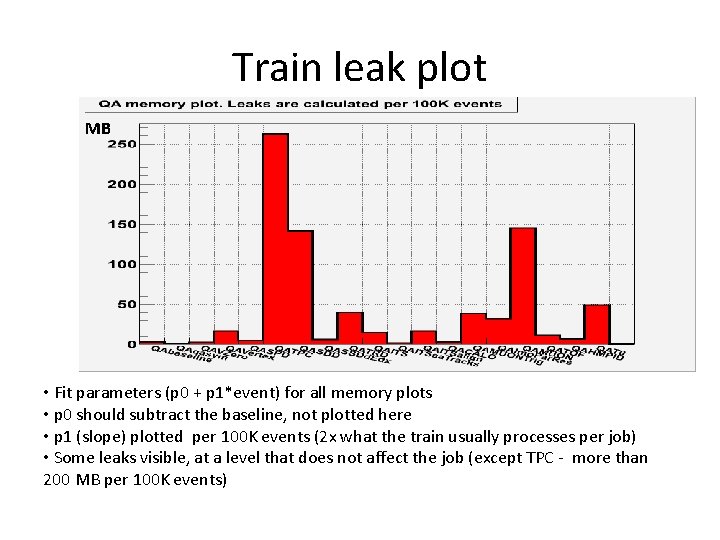
Train leak plot MB • Fit parameters (p 0 + p 1*event) for all memory plots • p 0 should subtract the baseline, not plotted here • p 1 (slope) plotted per 100 K events (2 x what the train usually processes per job) • Some leaks visible, at a level that does not affect the job (except TPC - more than 200 MB per 100 K events)

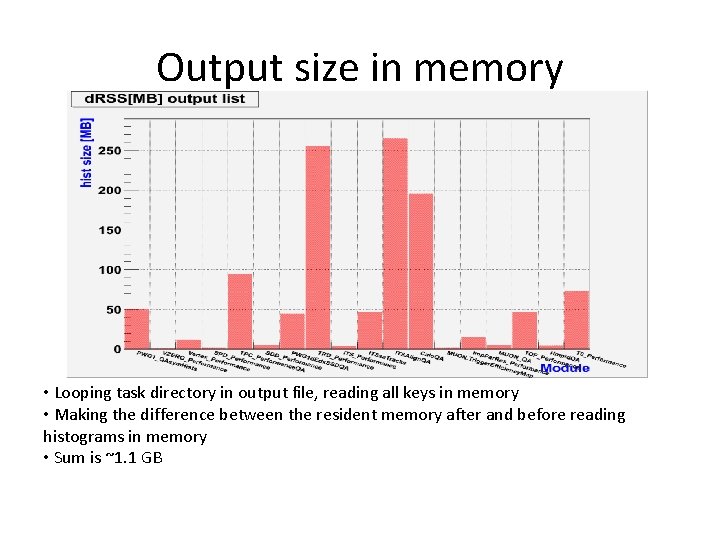
Output size in memory • Looping task directory in output file, reading all keys in memory • Making the difference between the resident memory after and before reading histograms in memory • Sum is ~1. 1 GB

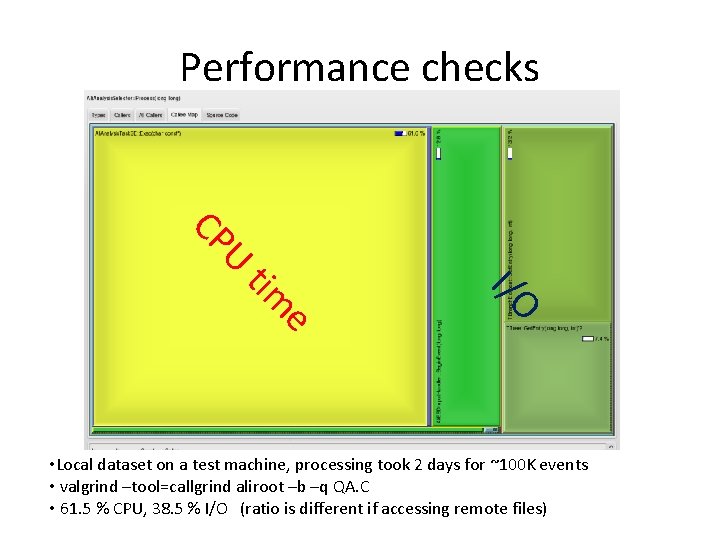
Performance checks U CP I/O e tim • Local dataset on a test machine, processing took 2 days for ~100 K events • valgrind –tool=callgrind aliroot –b –q QA. C • 61. 5 % CPU, 38. 5 % I/O (ratio is different if accessing remote files)

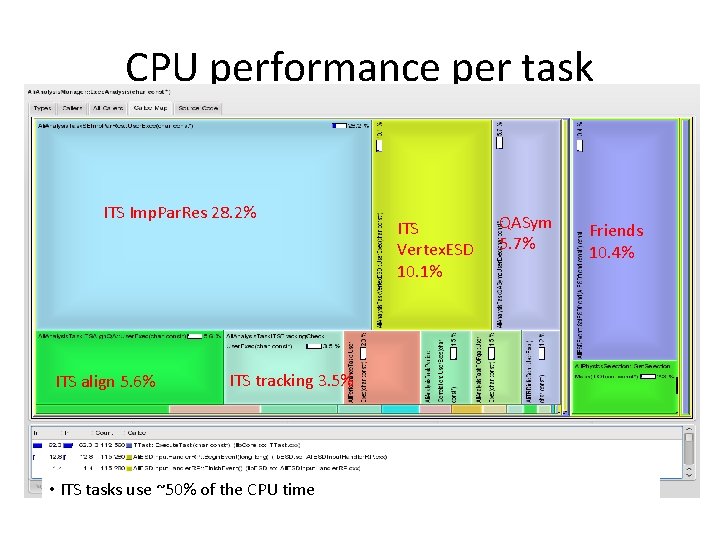
CPU performance per task ITS Imp. Par. Res 28. 2% ITS align 5. 6% ITS tracking 3. 5% • ITS tasks use ~50% of the CPU time ITS Vertex. ESD 10. 1% QASym 5. 7% Friends 10. 4%

Trains management • Trains can be now prepared and checked using the alien plug-in • Submission and management now done mostly by Costin and Latchezar – We need a simple system that can be used by train administrators • Start, stop, cleanup, input datasets – Defining a queue of central non-default trains

Conclusions • Currently implemented checking macros for QA train • Many central trains and more to come, need some automated assembly and checking procedure • Make train administration easier and allow more people using it