tom h wilsongeo wvu edu Department of Geology


 is a mathematical representation of this bell-shaped characteristic.")

 distribution of pebble masses looks a bit different from the probability")

 of Waltham - In this question Waltham evaluates")
/48 or +1. 06 standard deviations from the")
 and p")


=0. 954 P( 2. 1 )=0. 964 1 0. 0 p= P(")


- Slides: 22
tom. h. wilson@geo. wvu. edu Department of Geology and Geography West Virginia University Morgantown, WV
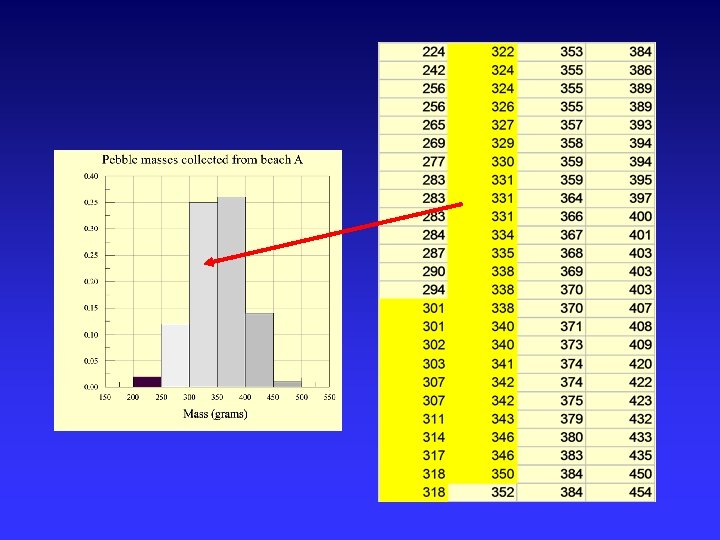
The probability of occurrence of specific values in a sample often takes on a bell-shaped appearance as in the case of our pebble mass distribution.
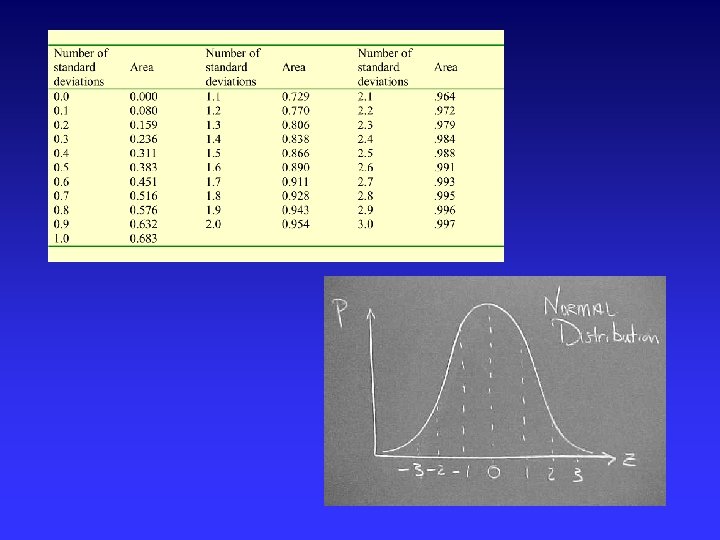
The Gaussian or normal distribution p(x) is a mathematical representation of this bell-shaped characteristic. This mathematical representation yields a bell shaped curve of probabilities whose form and extent is uniquely defined by the mean and variance derived form a sample.
The Gaussian distribution can also be written using the standard normal variable z. The standard normal variable z = (x-x)/ represents the number of standard deviations the value x is from the mean value.
The Gaussian (normal) distribution of pebble masses looks a bit different from the probability distribution we derived directly from the sample.
In the probability histogram, each bar represents a discrete sum of masses over a 50 gram range divided by the total number of the pebbles.
Consider question 7. 4 (page 124) of Waltham - In this question Waltham evaluates the equivalent probability that a pebble having a mass somewhere between 401 and 450 grams will be drawn from a normal distribution having the same mean and standard deviation as the sample.
Note that 401 grams lies (401 -350)/48 or +1. 06 standard deviations from the mean. 450 grams lies (450 -350)/48 or +2. 08 standard deviations from the mean value. 1. 06 and 2. 08 are z-values or standard normal representations of the pebble masses associated with Note that Waltham rounds this sample. off the mean and standard deviation to 350 and 48, respectively.
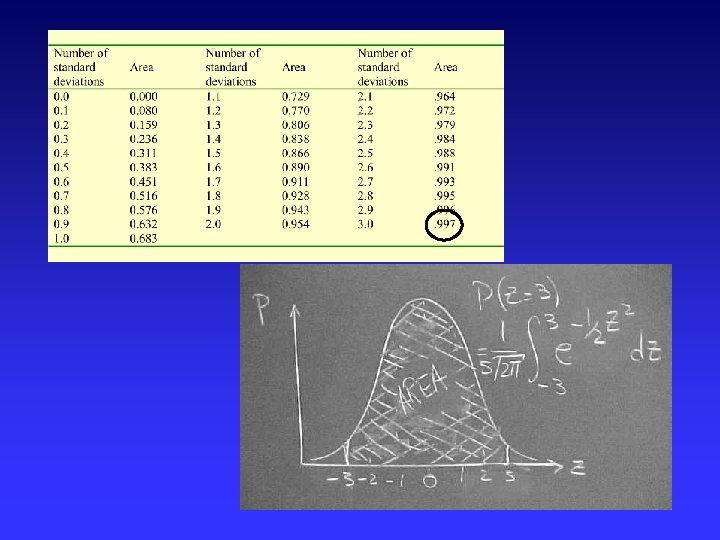
How can we estimate the area between p (z = 1. 06) and p (z=2. 08)? Note that area corresponds to the probability that a sample drawn at random from this population will have a value somewhere between 401 and 450 grams.
The area we want to find This Area The areas we get from tables Note that we can express that area as one half the difference of areas.
. . . one half the combined areas. yields - X
Question 7. 4 is a little more complicated. We no longer have numbers listed in the table. Waltham goes through a weighted average determination of the area under the curve between + and - 1. 06 standard deviations. He obtains the area 0. 71. Confirm for yourself that the area out to + and - 2. 08 is 0. 962. The difference is 0. 252. Now we take one-half of that to get 0. 126
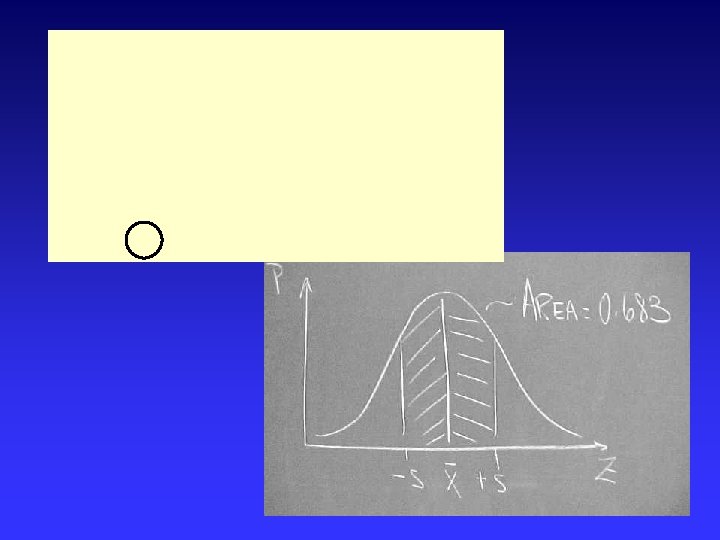
This method of linear interpolation assumes linearity in the curve between 1 and 1. 1 P( 1 )=0. 683 P( 1. 1 )=0. 729 p 6 4 0. =0 P( 1. 06 ) is six-tenths of the way from P(1) and P(1. 1) or 0. 683 plus 0. 6 times the difference (0. 046) =0. 683 + 0. 0276 = 0. 71
P( 2 )=0. 954 P( 2. 1 )=0. 964 1 0. 0 p= P( 2. 08 ) is eight-tenths of the way from P(2) and P(2. 1) or 0. 954 plus 0. 8 times the difference (0. 01) =0. 954 + 0. 008 = 0. 962
The probability of finding pebbles with masses in the range 401 to 450 grams is ½ the differences in two areasi. e. ½ (0. 962 -0. 71) =0. 126 … 0. 126 is the normal probability of obtaining a pebble with mass between 401 and 450 grams from the beach under investigation.
Note that the value derived from the normal distribution compares nicely with that observed in the sample (0. 126 vs. 0. 14).
Read section 7. 5 carefully and be prepared to confirm the probabilities listed in Table 7. 7 from Waltham.