The Rotational Spectrum of NAcetyl Phenylalanine Methyl Ester


 T 2 φ ψ T 1 χ1 χ2")
 475 cm-1 βL(g-) 370 cm-1 (826 cm-1)")
 T 2 Exp-Calc. φ ψ T 1 χ1 χ2 Exp.")


 30 or 20")


- Slides: 27
The Rotational Spectrum of N-Acetyl Phenylalanine Methyl Ester Measured with a Medium Bandwidth (100 MHz) Chirped-Pulse Fourier Transform Microwave Spectrometer Kevin O. Douglass, Francis Lovas, Kevin Davis, Karen Siegrist, F. Plusquellic National Institute of Standards and Technology Biophysics Group Brooks H. Pate Department of Chemistry, University of Virginia David W. Pratt Department of Chemistry, University of Pittsburg David
N-Acetyl-Phenylalanine Methyl Ester T 2 Methyl groups T 1 and T 2 have low barriers to internal rotation. -Fit AA, AE and EA states methyl top angles provide added structural information φ ψ χ1 T 1 χ2 -Ramachandran angles 3 φ and ψ -Side Chain dihedral angles χ1 and χ2 Single Conformer Observed 1, 2 1. Gerhards, M. and Unterberg, C. ; Phys. Chem. Phys. 2002, 4, 1760 -1765. 2. Gerhards, M. ; Unterberg, C. ; Gerlach, A. ; Jansen, A. , Phys. Chem. Phys. 2004, 6, 2682 -2690. 3. Lavrich, R. J. ; Plusquellic, D. F. ; Suenram, R. D. ; Fraser, G. T. ; Walker, A. R. H. ; Tubergen, M. J. , J. Chem. Phys. 2004, 118, 1253 -1265.
Challenges for studying peptide systems Low signal intensity – Population spread over many levels – Population potentially further spread by multiple conformers – Low vapor pressure – Sample decomposition Many variable search – Temperature, MW power, pulse timing, line position
Microwave Spectrometer Designs Q=10, 000 Q=~100 Bandwidth ~100 MHz Equivalent Sensitivity reached at ~100 avgs. Requires moderate MW input power (~1 W) 170 MHz/min ~80 Steps (5 GHz 30 min) Q=1 Bandwidth 12000 MHz 2 Equivalent Sensitivity reached at 10, 000 avgs Requires high input power (~1 k. W) Fast data acquisition time – 1 Step (12 GHz) – 17 min. Bandwidth 0. 5 MHz 1 Extremely high sensitivity on a single shot (typ. 10 avgs. ) Requires low MW input power (~0. 1 m. W) Very slow scan speed (14 MHz/min) – 12, 000 steps (5 GHz) Broad search window with the cavity enhancement For large systems there is high probability of observing a line in a single step 1. Balle, T. J. ; Flygare, W. H. , Rev. Sci. Instrum. 1981, 52, 33 -44. 2 G. G. Brown, B. C. Dian, K. O. Douglass, S. M. Geyer, B. H. Pate, Rev. Sci. Inst, 79 053103 (2008).
Semi-Confocal CP-FTMW 1, 2, 3 10 MHz Ru clock Arbitrary Function Generator 1 -100 MHz Chirp (1 μs) 2 GS/s DC-240 MHz Synthesizer 1 L. O. 10 -18 GHz n ± 1 -100 MHz n Up convert chirped pulse (upper and lower sidebands) Synthesizer 2 Down Convert FFT 1 W Amp n - 100 MHz LNA IF Semi-confocal cavity 4 Digital Oscilloscope 1 GS/s 2 Channel 500 MHz Coaxial nozzle alignment Directly Digitize IF signal (Time domain 100 – 200 ms) Fourier Transform to Frequency Domain DC – 200 MHz 1. G. G. Brown, K. O. Douglass, B. C. Dian, S. M. Geyer and B. H. Pate, “SEMI-CONFOCAL CAVITY AND OTHER EXPERIMENTS IN BROADBAND FOURIER TRANSFORM MICROWAVE (FTMW) SPECTROSCOPY”, 60 th International Symposium on Molecular Spectroscopy, Columbus OH 2005 2. Brown, G. G. ; Dian, B. C. ; Douglass, K. O. ; Geyer, S. M. ; Pate, B. H. , J. Mol. Spectrosc. , 238, 200 -212. (2006) 3. G. G. Brown, B. C. Dian, K. O. Douglass, S. M. Geyer, S. T. Shipman, B. H. Pate, Rev. Sci. Inst, 79 053103 (2008). 4. Hansen N, Andresen U, Dreizler H, Grabow JU, Mader H, Temps F, Chem. Phys. Lett. 289, 311 -318 (1998)
Chirped Pulse: Generation and Diagnostics 10 MHz Ru clock Arbitrary Function Generator 1 -100 MHz Chirp (1 μs) 2 GS/s 240 MHz Obs. Signal 100 - 300 MHz Synthesizer 1 L. O. Synthesizer 2 Down Convert n n ± 1 -100 MHz n - 200 MHz Digital Oscilloscope 2 GS/s 4 Channel 500 MHz Relative Power (d. B)
Mode Analysis MW foam Relative Power -0. 2 -0. 4 -0. 6 -0. 8 -1 -1. 2 -1. 4 0 50 100 150 Frequency (MHz) 200
Cavity Design 9. 50” Heated reservoir nozzle 20” Rad. of Curvature Mirror separation ~12. 5”
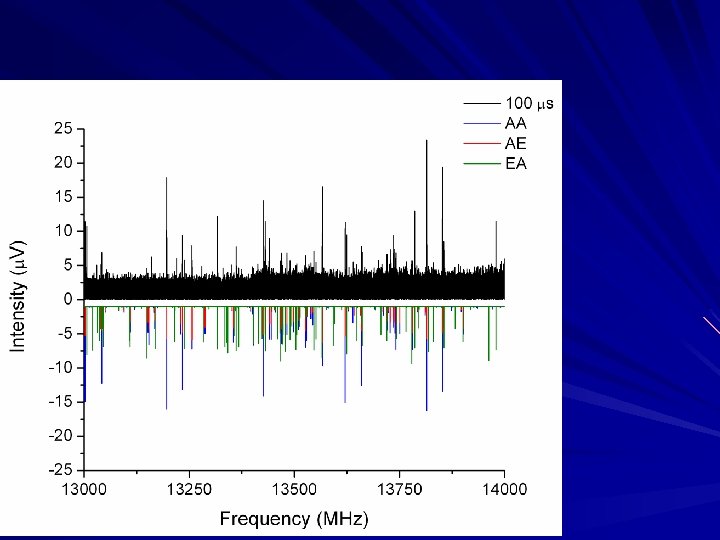
Microwave Spectrum of Ac-Phe-OMe SC-CP-FTMW Nozzle Temp. 190 C Digitized for 20 μs 1000 avgs/step 60 MHz step size ~1 GHz/hr scan speed Simulation 3 K
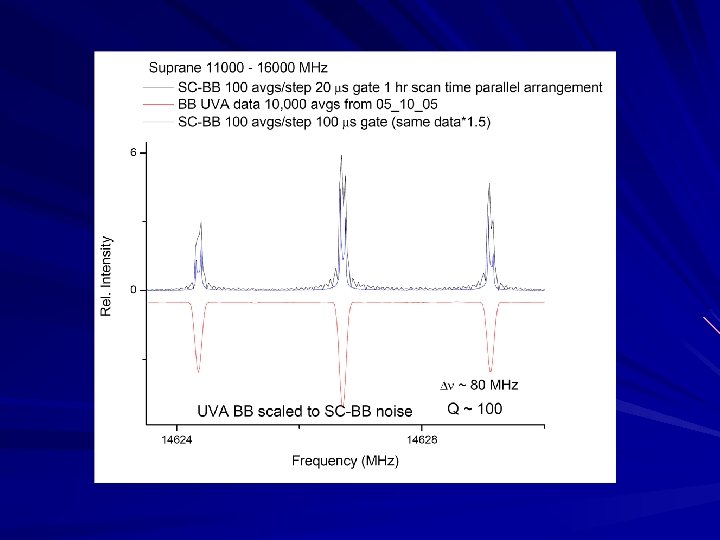
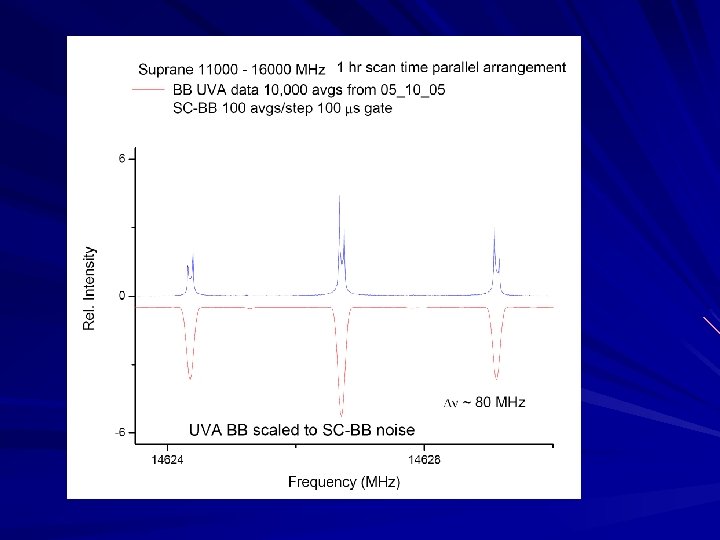
Microwave Spectrum of Ac-Phe-OMe Semi-Confocal Cavity vs. High Q mini-FTMW Spectrometer 1000 avgs/step 100 μs 10 k. Hz 50 avgs/step 400 μs 2. 5 k. Hz
Cavity Design 9. 50” Heated reservoir nozzle 20” Rad. of Curvature Mirror separation ~12. 5”
Large vs. Small Aperture Setup 200 μs record length AA AE Q ~ 200 Q ~ 9000 AE 250 avgs 2500 avgs 200 μs record length EA
Fit Results 1 Conformer assigned βL(g+) T 2 φ ψ T 1 χ1 χ2 Jb 95 spectral fitting program Parameter AA State AE State EA State A / MHz 571. 86288(4) 571. 86127(7) 471. 181(4) B / MHz 480. 58355(5) 480. 58164(8) 529. 058 (2) C / MHz 309. 16440(3) 309. 16420(6) 360. 315 (2) Da / MHz ---- 0. 5093(2) 355. 094 (9) Db / MHz ---- 0. 50(4) ---- Dc / MHz ---- 0. 1849(2) ---- Eab / MHz ---- -54. 201 (2) Eac / MHz ---- -86. 540 fixed Ebc / MHz ---- -3. 818(3) ΔJK / k. Hz -0. 9673(4) -0. 9667(6) 0. 79(4) ΔJ / k. Hz 0. 2148(1) 0. 2147(1) 0. 25(1) ΔK / k. Hz 1. 3162(3) 1. 3153(5) -1. 79(1) δJ / k. Hz 0. 1001(1) 0. 10011(5) 0. 134(2) δK / k. Hz -0. 0974(1) -0. 0967(2) -0. 367(4) Gb / k. Hz ---- 4. 96(9) Gc / k. Hz ---- -5. 14(6) Gaab / k. Hz ---- -1. 14(6) Gaac / k. Hz ---- 3. 46(5) Gcca / k. Hz ---- 0. 67(1) e. Qqaa/MHz -0. 098(9) c c e. Qqbb/MHz -1. 498(9) c c e. Qqcc/MHz 1. 596(9) c c σRMS / k. Hz 1. 55 2. 8 2. 2 96 lines 8 par. 126 lines, 11 par. 137 line, 17 par. Lavrich, R. J. ; Plusquellic, D. F. ; Suenram, R. D. ; Fraser, G. T. ; Walker, A. R. H. ; Tubergen, M. J. , J. Chem. Phys. 2004, 118, 1253 -1265.
Lowest energy Conformers γLg+ 532 cm-1 δd(g+) 475 cm-1 βL(g-) 370 cm-1 (826 cm-1) βL(a) 112 cm-1 (724 cm-1) B 3 LYP/6 -31 G(d, p) ZPE corr. * MP 2 ZPE corr. cc-vdz βL(g+) *Gerhards, M. and Unterberg, C. ; Phys. Chem. Phys. 2002, 4, 1760 -1765. 0 cm-1
Experiment vs. Theory βL(g+) T 2 Exp-Calc. φ ψ T 1 χ1 χ2 Exp. B 3 LYP MP 2 6 -311++G** cc-vtz A / MHz 571. 8629 -0. 86 -38. 7 -6. 4 B / MHz 480. 5835 36 14 -17 C / MHz 309. 1644 15. 4 -7 -10 V 3 /cm-1 433 (5) 130 -36 (15) -7 θa 53(3) -12 8 10 θb 46(5) 10 -11 -13 θc 66(2) 2 3 4 V 3 /cm-1 46. 39(5) -69 -8 (12) -16 θa 62. 59(8) 0. 5 2. 8 3. 5 θb 56. 7(1) 1. 9 1. 7 -0. 3 θc 45. 7(1) -2. 1 -3. 8 -1. 3 T 1 T 2
Experiment vs. Theory Exp-Calc. Exp. MP 2 optimized cc-vtz Geometry A / MHz 571. 8629 -6. 4 -0. 09 B / MHz 480. 5835 -17 -0. 075 C / MHz 309. 1644 -10 1. 04 θa 53(3) 10 2 θb 46(5) -13 3 θc 66(2) 4 3 T 1 T 2 θa 62. 59(8) 3. 5 0 θb 56. 7(1) -0. 3 0 θc 45. 7(1) -1. 3 0 Chi squared analysis: 9 observables 5 variables 4 dihedrals: ψ, φ, χ1, χ2 Ring to backbone angle: A T 2 φ χ1 ψ T 1 A χ2
Chi Squared Error Surface MP 2 -Opt T 2 φ ψ T 1 χ1 χ2 MP 2/cc-vtz DFT-Opt DFT φ --171(4) -168 -155(10) -153 ψ 173(10) 175 183(1) 173 χ1 χ 64(8) 60 57(6) 63 2 -98(4) -87 -119(9) -85 A 117(4) 111 108(3) 115 Chi 2 27 1043
Conclusions Demonstration of a low and high Q Semi-Confocal Chirped-Pulse FTMW spectrometer 1. Low Q mode Rapid scan to locate and optimize signal 2. High Q mode increased sensitivity Demonstrated sensitivity for measuring the dipeptide analogue N-Ac-Phe-OMe The microwave spectra of Ac-Phe-OMe has been fit. – The AA, AE, and EA states of a single conformer of have been assigned Barriers to internal rotation are – T 1 V 3= 432(5) cm-1 – T 2 V 3= 46. 42(4) cm-1 – From analysis of the methyl top angles the peptide backbone (Ramachandran angles) and side chain have been determined
Acknowledgements The Pate Lab – Justin L. Neil – Dr. Steven T. Shipman Dr. Richard Suenram Dr. Gordon G. Brown National Research Council
Full calibration range
Large vs. Small Aperture Setup 200 μs record length AA AE Q ~ 200 Q ~ 9000 AE 250 avgs 2500 avgs 20 μs record length EA
30 MHz step size (could be more like 60 or 90) 30 or 20 min / 5 GHz 20 microsecond data
30 MHz step size Section of Suprane Scan Each color is a single step
Section of Suprane Scan Step Size 120 MHz 90 MHz 60 MHz 30 MHz