Taiwan Economy LECTURER JACK WU JACKWUNCCU EDU TW

? Ranking Country 1 USA 11 Canada 21 Iran")
 Country GDP/per capita Luxembourg 103187 Ireland 48940")
 world ranking 2014 Country PPP Qatar 137162 USA 54370 Canada")
 (Asia Pacific) Nominal PPP Singapore 53224 83066 Australia 51642 46550")


 Gini Coefficient Debt ratio Singapore 48 111.")


 KMT brought 2 million mainlanders (human capital)")


 Country(area) Number Rank Amount Rank Hong Kong 269555 1 279.")

- Slides: 21
Taiwan Economy LECTURER: JACK WU JACKWU@NCCU. EDU. TW 吳文傑
How big is Taiwan’s Economy (GDP)? Ranking Country 1 USA 11 Canada 21 Iran 2 China 12 Australia 22 Sweden 3 Japan 13 Spain 23 Norway 4 Germany 14 Mexico 24 Poland 5 France 15 Korea 25 Belgium 6 UK 16 Indonesia 26 Argentina 7 Brazil 17 Turkey 27 Taiwan 8 Russia 18 Netherlands 28 Austria 9 Italy 19 Saudi Arabia 29 South Africa 10 India 20 Switzerland 30 UAE
The Ranking of GDP per capita (2014) Country GDP/per capita Luxembourg 103187 Ireland 48940 Israel 35702 Switzerland 82178 Netherlands 44333 UAE 35392 Qatar 78829 UK 44118 Japan 32481 Norway 76266 Canada 43935 Kuwait 29983 USA 55904 Austria 43547 Italy 29847 Singapore 53224 Finland 42159 Brunei 27759 Australia 51642 HK 42097 Korea 27513 Denmark 51424 Germany 41267 Spain 26327 Iceland 51068 Belgium 40456 Bahamas 24394 San Marino 49139 France 37728 Bahrain 23899 Sweden 48966 New Zealand 36963 Taiwan 22083
GDP Per Capita (PPP) world ranking 2014 Country PPP Qatar 137162 USA 54370 Canada 44967 Luxembourg 97639 Saudi Arabia 52311 Denmark 44625 Singapore 83066 Ireland 51284 Iceland 44029 Brunei 79890 Bahrain 49020 Oman 43847 Kuwait 70686 Netherlands 47960 Belgium 43139 Norway 67166 Austria 46640 Finland 40661 UAE 66347 Australia 46550 France 40538 San Marino 60887 Sweden 46219 UK 39826 Switzerland 58149 Germany 46216 Japan 37519 HK 55097 Taiwan 46036 Korea 35379
GDP per capita (2014) (Asia Pacific) Nominal PPP Singapore 53224 83066 Australia 51642 46550 HK 42097 55097 New Zealand 36963 35305 Japan 32481 37519 Korea 27513 35379 Taiwan 22083 46036 Malaysia 10073 25145 China 8280 13224 Thailand 5426 15579 Indonesia 3412 10651
The Most Wealthiest Countries by Global Finance Magazine 1. Qatar 11. Canada 21. Belgium 2. Luxembourg 12. Austria 22. Japan 3. Singapore 13. Ireland 23. UK 4. Norway 14. Netherlands 24. Finland 5. Brunei 15. Sweden 25. France 6. Hong Kong 16. Iceland 26. Korea 7. USA 17. Taiwan 27. Israel 8. UAE 18. Germany 28. Saudi Arabia 9. Switzerland 19. Kuwait 29. Bahamas 10. Australia 20. Denmark 30. New Zeland
Credit Suisse Ranking of Net Wealth of Middle Class 1. Australia 11. Austria 21 Arab Emirates 2. Luxembourg 12. Canada 22. Taiwan 3. Japan 13. France 23. Germany 4. Italy 14. Norway 24. Sweden 5. Belgium 15. Finland 25. Cyprus 6. UK 1 16. New Zealand 26. Kuwait 7. UK 2 17. Netherlands 27. USA 8. Iceland 18. Ireland 9. Singapore 19. Qater 10. Switzerland 20. Spain
Global Competitiveness Index 1 -10 11 -20 21 -30 Switzerland Norway Australia Singapore Taiwan Luxembourg Finland Qatar France Germany Canada Malaysia USA Denmark Korea Sweden Austria Brunei Hong Kong Belgium Israel Netherlands New Zealand Ireland Japan United Arab Emirates China UK Saudi Arabia Puerto Rico
Income Distribution and Government Debt (Asia Pacific) Gini Coefficient Debt ratio Singapore 48 111. 4 Japan 38 214. 3 Hong Kong 53 30 South Korea 31 33. 7 Taiwan 34 36 Malaysia 46 55 China 47 31. 7 Thailand 40 43. 3 Australia 30 29 New Zealand 36 41. 8
Top Export Countries Ranking Country 1 China 11 Italy 2 USA 12 Canada 3 Germany 13 Spain 4 Japan 14 Singapore 5 France 15 Saudi Arabia 6 Korea 16 Mexico 7 Netherlands 17 UAE 8 Russia 18 India 9 HK 19 Switzerland 10 UK 20 Taiwan
Top Import Countries Ranking Country 1 USA 11 Netherlands 2 China 12 Italy 3 Germany 13 Thailand 4 Japan 14 Mexico 5 UK 15 Russia 6 France 16 Spain 7 Korea 17 Belgium 8 India 18 Switzerland 9 HK 19 Taiwan 10 Canada 20 Australia
Which Ones are Taiwanese Companies? Foxconn Hon Hai TSMC Formosa Plastic Co. HTC ACER ASUS Trend Micro MASTER KONG WANT-WANT GIANT SYNNEX MAXXIS 85 C ADVANTECH MERIDA D-LINK UNI-PRESIDENT ZYXEL JOHNSON CYBERLINK TRANSCEND DELTA WOWPRIME
Major Economic Indicator of Taiwan Average GDP CPI Average. CPI Foreign GDP Per Unemployment Gini Year Growth reserve(billion Capita(US$) Rate(%) coefficient Rate(%) Rate(10 Rate(%) US$) year, %) 1970 393 11. 40 9. 4 1. 70 3. 60 3. 4 0. 294 1975 978 4. 90 2. 40 5. 20 0. 312 1980 2385 7. 80 9. 8 1. 23 19. 00 10. 4 0. 277 1985 3290 13. 50 2. 91 -0. 20 0. 290 225. 6 1990 8124 3. 80 7. 7 1. 67 4. 10 3. 1 0. 312 724. 4 1995 12918 6. 38 1. 79 3. 70 0. 317 903. 1 2000 14704 5. 80 6. 2 2. 99 1. 30 2. 6 0. 326 1067. 4 2001 13147 -1. 65 4. 57 -0. 01 0. 350 1222. 1 2002 13404 5. 26 5. 17 -0. 20 0. 345 1616. 6 2003 13773 3. 67 4. 99 -0. 28 0. 343 2066. 3 2004 15012 6. 19 4. 44 1. 62 0. 338 2417. 4 2005 16051 4. 70 4. 13 2. 30 0. 340 2532. 9 2006 16491 5. 44 3. 91 0. 60 0. 339 2661. 5 2007 17154 5. 98 3. 91 1. 80 0. 340 2703. 0 2008 17399 0. 73 4. 14 3. 53 0. 341 2917. 1 2009 16359 -1. 87 3. 2 5. 85 -0. 87 0. 9 0. 345 3482. 0 2010 18503 4. 72 5. 21 -0. 96 0. 342 3820. 1 2011 20006 4. 07 5. 39 1. 42 0. 342 3855. 5 2012 20386 1. 32 4. 24 1. 93 4031. 7 Source: Directorate-General of Budget, Accounting and Statistics, Statistic Abstract of National Income, Executive Yuan, Taiwan.
Before Takeoff Japanese Colonial Era (before 1945) KMT brought 2 million mainlanders (human capital) to Taiwan, 1949 U. S. Aid (1950 -1967)
Golden Years • Export expansion policy, Export Processing Zone, • • 1965 -80 Second import substitute policy, 1975 - 80 Ten Public Projects, 1974 -1979 High-tech industry, 1980 Financial liberalization, 1990 -
After Golden Years Open direct investment in China, 1990 Tension between Taiwan and China, 1996 -2001 Join World Trade Organization, 2002 Cross-strait Direct Flight, 2008 Sign ECFA with China, 2010 -
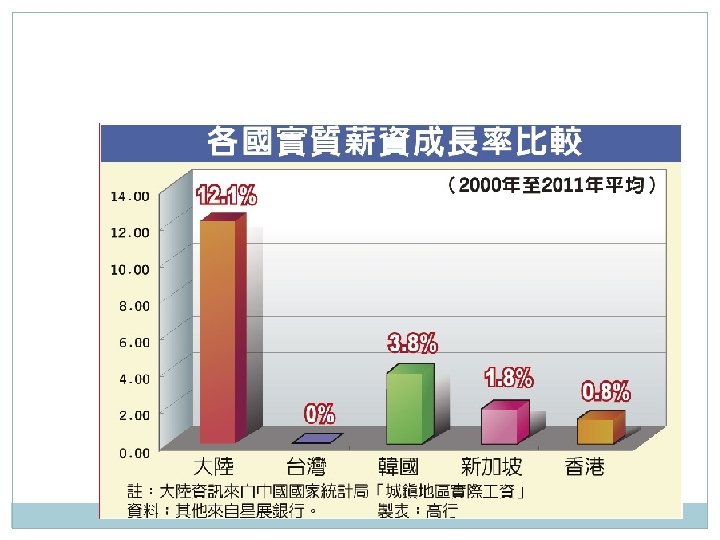
Current Economic Issues Sluggish wage growth Unequal income distribution High housing price Economic Reliance on China
19
China’s FDI Source (2006) Country(area) Number Rank Amount Rank Hong Kong 269555 1 279. 7 billion 1 Taiwan 71847 2 43. 8 billion 5 USA 52211 3 53. 9 billion 4 Korea 43130 4 34. 9 billion 6 Japan 37714 5 57. 9 billion 2 Virgin island 16616 6 57. 1 billion 3 Singapore 15556 7 30. 0 billion 7 Macau 10697 8 6. 9 billion 11 Canada 9788 9 5. 4 billion 12 UK 5359 10 13. 9 billion 8
Table 1 Bilateral Trade across the Strait 21