Supply Chain Financing Dr Dale S Rogers Nevada
- Slides: 30
Supply Chain Financing Dr. Dale S. Rogers Nevada Logistics Institute Reno, NV 13 August 2015 A. T. Kearney 82/7478 1
Overview n Strategic Supply Chain Financing • Supply chain financing defined • Fund the Growth • Working capital n Tactics • Supply chain finance – reverse factoring • E-Payables • Cash Conversion Cycle • Options 2 2
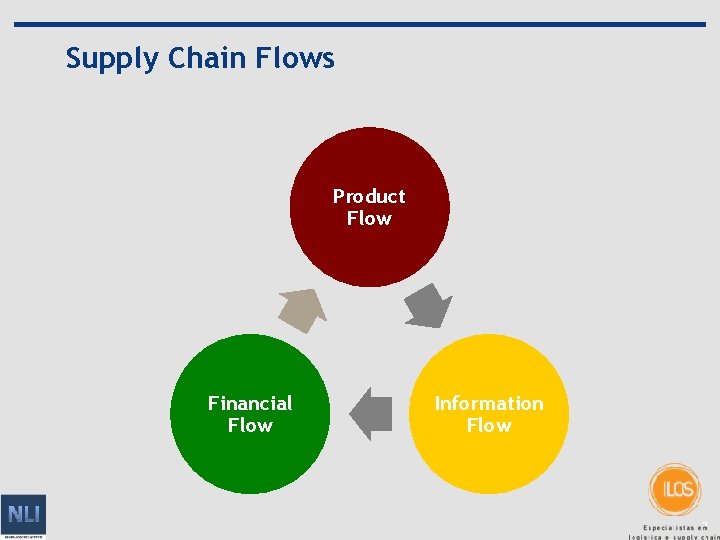
Supply Chain Flows Product Flow Financial Flow Information Flow 3
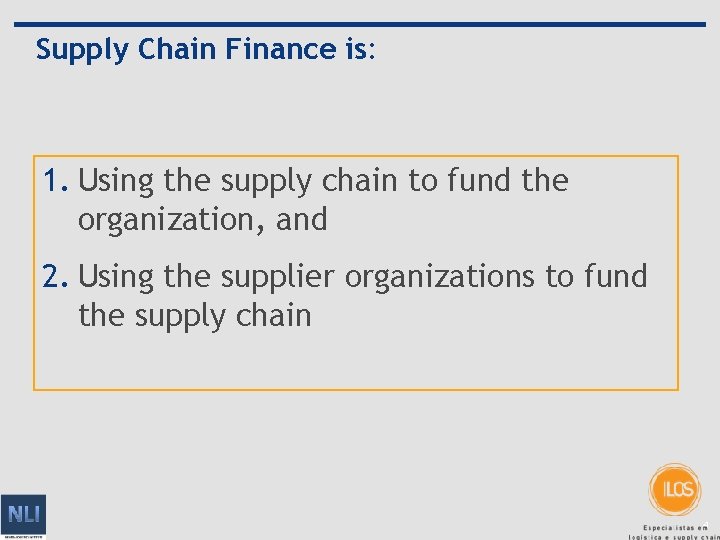
Supply Chain Finance is: 1. Using the supply chain to fund the organization, and 2. Using the supplier organizations to fund the supply chain 4
Supply Chain Financing Fund the Growth! 5 5
Fund the Growth n. Firms are looking to an efficient and effective supply chain to fund the growth of the company. n. Companies cannot only be dependent on revenues and financial management to grow profit. 6 6
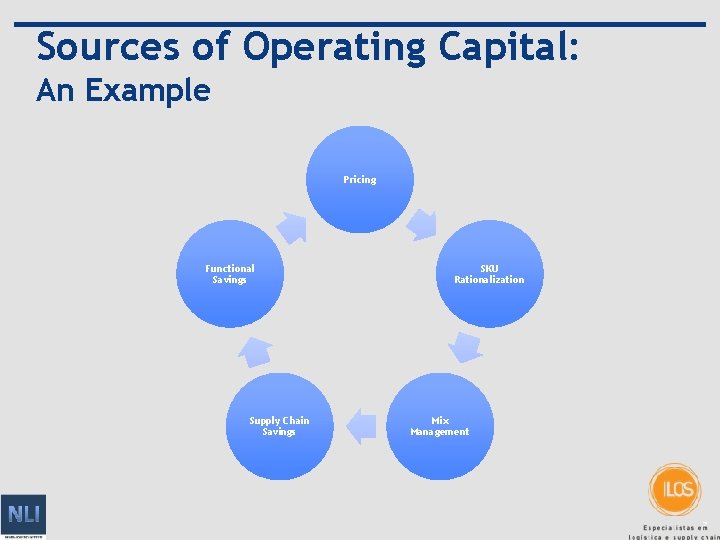
Sources of Operating Capital: An Example Pricing Functional Savings Supply Chain Savings SKU Rationalization Mix Management 7
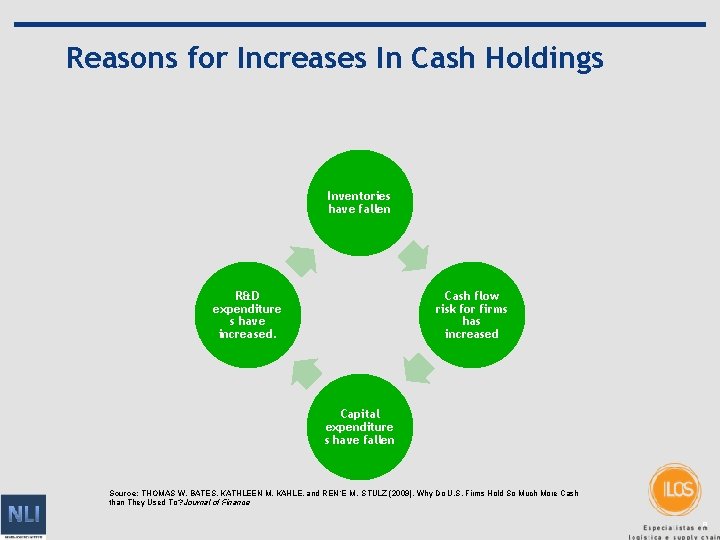
Reasons for Increases In Cash Holdings Inventories have fallen R&D expenditure s have increased. Cash flow risk for firms has increased Capital expenditure s have fallen Source: THOMAS W. BATES, KATHLEEN M. KAHLE, and REN´E M. STULZ (2009). Why Do U. S. Firms Hold So Much More Cash than They Used To? Journal of Finance 8
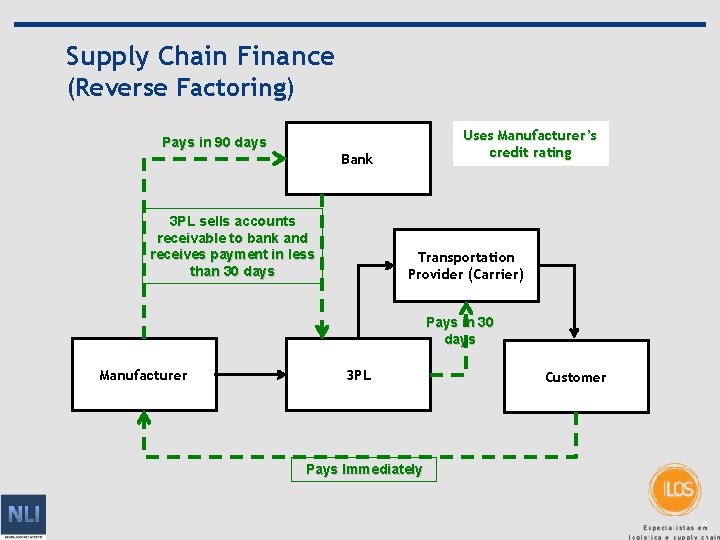
Supply Chain Finance (Reverse Factoring) Pays in 90 days Uses Manufacturer’s credit rating Bank 3 PL sells accounts receivable to bank and receives payment in less than 30 days Transportation Provider (Carrier) Pays in 30 days Manufacturer 3 PL Customer Pays Immediately 9
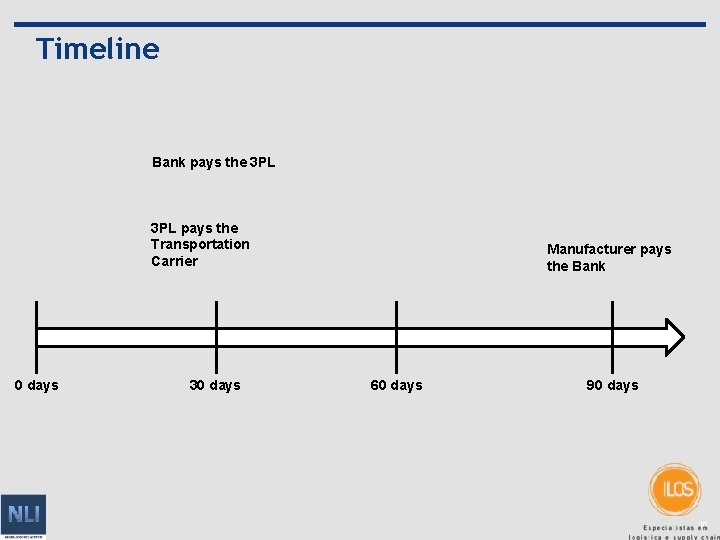
Timeline Bank pays the 3 PL pays the Transportation Carrier 0 days 30 days Manufacturer pays the Bank 60 days 90 days 10
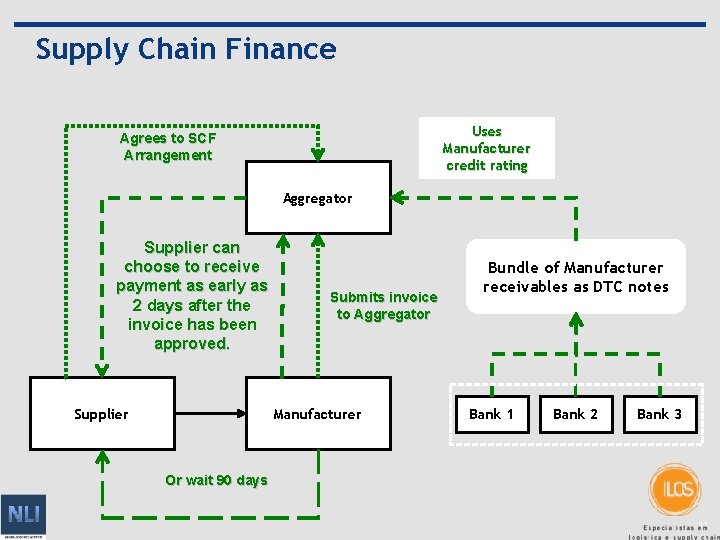
Supply Chain Finance Uses Manufacturer credit rating Agrees to SCF Arrangement Aggregator Supplier can choose to receive payment as early as 2 days after the invoice has been approved. Supplier Submits invoice to Aggregator Manufacturer Bundle of Manufacturer receivables as DTC notes Bank 1 Bank 2 Bank 3 Or wait 90 days 11
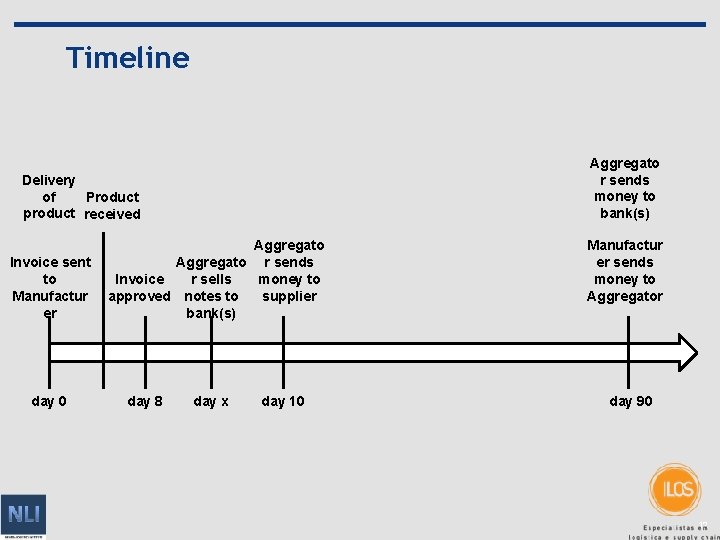
Timeline Aggregato r sends money to bank(s) Delivery of Product product received Invoice sent to Manufactur er day 0 Aggregato r sends money to r sells Invoice supplier approved notes to bank(s) day 8 day x day 10 Manufactur er sends money to Aggregator day 90 12
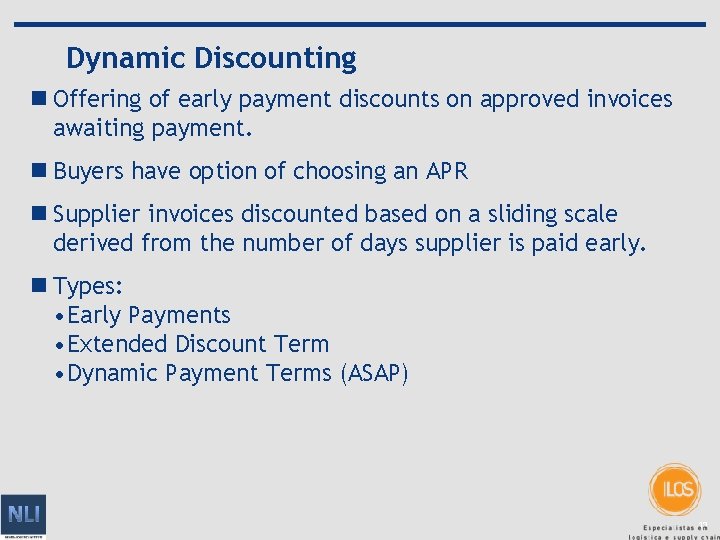
Dynamic Discounting n Offering of early payment discounts on approved invoices awaiting payment. n Buyers have option of choosing an APR n Supplier invoices discounted based on a sliding scale derived from the number of days supplier is paid early. n Types: • Early Payments • Extended Discount Term • Dynamic Payment Terms (ASAP) 13
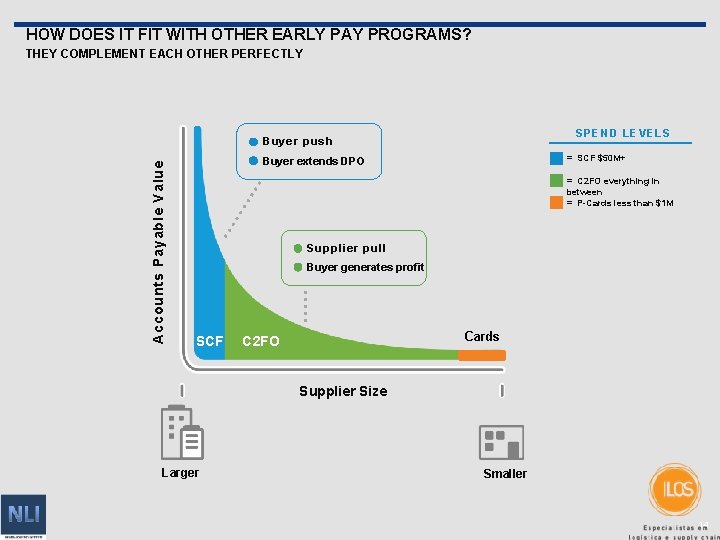
HOW DOES IT FIT WITH OTHER EARLY PAY PROGRAMS? THEY COMPLEMENT EACH OTHER PERFECTLY SPEND LEVELS Accounts Payable Value Buyer push = SCF $50 M+ Buyer extends DPO = C 2 FO everything in between = P-Cards less than $1 M Supplier pull Buyer generates profit SCF Cards C 2 FO Supplier Size Larger Smaller 14
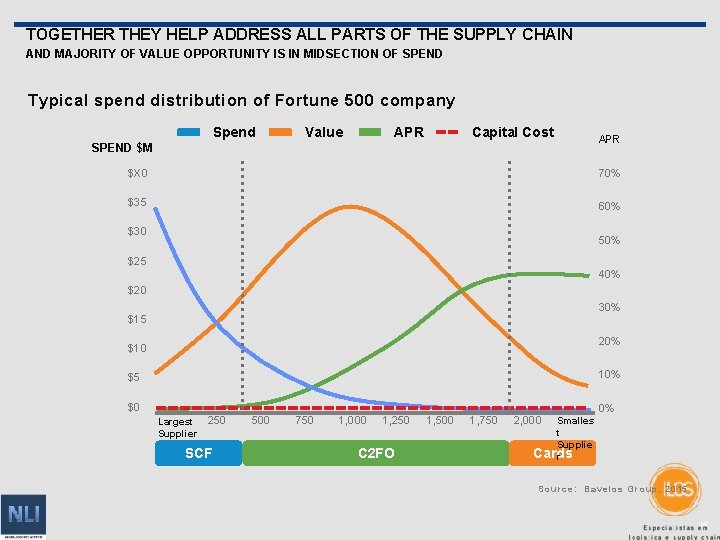
TOGETHER THEY HELP ADDRESS ALL PARTS OF THE SUPPLY CHAIN AND MAJORITY OF VALUE OPPORTUNITY IS IN MIDSECTION OF SPEND Typical spend distribution of Fortune 500 company Spend Value APR Capital Cost SPEND $M APR $X 0 70% $35 60% $30 50% $25 40% $20 30% $15 20% $10 10% $5 $0 Largest Supplier 250 SCF 500 750 1, 000 1, 250 C 2 FO 1, 500 1, 750 2, 000 0% Smalles t Supplie Cards r Source: Bavelos Group, 2015 15
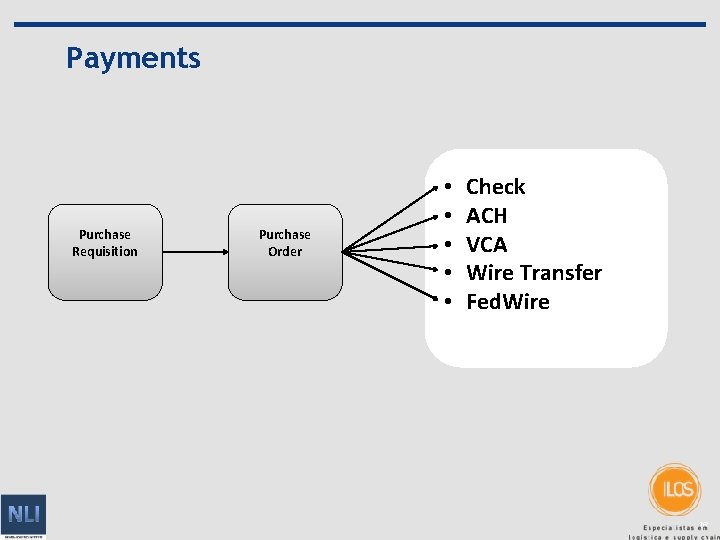
Payments Purchase Requisition Purchase Order • • • Check ACH VCA Wire Transfer Fed. Wire 16
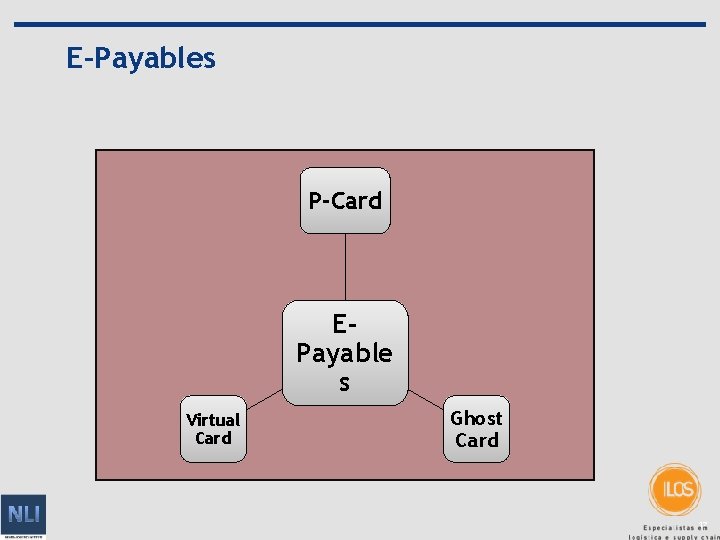
E-Payables P-Card EPayable s Virtual Card Ghost Card 17
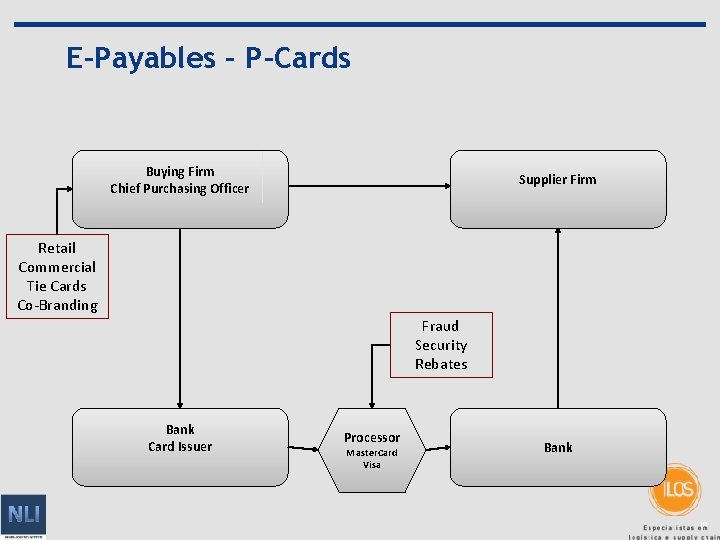
E-Payables – P-Cards Buying Firm Chief Purchasing Officer Supplier Firm Retail Commercial Tie Cards Co-Branding Fraud Security Rebates Bank Card Issuer Processor Master. Card Visa Bank 18
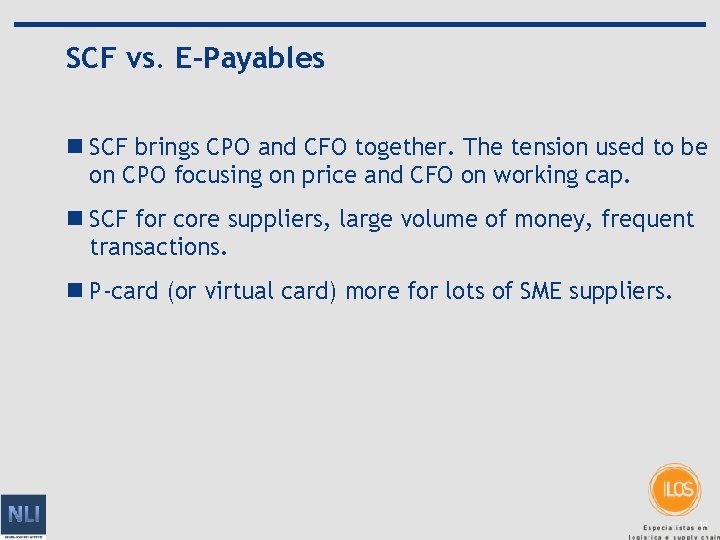
SCF vs. E-Payables n SCF brings CPO and CFO together. The tension used to be on CPO focusing on price and CFO on working cap. n SCF for core suppliers, large volume of money, frequent transactions. n P-card (or virtual card) more for lots of SME suppliers. 19
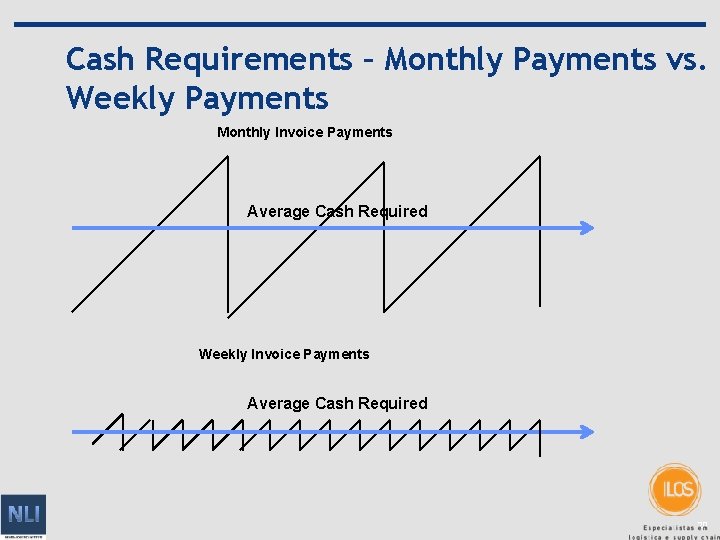
Cash Requirements – Monthly Payments vs. Weekly Payments Monthly Invoice Payments Average Cash Required Weekly Invoice Payments Average Cash Required 20
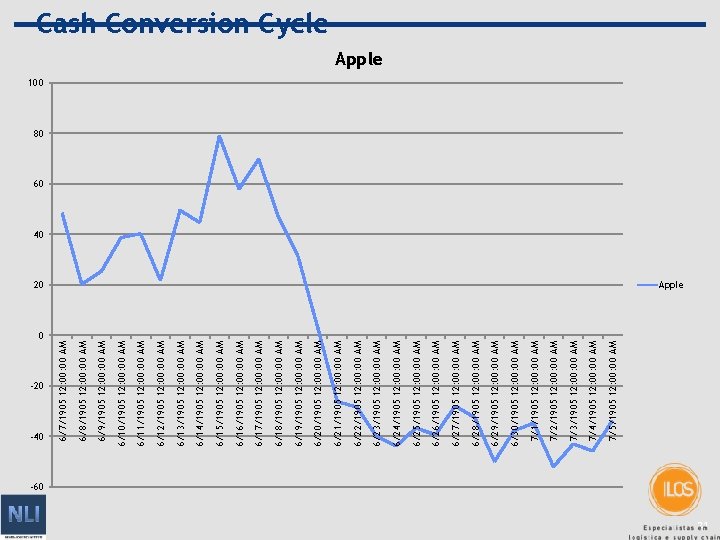
-20 -40 7/5/1905 12: 00 AM 7/4/1905 12: 00 AM 7/3/1905 12: 00 AM 7/2/1905 12: 00 AM 7/1/1905 12: 00 AM 6/30/1905 12: 00 AM 6/29/1905 12: 00 AM 6/28/1905 12: 00 AM 6/27/1905 12: 00 AM 6/26/1905 12: 00 AM 6/25/1905 12: 00 AM 6/24/1905 12: 00 AM 6/23/1905 12: 00 AM 6/22/1905 12: 00 AM 6/21/1905 12: 00 AM 6/20/1905 12: 00 AM 6/19/1905 12: 00 AM 6/18/1905 12: 00 AM 6/17/1905 12: 00 AM 6/16/1905 12: 00 AM 6/15/1905 12: 00 AM 6/14/1905 12: 00 AM 6/13/1905 12: 00 AM 6/12/1905 12: 00 AM 6/11/1905 12: 00 AM 6/10/1905 12: 00 AM 6/9/1905 12: 00 AM 6/8/1905 12: 00 AM 6/7/1905 12: 00 AM Cash Conversion Cycle Apple 100 80 60 40 20 Apple 0 -60 21
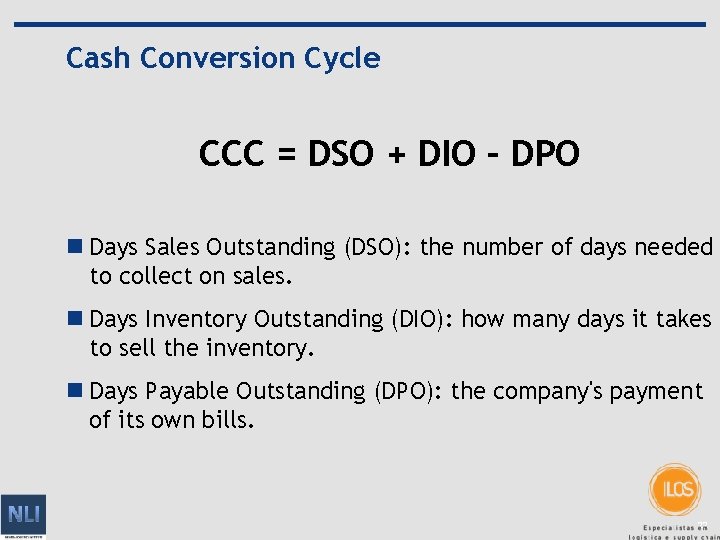
Cash Conversion Cycle CCC = DSO + DIO – DPO n Days Sales Outstanding (DSO): the number of days needed to collect on sales. n Days Inventory Outstanding (DIO): how many days it takes to sell the inventory. n Days Payable Outstanding (DPO): the company's payment of its own bills. 22
Selected CAPS Firms 2014 CCC 23
Further Explanation n http: //financing. supply 24
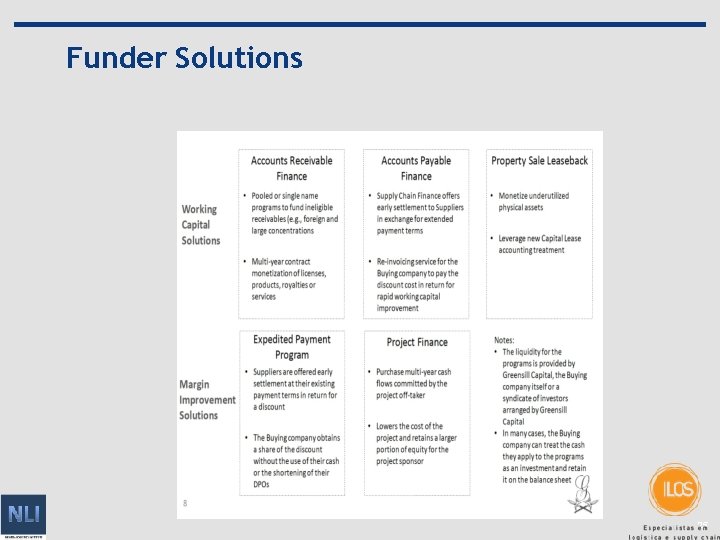
Funder Solutions 25
End Of Presentation Extra slides follow 26
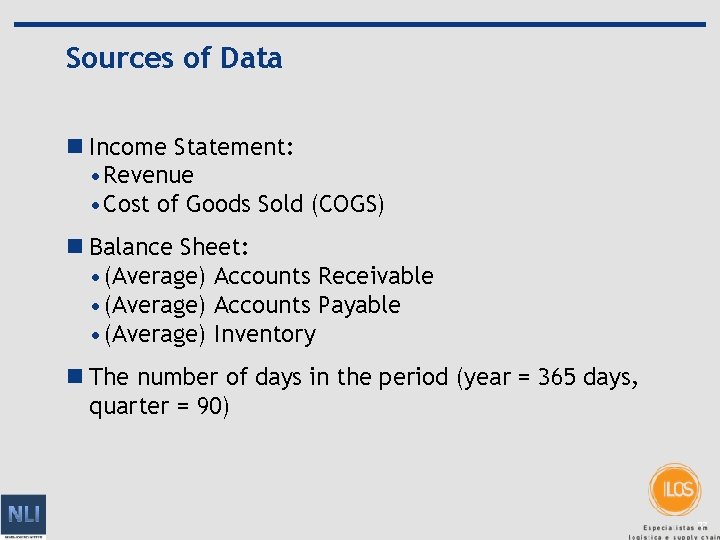
Sources of Data n Income Statement: • Revenue • Cost of Goods Sold (COGS) n Balance Sheet: • (Average) Accounts Receivable • (Average) Accounts Payable • (Average) Inventory n The number of days in the period (year = 365 days, quarter = 90) 27
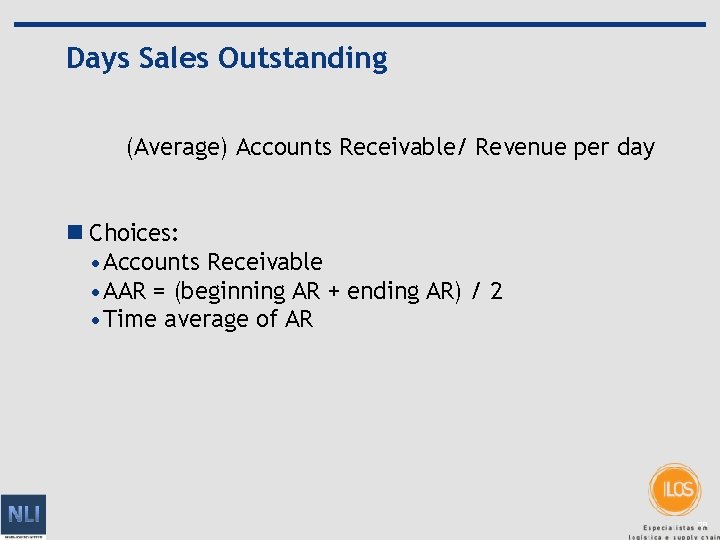
Days Sales Outstanding (Average) Accounts Receivable/ Revenue per day n Choices: • Accounts Receivable • AAR = (beginning AR + ending AR) / 2 • Time average of AR 28
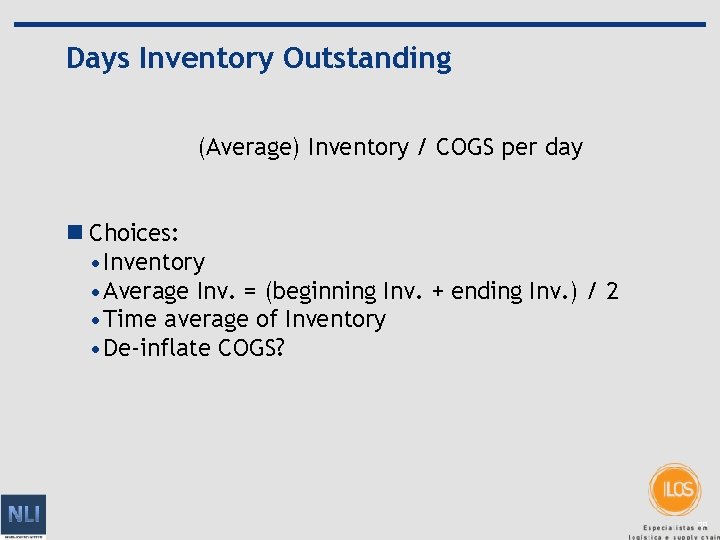
Days Inventory Outstanding (Average) Inventory / COGS per day n Choices: • Inventory • Average Inv. = (beginning Inv. + ending Inv. ) / 2 • Time average of Inventory • De-inflate COGS? 29
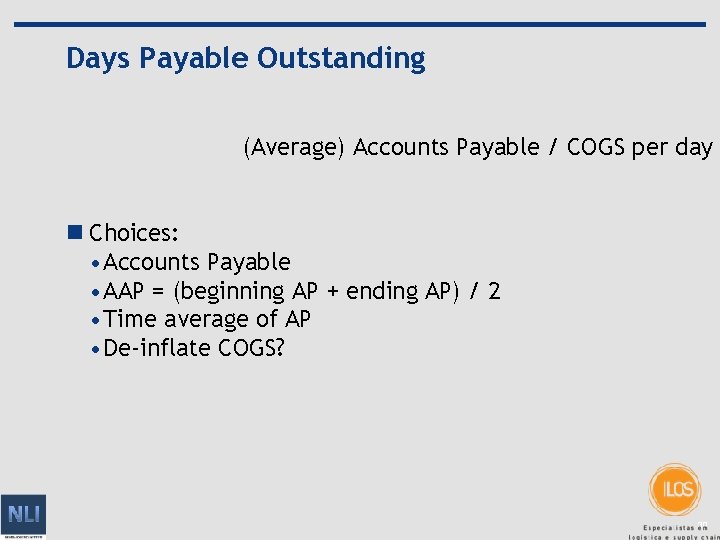
Days Payable Outstanding (Average) Accounts Payable / COGS per day n Choices: • Accounts Payable • AAP = (beginning AP + ending AP) / 2 • Time average of AP • De-inflate COGS? 30