Supply Chain Management Supply Chain The sequence of


 n The strategic coordination of the supply chain for the")


 n 2. Mill (flour) n 3. equipment,")


/365 = (2000*10)(5 -2)/365 = 164. 38 <")


 Analysis Fixed costs are constant for the range of")

 –")
 Variable cost per unit")


 Variable cost per unit")


- Slides: 51
Supply Chain Management
Supply Chain The sequence of organizations - their facilities, functions, and activities - that are involved in producing and delivering a product or service. Supply chain connects suppliers, producers and final customers together in a tework that is essential to the creation and delivery of goods and services. (Value chains are the chain of activities and functions WITHIN a single organization. )
Benefits of Supply Chain Management Lower inventories n Higher productivity n Greater agility n Shorter lead times n Higher profits n Greater customer loyalty n
Supply Chain Management (SCM) n The strategic coordination of the supply chain for the purpose of intergating supply and demand management.
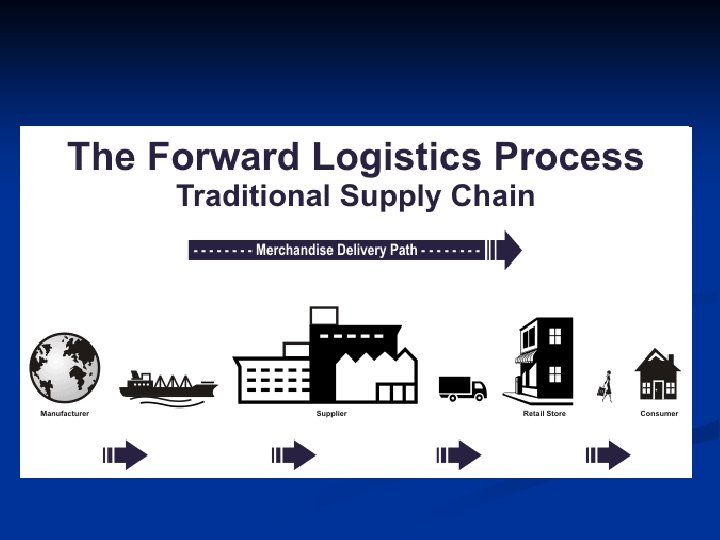
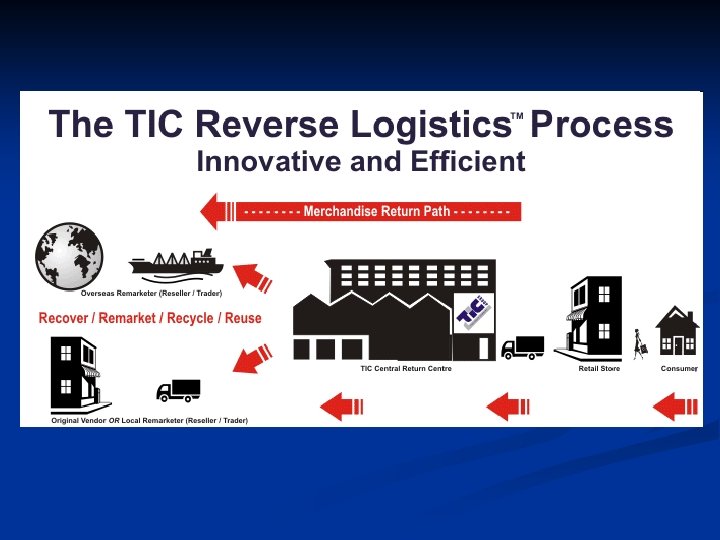
Logistics n The part of a supply chain involved with the forward and reverse flow of goods, services, cash and information. Movement within the facility n Incoming and outgoing shipments n Distribution n
Facilities Warehouses n Factories n Processing centers n Distribution centers n Retail outlets n Offices n … n
Functions and Activities Forecasting n Purchasing n Inventory management n Information management n Quality assurance n Scheduling n Production and delivery n Customer service n
Key issues of SCM Determinate the appropriate level of outsourcing n Managing procurement n Managing suppliers n Managing customer relationships n Being able to quickly identify and respond to problems n Managing risks and uncertainty n
Typical Supply Chains Production Distribution Purchasing Receiving Storage Operations Storage
Typical Supply Chain for a Manufacturer Supplier } Storage Mfg. Storage Dist. Retailer Customer
A farm-to-market supply chain 1. Farm (wheat) n 2. Mill (flour) n 3. equipment, repair, energy Bakery (bread) n 4. Suppliers: equipment, repair, feed, seed, fertilizer, pesticides, energy/fuel equipment, repair, energy, other ingredients Supermarket (bread sold to the final customer) T r a n s p o r t
Typical Supply Chain for a Service Supplier } Storage Service Customer
Supply chain and Cash flow Goods and services Cash flow Reverse logistics Suppliers Consumers Marketing Design Customers Production Logistics
Elements of Supply Chain Management Element Typical Issues Customers Determining what customers want Forecasting Predicting quantity and timing of demand Design Incorporating customer wants, mfg. , and time Processing Controlling quality, scheduling work Inventory Meeting demand while managing inventory costs Purchasing Evaluating suppliers and supporting operations Suppliers Monitoring supplier quality, delivery, and relations Location Determining location of facilities Logistics Deciding how to best move and store materials
Global supply chains Product design n Products sold globally n Outsourcing to low labor cost countries n n Difficulties: language, culture, currency fluctuations, increased tratnsportation costs and lead time, increased need for trust
PROCUREMENT n n Purchasing is responsible for obtaining the materials, parts, and supplies and services needed to produce a product or provide a service. Goal: to develop and implement purchasing plans for products and services that support operations strategies. Duties: n Identifying sources of supply n Negotiating contracts n Maintaining a database of suppliers n Obtaining goods and services n Managing supplies Purchasing cycle: series of steps that begin with a request for purchase and end with notification of shipment recieved in satisfactory condition.
Purchasing Cycle Legal 1. Requisition received 2. Supplier selected 3. Order is placed 4. Monitor orders Operations Accounting Purchasing Data processing Design 5. Receive orders Suppliers Receiving
Centralized vs. decentralized purchasing n Centralized purchasing n Purchasing is handled by one special department n Lower prices, better service and closer attention from suppliers, employing specialists n Decentralized purchasing n Individual departments or separate locations handle their own purchasing requirements n Aware to different local needs, quicker response
Trade-offs 1. Lot-size vs. inventory n Bullwhip 2. effect Inventory vs. transportation costs (reducing average costs) n Cross-docking 3. Lead time vs. transportation costs 4. Product variety vs. inventory n Delayed 5. differentiation Cost vs. customer service n Disintermediation
Trade-offs n Bullwhip effect n Demand variations begin at the customer end of the chain and become increasingly large as they radiate backwards through the chain. n Inventories are progressively larger moving backward through the supply chain.
Bullwhip Effect Demand Final customer Initial supplier Backward effect
Bullwhip Effect = Amount of inventory Tier 2 Tier 1 Final Producer Distributor Retailer Suppliers Customer
Trade-offs n Cross-docking Goods arriving at a warehouse from a supplier are unloaded from the supplier’s truck and loaded immediately onto outbound trucks. Avoids warehouse storage. Reduces holding costs and lead times.
Trade-offs n Delayed differentiation n n Production of standard components and subassemblies, which are held until late in the process to add differentiating features (expl. automobiles produced without extras) Disintermediation n Reducing one or more steps in a supply chain by cutting out one or more intermediaries.
Supply Chain Benefits and Drawbacks Problem Potential Improvement Benefits Possible Drawbacks Large inventories Smaller, more frequent deliveries Reduced holding costs Traffic congestion Increased costs Long lead times Delayed differentiation Disintermediation Quick response May not be feasible May need absorb functions Large number of parts Modular Fewer parts Simpler ordering Less variety in final products Cost Quality Outsourcing Reduced cost, higher quality Loss of control (even on quality) Variability Shorter lead times, better forecasts Able to match supply and demand Less variety
Successful Supply Chain n Trust among trading partners n Effective communications n Supply chain visibility n Event-management capability n n The ability to detect and respond to unplanned events (uncertainty) Performance metrics
LOGISTICS n The movement of materials, services, cash, and information in a supply chain. Movement within a facility n Incoming and outgoing shipments (traffic managemment) n
Movement within a facility n n n n From incoming vehicles to receiving From receiving to storage From storage to work centres Between work centres (or temporary storages) From operations to final storage From storage to packing/shipping From shipping to outgoing vehicles
Location planning
Nature of Location Decisions n Strategic Importance Long term commitment/costs n Impact on investments, revenues, and operations n Supply chains n n Objectives Profit potential n No single location may be better than others n Identify several locations from which to choose n n Options Expand existing facilities n Add new facilities n Move n
Making Location Decisions Decide on the criteria n Identify the important factors n Develop location alternatives n Evaluate the alternatives n Make selection n
Location Decision Factors Regional Factors Multiple Plant Strategies Community Considerations Site-related Factors
Seminar
Problem solving in logistics Evaluating shipping alternatives
Additional examples
n Example 1: n n Solutions H(d)/365 = (2000*10)(5 -2)/365 = 164. 38 < 135 Use the 2 days freight. Example 2: n Between overnight and 2 -days freights: n n Between 2 -days and 6 -days freights: n n H(d)/365 = (200*0. 3*80)(1)/365 = 13. 15 Price difference between frights: 300 -260 = 40 The 2 -days freight is better than the overnight-freight [13. 15 < 40]. H(d)/365 = (200*0. 3*80)(4)/365 = 52. 60 Price difference between frights: 260 -180 = 80 The 6 -days freight is better than the 2 -days-freight [52. 60<(260 -180)]. The best choice is the 6 -days freight.
Problem solving in Location Planning with CPV Analysis
Locational Cost-Profit-Volume Analysis • • Numerical and graphical analysis are both feasible. We focus on the graphical one. The steps: 1. 2. 3. Determine the fixed and variable costs for each location Plot the total-cost lines for all location alternatives on the same graph Determine which location will have the lowest total cost for the expected level of output. Alternatively, determine which location will have the highest profit.
Assumptions of the Cost-Profit-Volume (CPV) Analysis Fixed costs are constant for the range of probable output n Variable costs are linear for the range of probable output n The required level of output can be closely estimated n Only one product is involved n
The total cost curve TC = FC + VC = FC + v*Q Cost n t s o lc C V = ta o T C F + le b ia ) C V ( t s co r a lv Fixed cost (FC) 0 Q (volume in units)
Alternatively, the total profit is n TP = Q * (R – v) – FC
A simple problem from the textbook Location Fixed cost (FC) Variable cost per unit (v) A 250, 000 11 B 100, 000 30 C 150, 000 20 D 200, 000 35
Plotting the total-cost lines
Calculate the break-even output levels For the crossing of lines B and C: 100, 000 + 30*Q = 150, 000 + 20*Q Q = 5, 000 n For the crossing of lines C and A: 150, 000 + 20*Q = 250, 000 + 11*Q Q = 11, 111 n
Which location is the best? The expected long-term volume Best location > 11, 111 A 5, 000 < Exp. vol. < 11, 111 C < 5, 000 B
Another problem for the same method Location Fixed cost (FC) Variable cost per unit (v) A 10000 30 B 20000 20 C 35000 15 D 25000 40
Solution: Step 1: The plot
Solution: Step 2 For the crossing of lines A and B: 10, 000 + 30*Q = 20, 000 + 20*Q Q = 1, 000 n For the crossing of lines B and C: 20, 000 + 20*Q = 35, 000 + 15*Q Q = 3, 000 n Conclusion: if the volume is below 1, 000 units, then we have to choose location A; with a volume between 1, 000 and 3, 000 B is the best alternative; while volumes greater than 3, 000 requires C to n
THANK YOU FOR YOUR ATTENTION!