Studies on n and ptype MCz and FZ





- Slides: 42
Studies on n and p-type MCz and FZ structures of the SMART Collaboration irradiated at fluences from 1. 0 E+14 to 5. 6 E+15 p cm-2 L. Borrello, A. Messineo, G. Segneri, D. Sentenac Università di Pisa & INFN Pisa A. Macchiolo Università di Firenze & INFN Firenze SMART Collaboration RD 50 Trento Workshop ITC-IRST 28/02/2005 -01/03/2005
Overview • The SMART run I and II: layout and material • Pre-irradiation measurements • Irradiation fluences and layout • Experimental set-up • Results on diodes and mini. sensor for n and p-type MCz and Fz at f = 1. 0 and 4. 4 E+14 p cm-2 • Results at f=5. 5 E+15 p cm-2
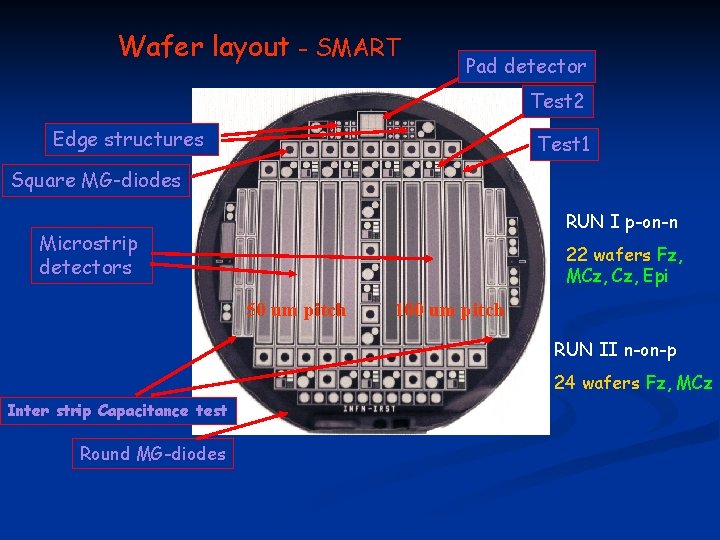
Wafer layout - SMART Pad detector Test 2 Edge structures Test 1 Square MG-diodes RUN I p-on-n Microstrip detectors 22 wafers Fz, MCz, Epi 50 um pitch 100 um pitch RUN II n-on-p 24 wafers Fz, MCz Inter strip Capacitance test Round MG-diodes
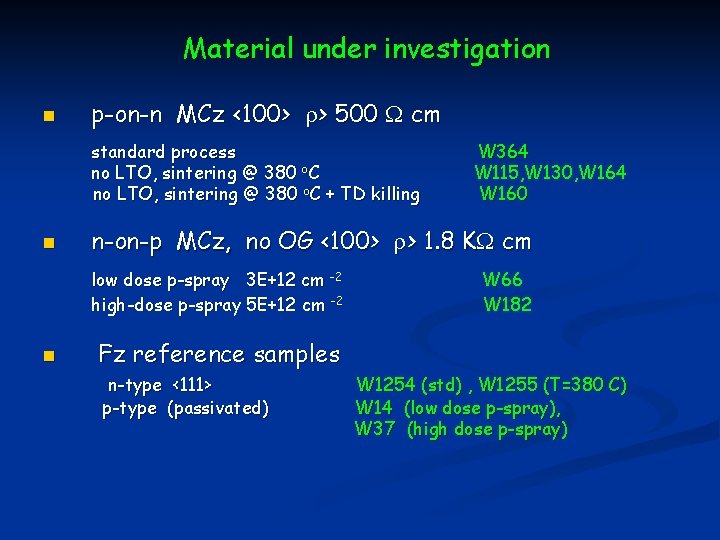
Material under investigation n p-on-n MCz <100> r> 500 W cm standard process no LTO, sintering @ 380 o. C + TD killing n n-on-p MCz, no OG <100> r> 1. 8 KW cm low dose p-spray 3 E+12 cm -2 high-dose p-spray 5 E+12 cm -2 n W 364 W 115, W 130, W 164 W 160 W 66 W 182 Fz reference samples n-type <111> p-type (passivated) W 1254 (std) , W 1255 (T=380 C) W 14 (low dose p-spray), W 37 (high dose p-spray)
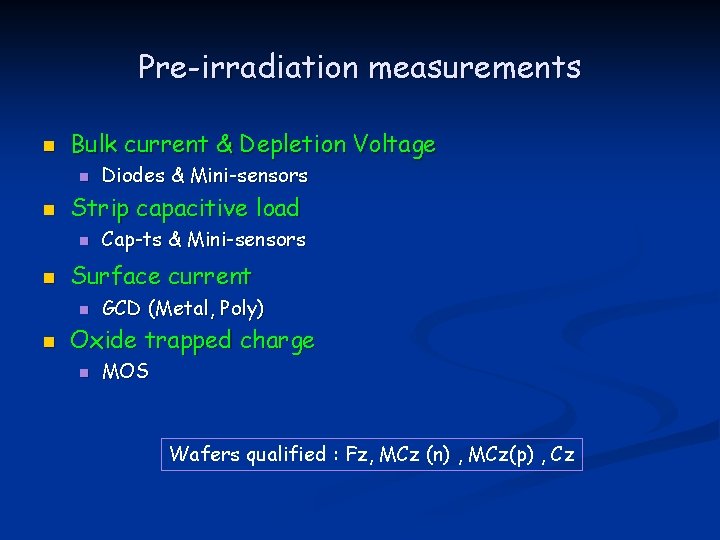
Pre-irradiation measurements n Bulk current & Depletion Voltage n n Strip capacitive load n n Cap-ts & Mini-sensors Surface current n n Diodes & Mini-sensors GCD (Metal, Poly) Oxide trapped charge n MOS Wafers qualified : Fz, MCz (n) , MCz(p) , Cz
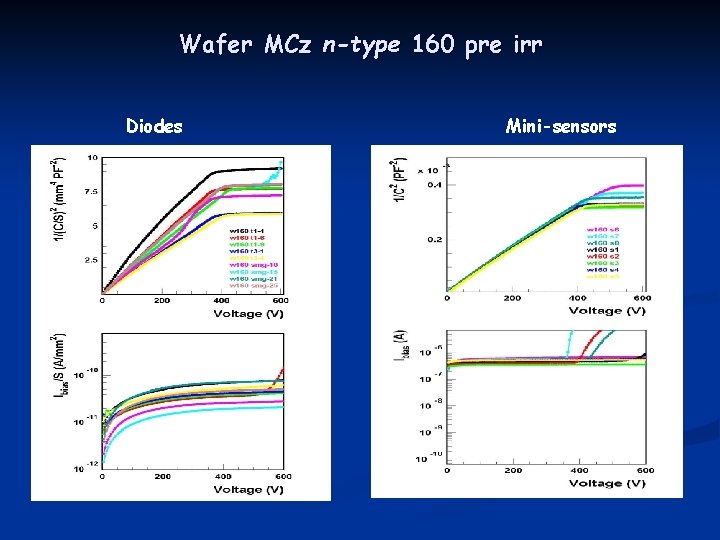
Wafer MCz n-type 160 pre irr Diodes Mini-sensors
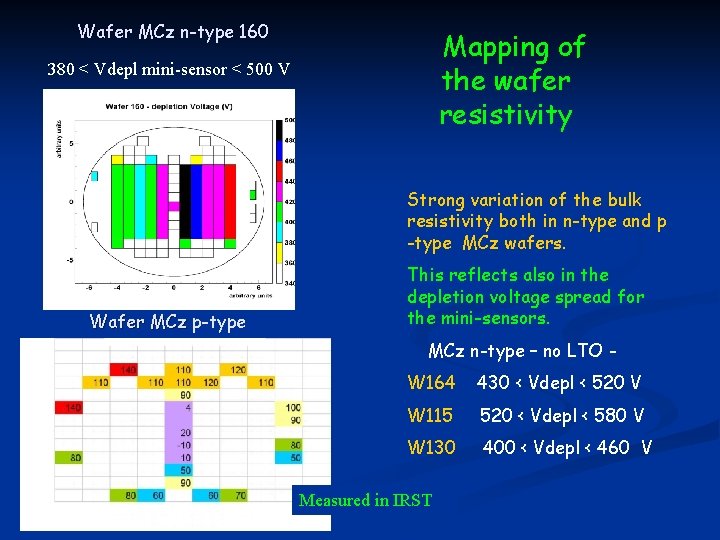
Wafer MCz n-type 160 Mapping of the wafer resistivity 380 < Vdepl mini-sensor < 500 V Strong variation of the bulk resistivity both in n-type and p -type MCz wafers. Wafer MCz p-type This reflects also in the depletion voltage spread for the mini-sensors. MCz n-type – no LTO W 164 430 < Vdepl < 520 V W 115 520 < Vdepl < 580 V W 130 400 < Vdepl < 460 V Measured in IRST
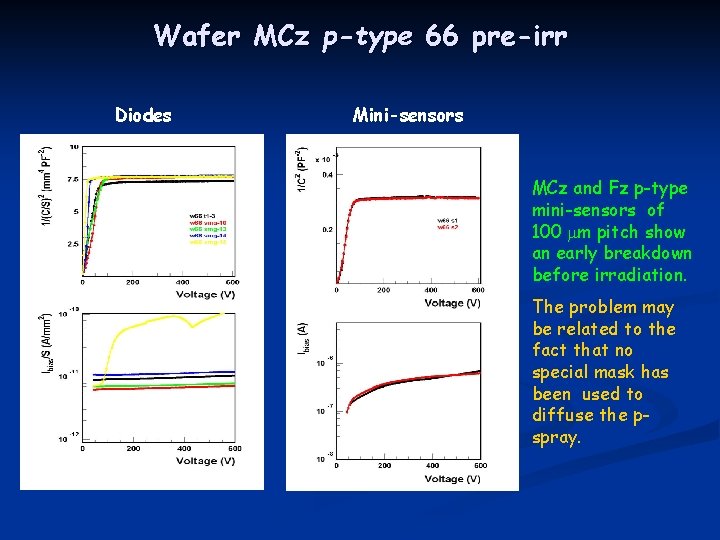
Wafer MCz p-type 66 pre-irr Diodes Mini-sensors MCz and Fz p-type mini-sensors of 100 mm pitch show an early breakdown before irradiation. The problem may be related to the fact that no special mask has been used to diffuse the pspray.
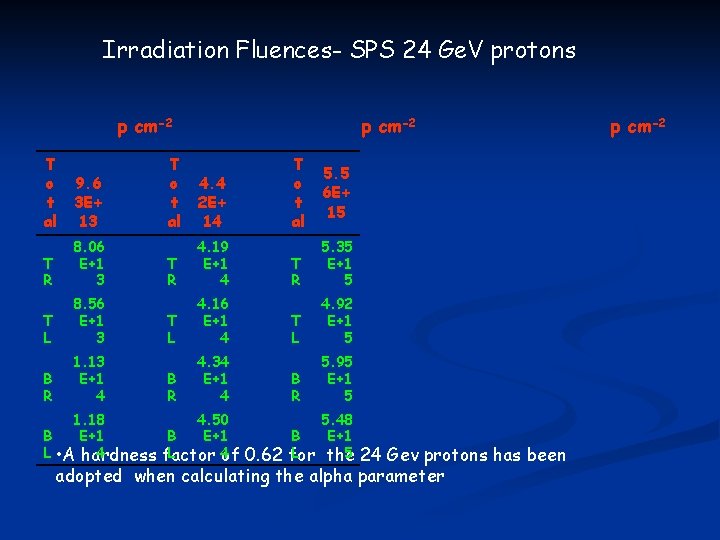
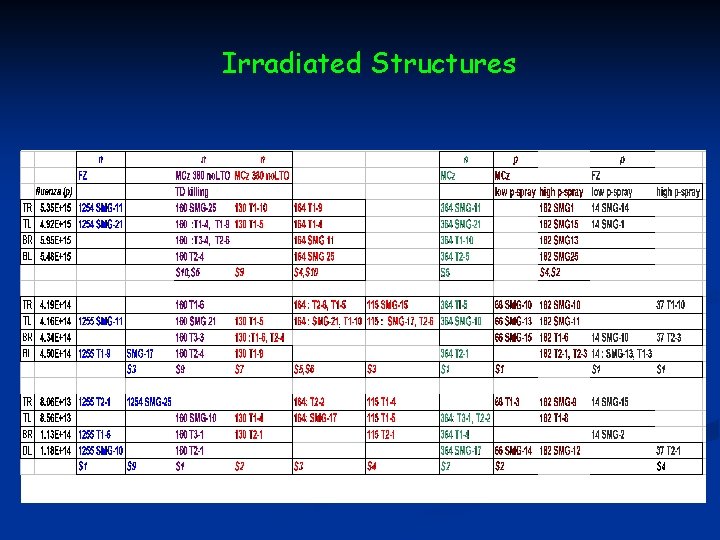
Irradiation Fluences- SPS 24 Ge. V protons p cm-2 T o t al 9. 6 3 E+ 13 T R 8. 06 E+1 3 T L 8. 56 E+1 3 B R 1. 13 E+1 4 p cm-2 T o t al 4. 4 2 E+ 14 T R 4. 19 E+1 4 T L 4. 16 E+1 4 B R 4. 34 E+1 4 1. 18 4. 50 B B E+1 L • A hardness 4 L 4 factor of T o t al 5. 5 6 E+ 15 T R 5. 35 E+1 5 T L 4. 92 E+1 5 B R 5. 95 E+1 5 B L for 5. 48 E+1 5 the 0. 62 24 Gev protons has been adopted when calculating the alpha parameter p cm-2
Irradiated Structures
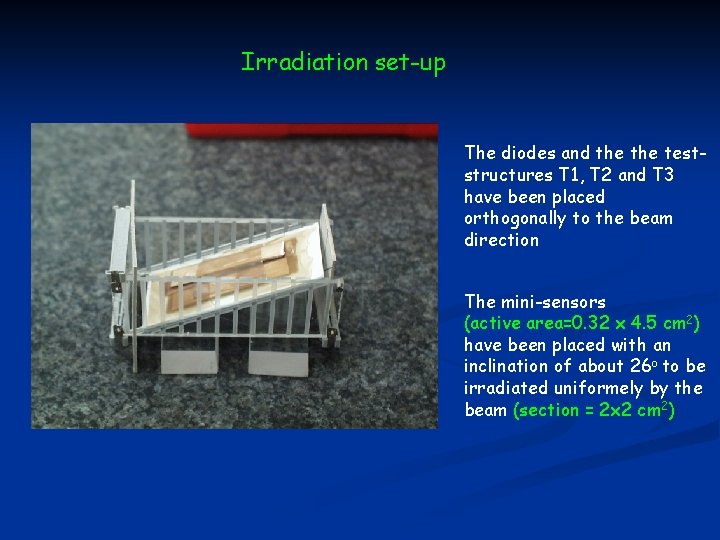
Irradiation set-up The diodes and the teststructures T 1, T 2 and T 3 have been placed orthogonally to the beam direction The mini-sensors (active area=0. 32 x 4. 5 cm 2) have been placed with an inclination of about 26 o to be irradiated uniformely by the beam (section = 2 x 2 cm 2)
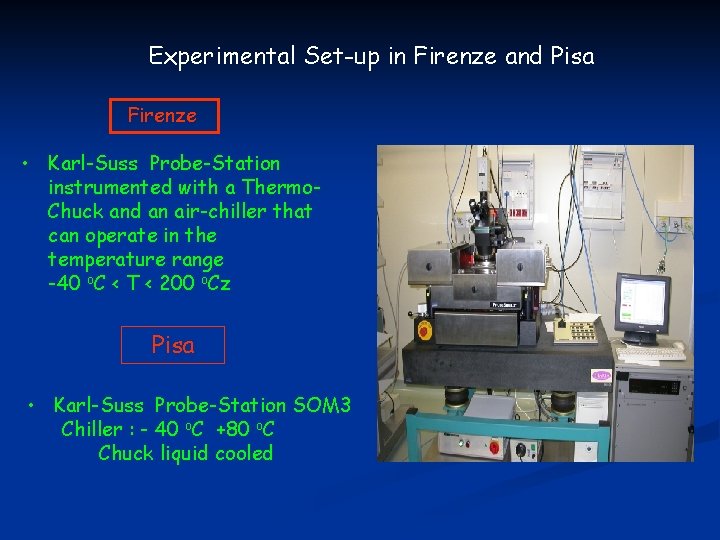
Experimental Set-up in Firenze and Pisa Firenze • Karl-Suss Probe-Station instrumented with a Thermo. Chuck and an air-chiller that can operate in the temperature range -40 o. C < T < 200 o. Cz Pisa • Karl-Suss Probe-Station SOM 3 Chiller : - 40 o. C +80 o. C Chuck liquid cooled
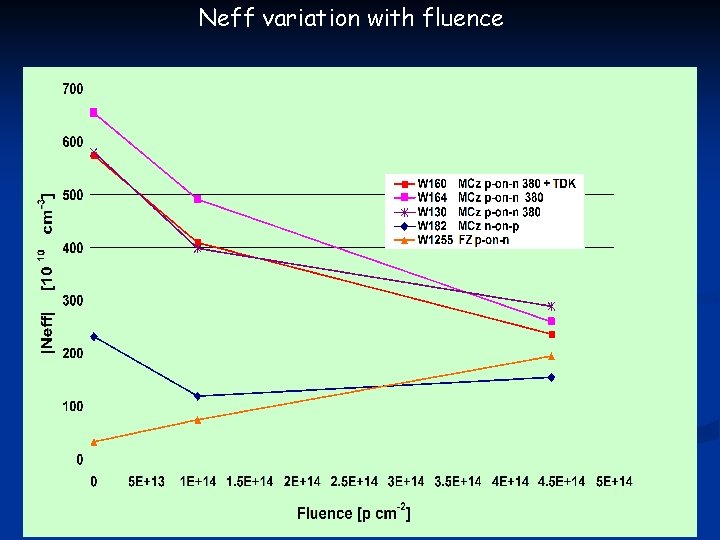
Measurement procedure v. The structures have been kept in the fridge (T< -10 o. C) whenever not in use v. A first measurement (IV and CV) has been performed before any annealing v Two annealing temperatures have been used for these structures: 60 o. C and 80 o. C v After each annealing step the following measurements have been performed: I-V curves at T=20 o. C or at 0 o. C CV curve at T=0 o. C and f=10 KHz v Alpha parameter calculated with currents at depletion voltage + 50 V, at T=20 o. C (or with currents at T=0 o. C normalized to T=20 o. C) , after 8 minutes at Tannealing=80 o. C or 80 minutes at Tannealing=60 o. C v Neff dependence on fluence calculated after full beneficial annealing
Measurements on the structures irradiated at a fluence of 1. 0 E+14 and 4. 4 E+14 p cm-2 es r l l A u re a s t l p ! y r a n i relim
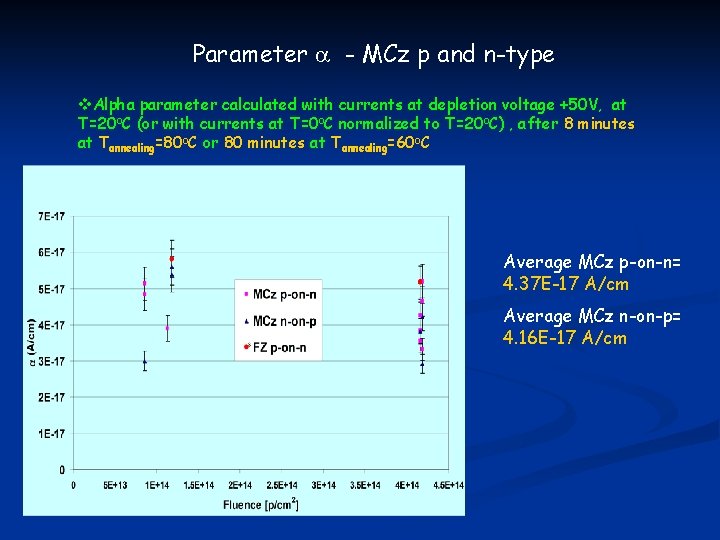
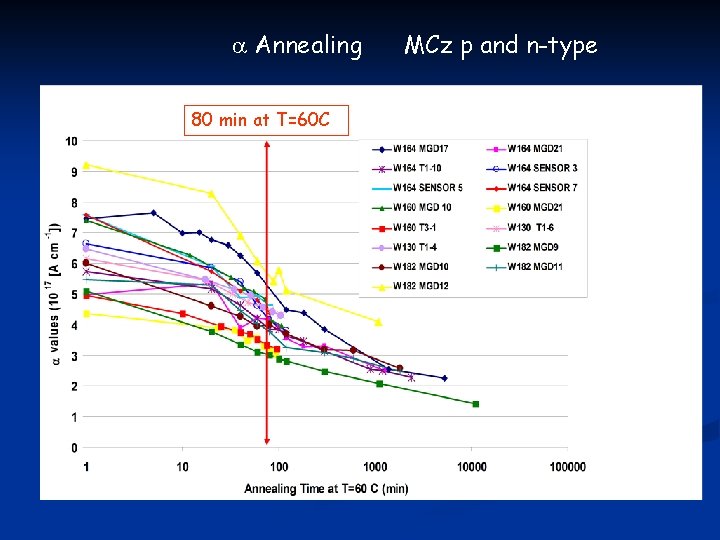
Parameter a - MCz p and n-type v. Alpha parameter calculated with currents at depletion voltage +50 V, at T=20 o. C (or with currents at T=0 o. C normalized to T=20 o. C) , after 8 minutes at Tannealing=80 o. C or 80 minutes at Tannealing=60 o. C Average MCz p-on-n= 4. 37 E-17 A/cm Average MCz n-on-p= 4. 16 E-17 A/cm
a Annealing 80 min at T=60 C MCz p and n-type
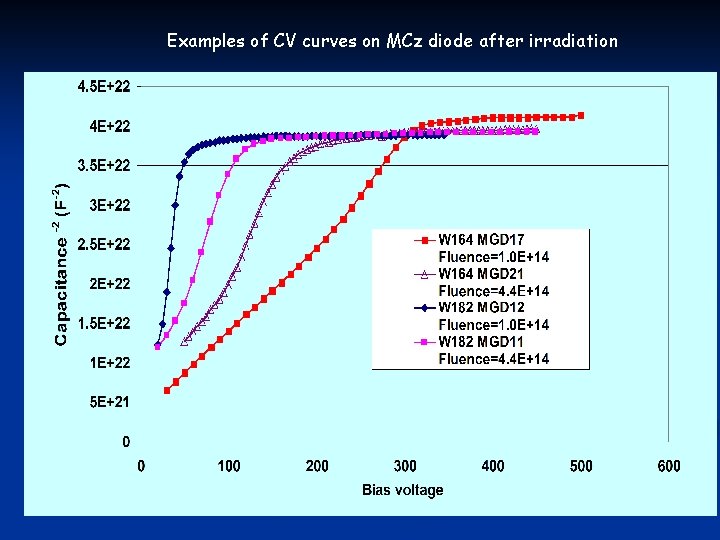
Examples of CV curves on MCz diode after irradiation
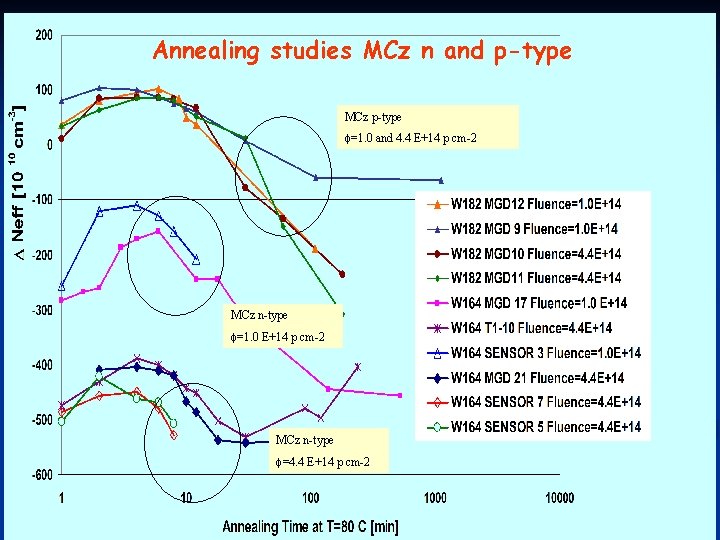
Annealing studies MCz n and p-type MCz p-type f=1. 0 and 4. 4 E+14 p cm-2 MCz n-type f=1. 0 E+14 p cm-2 MCz n-type f=4. 4 E+14 p cm-2
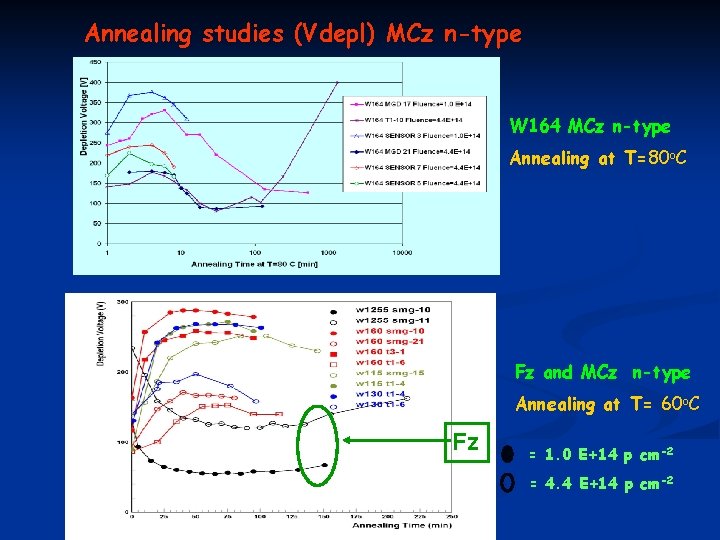
Annealing studies (Vdepl) MCz n-type W 164 MCz n-type Annealing at T=80 o. C Fz and MCz n-type Annealing at T= 60 o. C Fz = 1. 0 E+14 p cm-2 = 4. 4 E+14 p cm-2
Annealing studies (Vdepl) MCz and Fz p-type Fz Fz and MCz p-type Annealing at T= 60 o. C = 1. 0 E+14 p cm-2 = 4. 4 E+14 p cm-2 W 182 MCz p-type Annealing at T=80 o. C
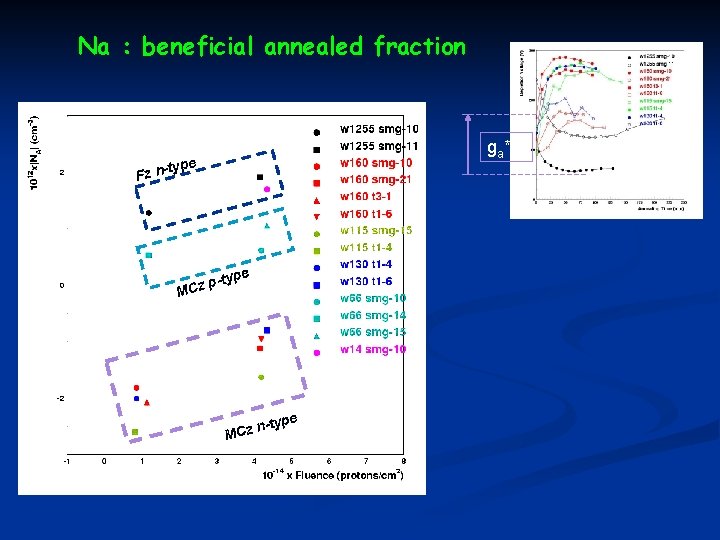
Na : beneficial annealed fraction ga*F type Fz n- e -typ p z MC -type n z MC
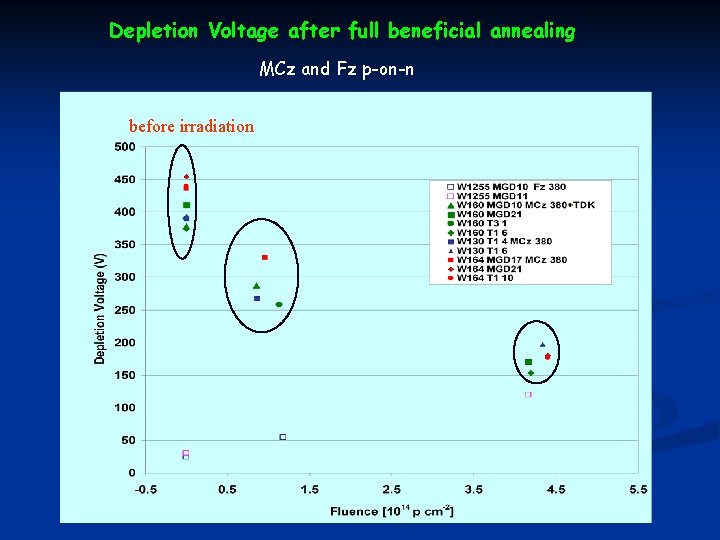
Depletion Voltage after full beneficial annealing MCz and Fz p-on-n before irradiation
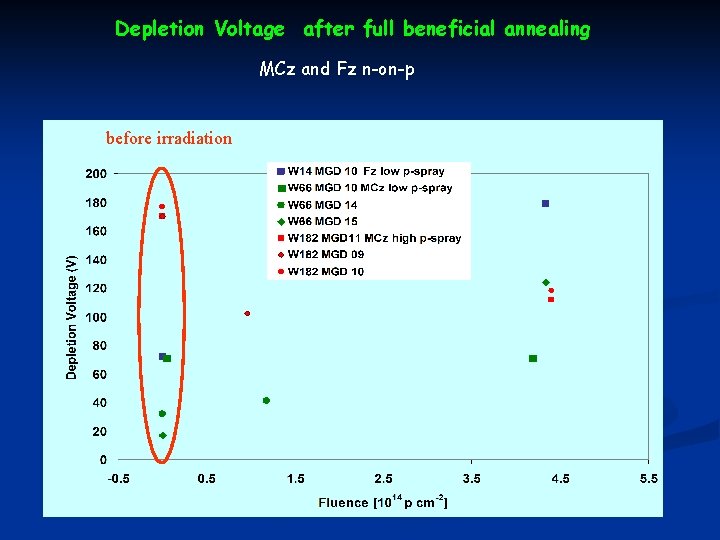
Depletion Voltage after full beneficial annealing MCz and Fz n-on-p before irradiation
Neff variation with fluence V depletion after 4 minutes at Tannealing=80 o. C or 40 minutes at o Tannealing=60 o. C
Studies on mini-sensors n n n Leakage current after irradiation as expected from the studies on the diodes of the same wafer Neff annealing follows behaviour observed on diodes Moderate increase of inter-strip capacitance after irradiation
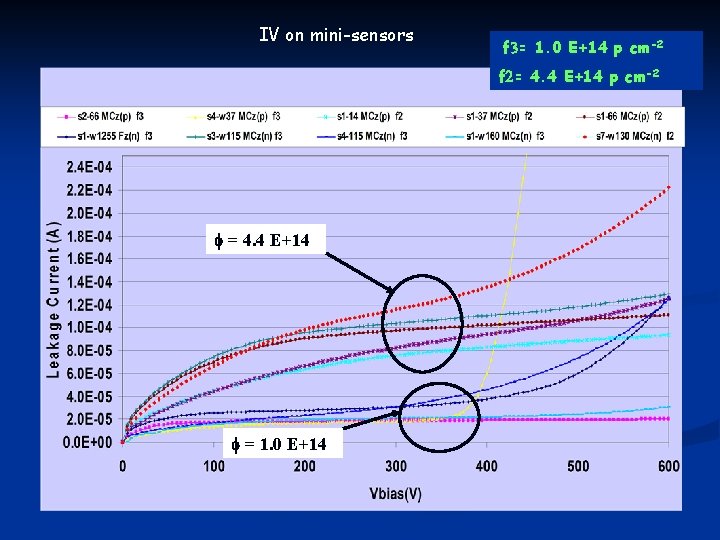
IV on mini-sensors f 3= 1. 0 E+14 p cm-2 f 2= 4. 4 E+14 p cm-2 f = 4. 4 E+14 f = 1. 0 E+14
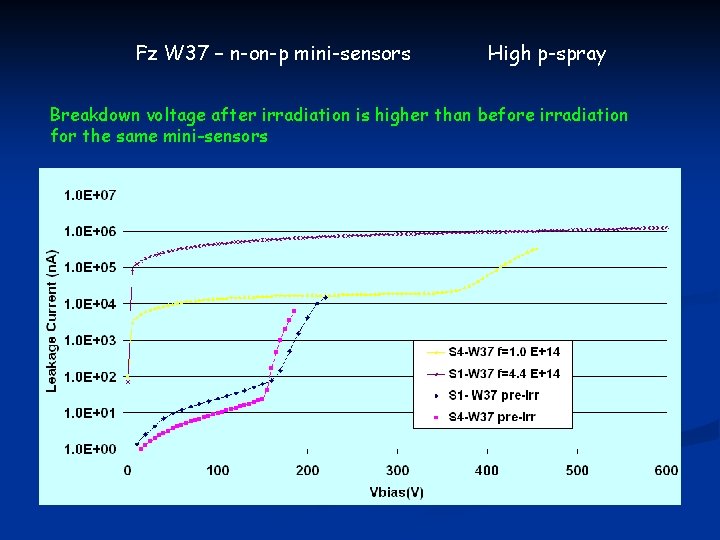
Fz W 37 – n-on-p mini-sensors High p-spray Breakdown voltage after irradiation is higher than before irradiation for the same mini-sensors
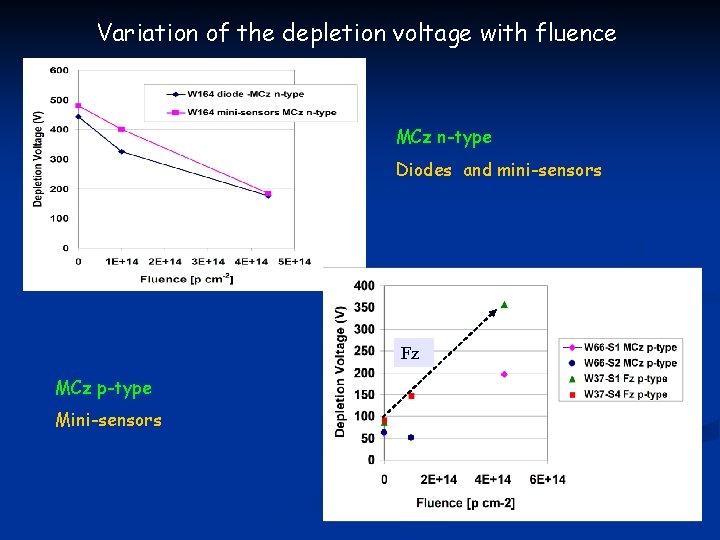
Variation of the depletion voltage with fluence MCz n-type Diodes and mini-sensors Fz MCz p-type Mini-sensors
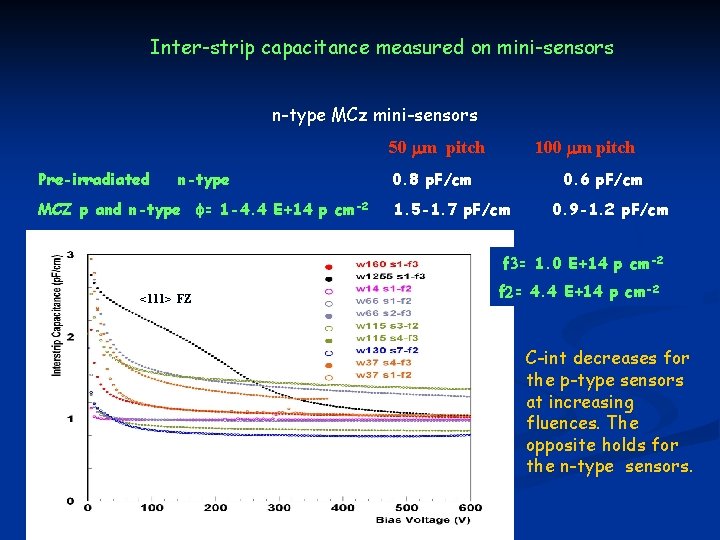
Inter-strip capacitance measured on mini-sensors n-type MCz mini-sensors 50 mm pitch Pre-irradiated n-type MCZ p and n-type f= 1 -4. 4 E+14 p cm-2 100 mm pitch 0. 8 p. F/cm 0. 6 p. F/cm 1. 5 -1. 7 p. F/cm 0. 9 -1. 2 p. F/cm f 3= 1. 0 E+14 p cm-2 <111> FZ f 2= 4. 4 E+14 p cm-2 C-int decreases for the p-type sensors at increasing fluences. The opposite holds for the n-type sensors.
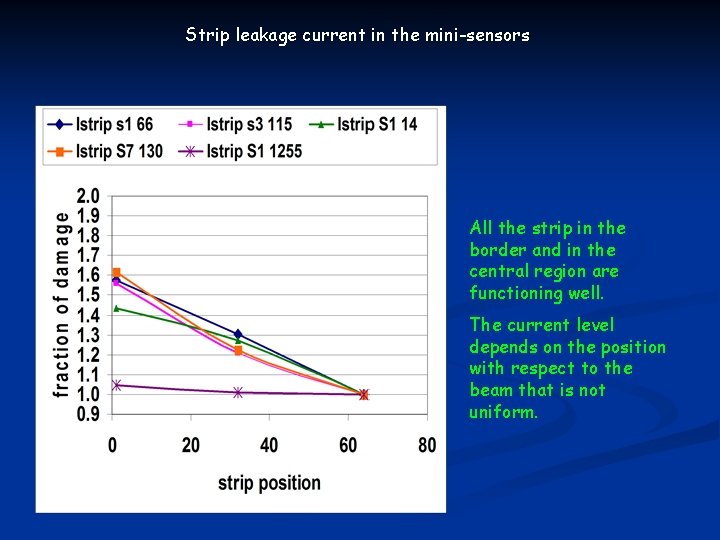
Strip leakage current in the mini-sensors All the strip in the border and in the central region are functioning well. The current level depends on the position with respect to the beam that is not uniform.
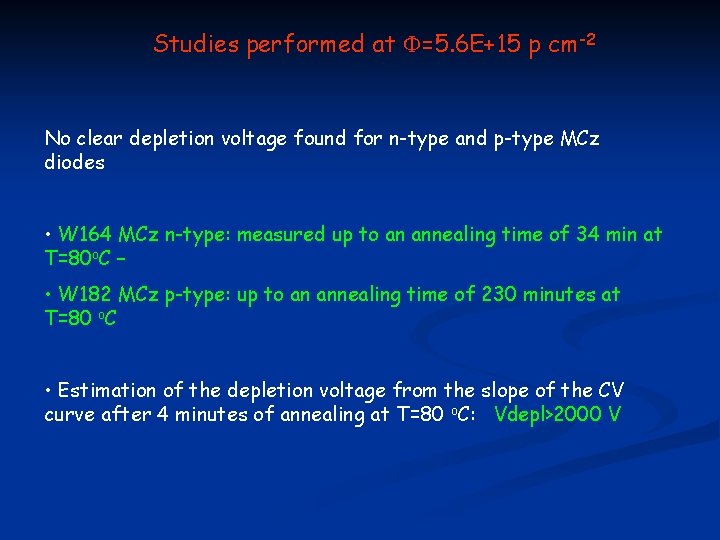
Studies performed at F=5. 6 E+15 p cm-2 No clear depletion voltage found for n-type and p-type MCz diodes • W 164 MCz n-type: measured up to an annealing time of 34 min at T=80 o. C – • W 182 MCz p-type: up to an annealing time of 230 minutes at T=80 o. C • Estimation of the depletion voltage from the slope of the CV curve after 4 minutes of annealing at T=80 o. C: Vdepl>2000 V
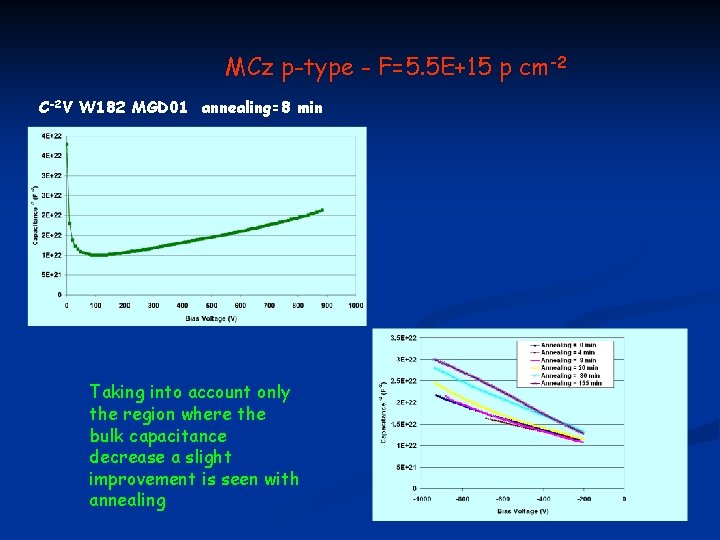
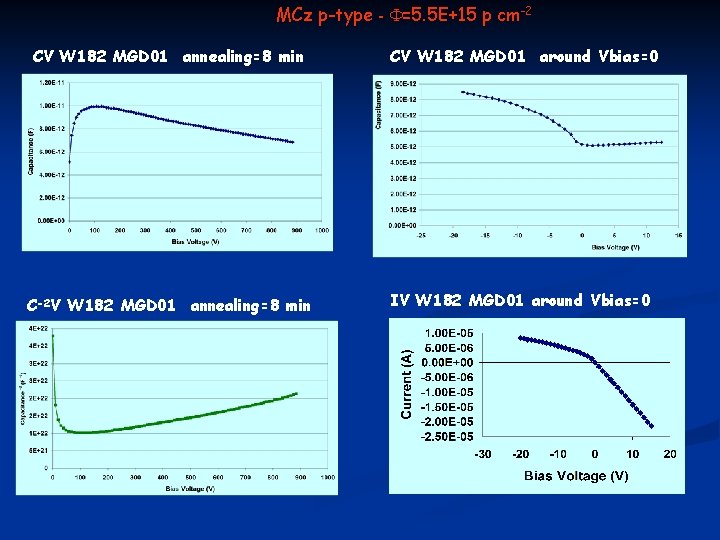
MCz p-type - F=5. 5 E+15 p cm-2 C-2 V W 182 MGD 01 annealing=8 min Taking into account only the region where the bulk capacitance decrease a slight improvement is seen with annealing
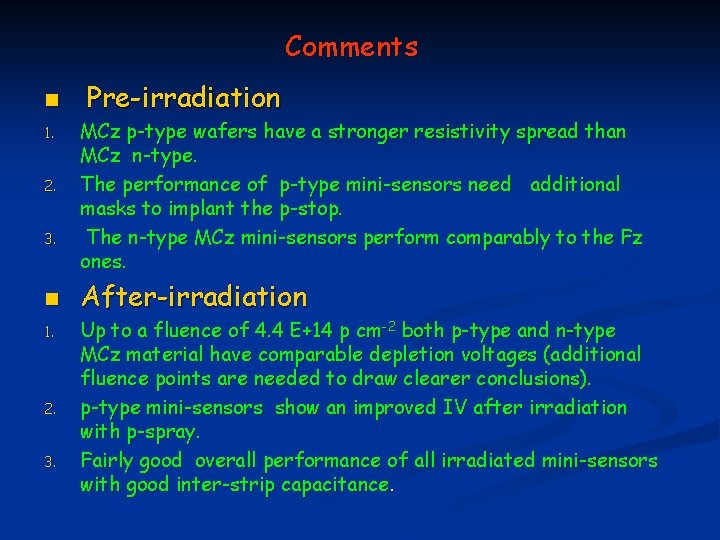
Comments n 1. 2. 3. n 1. 2. 3. Pre-irradiation MCz p-type wafers have a stronger resistivity spread than MCz n-type. The performance of p-type mini-sensors need additional masks to implant the p-stop. The n-type MCz mini-sensors perform comparably to the Fz ones. After-irradiation Up to a fluence of 4. 4 E+14 p cm-2 both p-type and n-type MCz material have comparable depletion voltages (additional fluence points are needed to draw clearer conclusions). p-type mini-sensors show an improved IV after irradiation with p-spray. Fairly good overall performance of all irradiated mini-sensors with good inter-strip capacitance.
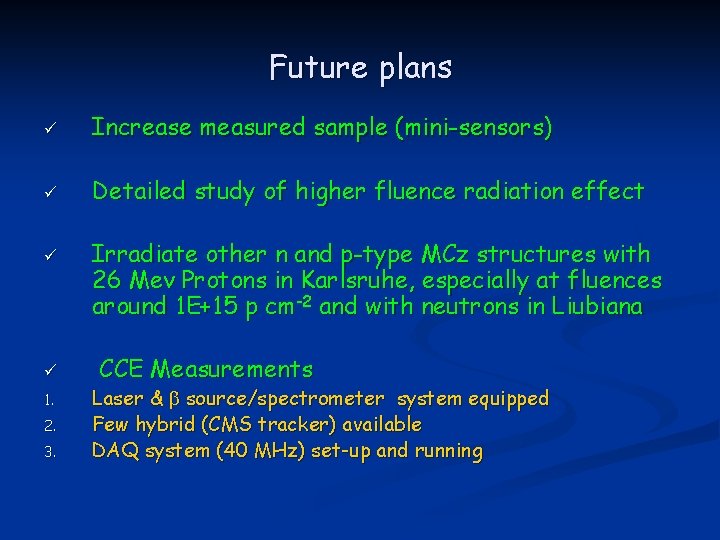
Future plans ü Increase measured sample (mini-sensors) ü Detailed study of higher fluence radiation effect ü ü 1. 2. 3. Irradiate other n and p-type MCz structures with 26 Mev Protons in Karlsruhe, especially at fluences around 1 E+15 p cm-2 and with neutrons in Liubiana CCE Measurements Laser & b source/spectrometer system equipped Few hybrid (CMS tracker) available DAQ system (40 MHz) set-up and running
Next slides are BACK-UP
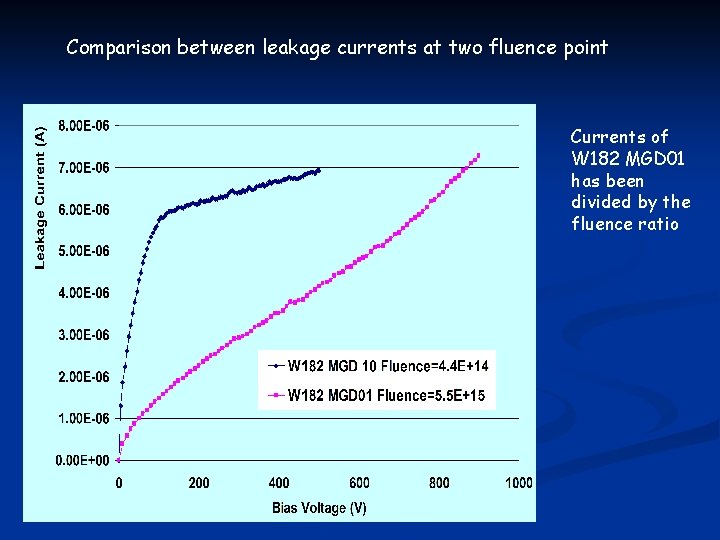
Comparison between leakage currents at two fluence point Currents of W 182 MGD 01 has been divided by the fluence ratio
MCz p-type - F=5. 5 E+15 p cm-2 CV W 182 MGD 01 annealing=8 min CV W 182 MGD 01 around Vbias=0 C-2 V W 182 MGD 01 annealing=8 min IV W 182 MGD 01 around Vbias=0
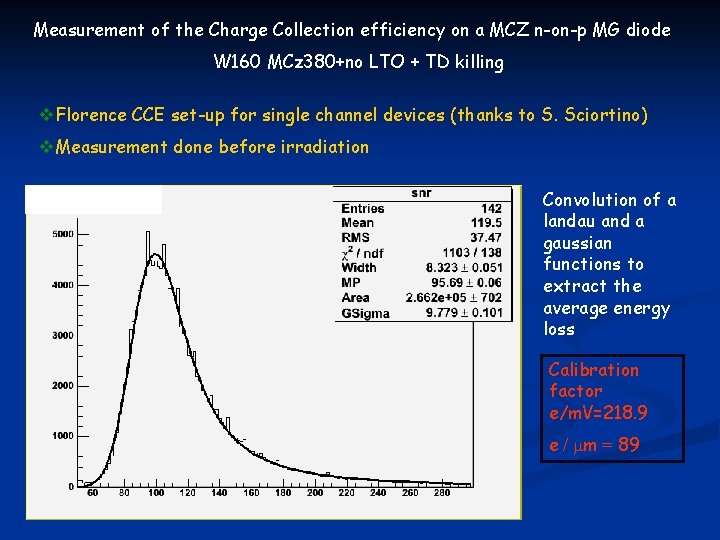
Measurement of the Charge Collection efficiency on a MCZ n-on-p MG diode W 160 MCz 380+no LTO + TD killing v. Florence CCE set-up for single channel devices (thanks to S. Sciortino) v. Measurement done before irradiation Convolution of a landau and a gaussian functions to extract the average energy loss Calibration factor e/m. V=218. 9 e / mm = 89
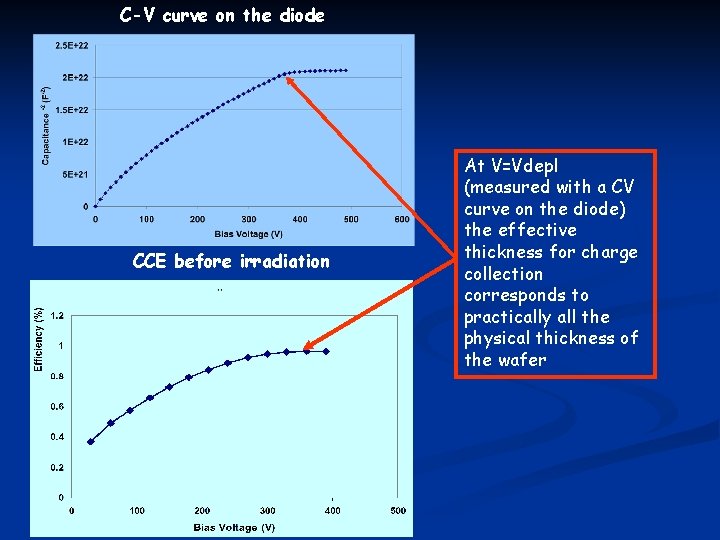
C-V curve on the diode CCE before irradiation At V=Vdepl (measured with a CV curve on the diode) the effective thickness for charge collection corresponds to practically all the physical thickness of the wafer
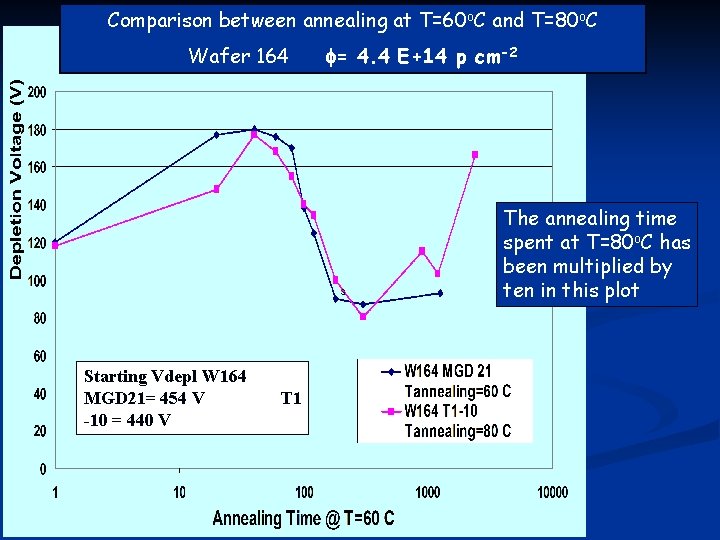
Comparison between annealing at T=60 o. C and T=80 o. C Wafer 164 f= 4. 4 E+14 p cm-2 The annealing time spent at T=80 o. C has been multiplied by ten in this plot Starting Vdepl W 164 MGD 21= 454 V -10 = 440 V T 1
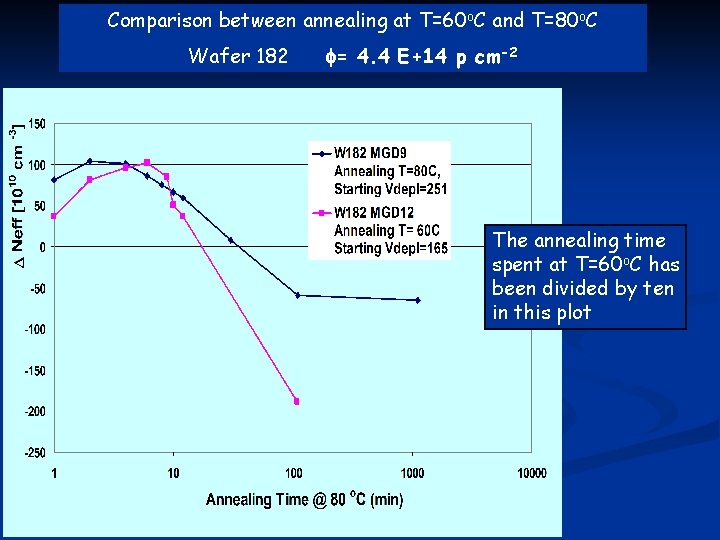
Comparison between annealing at T=60 o. C and T=80 o. C Wafer 182 f= 4. 4 E+14 p cm-2 The annealing time spent at T=60 o. C has been divided by ten in this plot
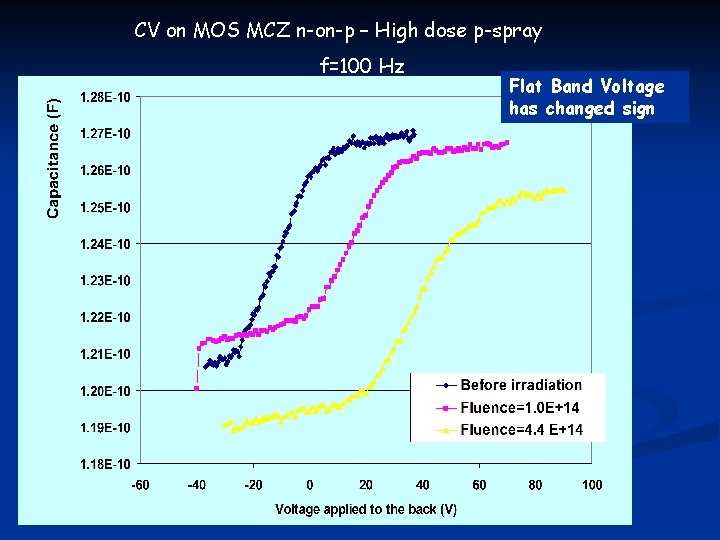
CV on MOS MCZ n-on-p – High dose p-spray f=100 Hz Flat Band Voltage has changed sign