STOR 455 STATISTICAL METHODS I Jan Hannig 82410




- Slides: 22
STOR 455 STATISTICAL METHODS I Jan Hannig 8/24/10 STOR 455 Lecture 1
Registration Issues • Contact Charlotte Rogers at Hanes 321. • Fill out some paperwork with her to be put on the waiting list. 8/24/10 STOR 455 Lecture 1
Syllabus • www. unc. edu/~hannig/STOR 455 • Book – downloadable from the web • SAS is an important part – Free for students – No Mac Version – Possible to use “emerald” – I will show you when the time comes 8/24/10 STOR 455 Lecture 1
Jan Hannig 335 Hanes Building jan. hannig@unc. edu (919) 962 -7511 Personal webpage http: //www. unc. edu/~hannig • Office hours • • – Tuesday 3: 30 -4: 30 pm (after class) – Wednesday 10: 30 -11: 30 am 8/24/10 STOR 455 Lecture 1
Where am I from? 8/24/10 STOR 455 Lecture 1
Czech Republic 8/24/10 STOR 455 Lecture 1
Prague 8/24/10 STOR 455 Lecture 1
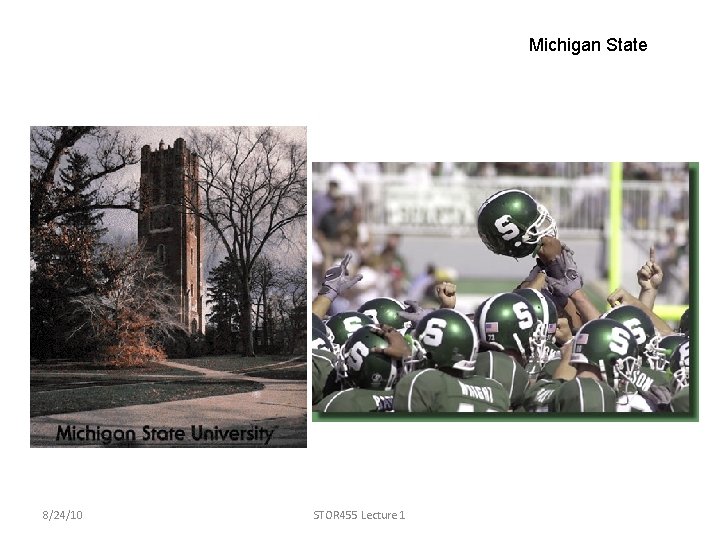
Michigan State 8/24/10 STOR 455 Lecture 1
Colorado State 8/24/10 STOR 455 Lecture 1
Interests • • Skiing Mountain biking My church (Greenleaf Vineyard) Of course –Research –Teaching 8/24/10 STOR 455 Lecture 1
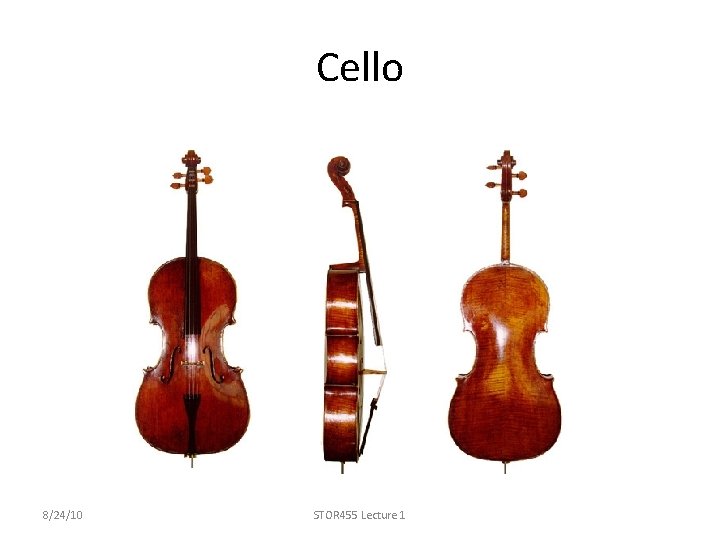
Cello 8/24/10 STOR 455 Lecture 1
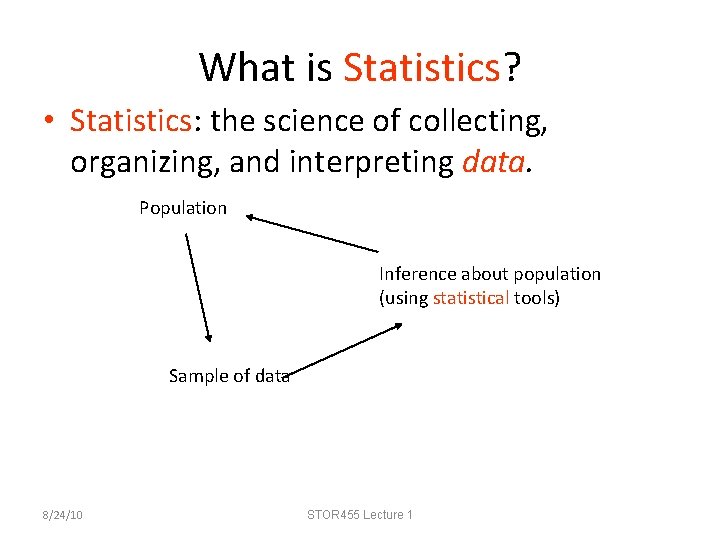
What is Statistics? • Statistics: the science of collecting, organizing, and interpreting data. Population Inference about population (using statistical tools) Sample of data 8/24/10 STOR 455 Lecture 1
Popular stats 8/24/10 STOR 455 Lecture 1
Quick review • Stats – Population/sample – Point Estimation – Confidence Intervals – Hypothesis Tests – Gaussian (Normal) Distribution • Math – Functions – Elementary matrix arithmetic 8/24/10 STOR 455 Lecture 1
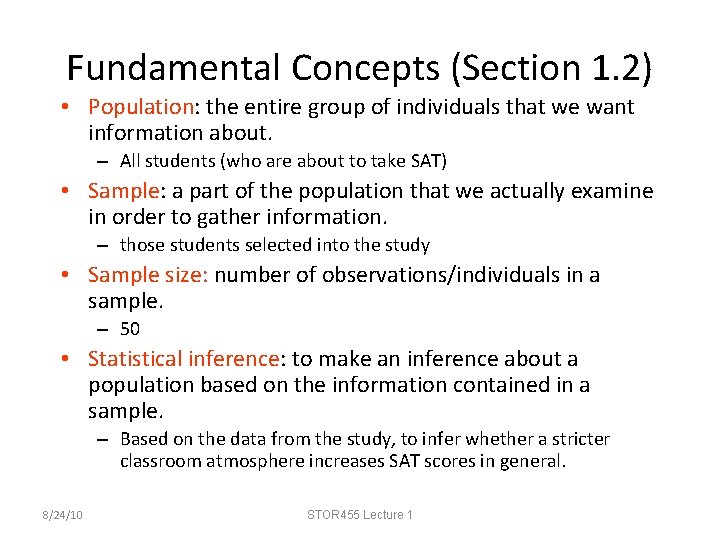
Fundamental Concepts (Section 1. 2) • Population: the entire group of individuals that we want information about. – All students (who are about to take SAT) • Sample: a part of the population that we actually examine in order to gather information. – those students selected into the study • Sample size: number of observations/individuals in a sample. – 50 • Statistical inference: to make an inference about a population based on the information contained in a sample. – Based on the data from the study, to infer whether a stricter classroom atmosphere increases SAT scores in general. 8/24/10 STOR 455 Lecture 1
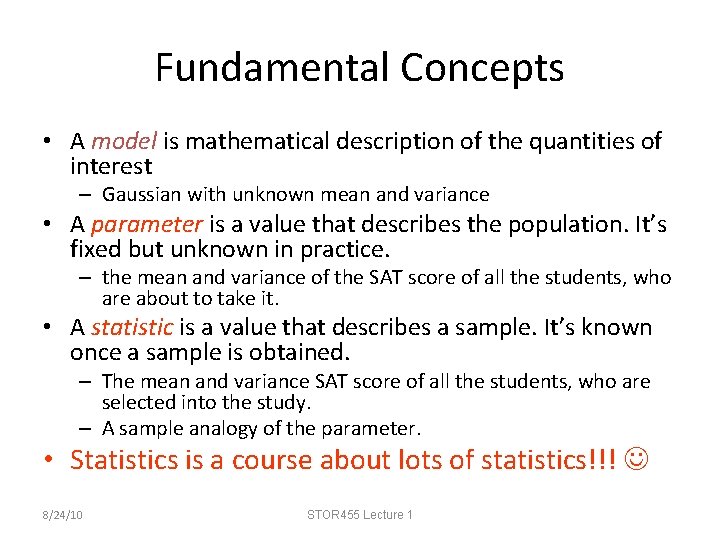
Fundamental Concepts • A model is mathematical description of the quantities of interest – Gaussian with unknown mean and variance • A parameter is a value that describes the population. It’s fixed but unknown in practice. – the mean and variance of the SAT score of all the students, who are about to take it. • A statistic is a value that describes a sample. It’s known once a sample is obtained. – The mean and variance SAT score of all the students, who are selected into the study. – A sample analogy of the parameter. • Statistics is a course about lots of statistics!!! 8/24/10 STOR 455 Lecture 1
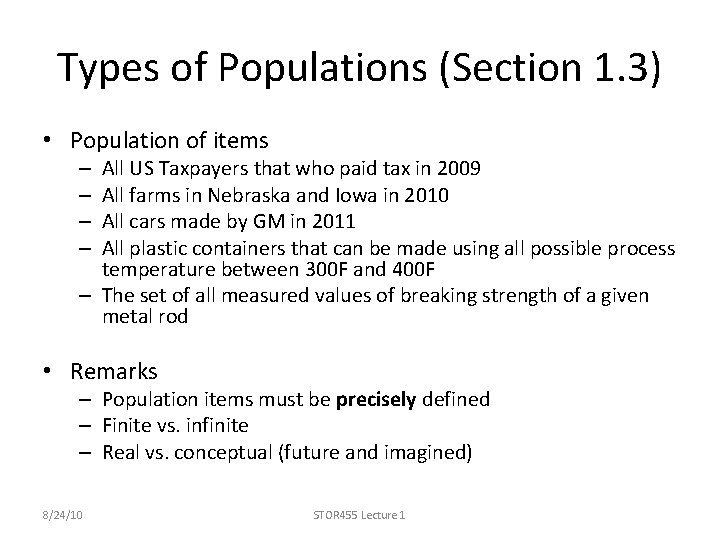
Types of Populations (Section 1. 3) • Population of items All US Taxpayers that who paid tax in 2009 All farms in Nebraska and Iowa in 2010 All cars made by GM in 2011 All plastic containers that can be made using all possible process temperature between 300 F and 400 F – The set of all measured values of breaking strength of a given metal rod – – • Remarks – Population items must be precisely defined – Finite vs. infinite – Real vs. conceptual (future and imagined) 8/24/10 STOR 455 Lecture 1
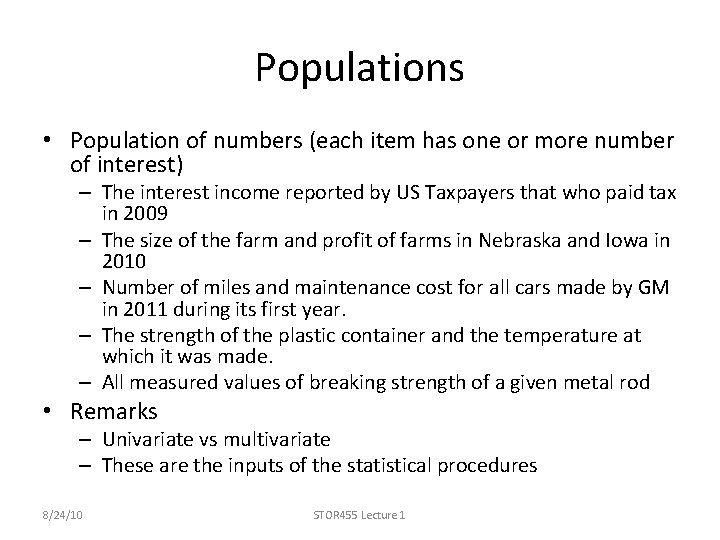
Populations • Population of numbers (each item has one or more number of interest) – The interest income reported by US Taxpayers that who paid tax in 2009 – The size of the farm and profit of farms in Nebraska and Iowa in 2010 – Number of miles and maintenance cost for all cars made by GM in 2011 during its first year. – The strength of the plastic container and the temperature at which it was made. – All measured values of breaking strength of a given metal rod • Remarks – Univariate vs multivariate – These are the inputs of the statistical procedures 8/24/10 STOR 455 Lecture 1
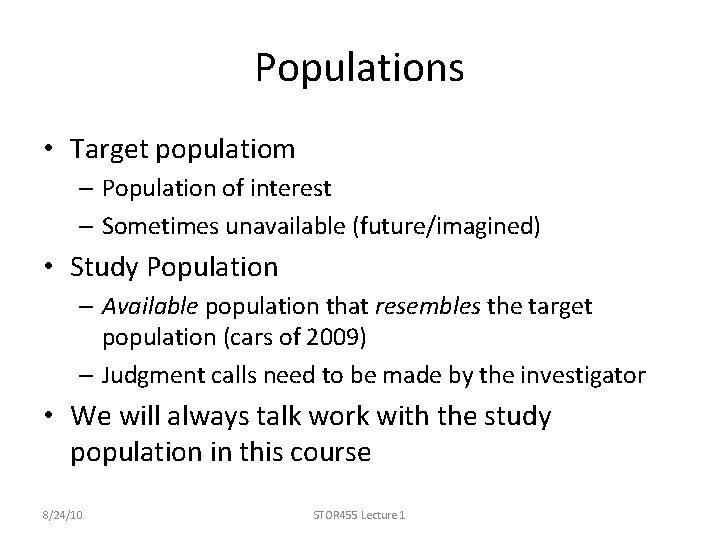
Populations • Target populatiom – Population of interest – Sometimes unavailable (future/imagined) • Study Population – Available population that resembles the target population (cars of 2009) – Judgment calls need to be made by the investigator • We will always talk work with the study population in this course 8/24/10 STOR 455 Lecture 1
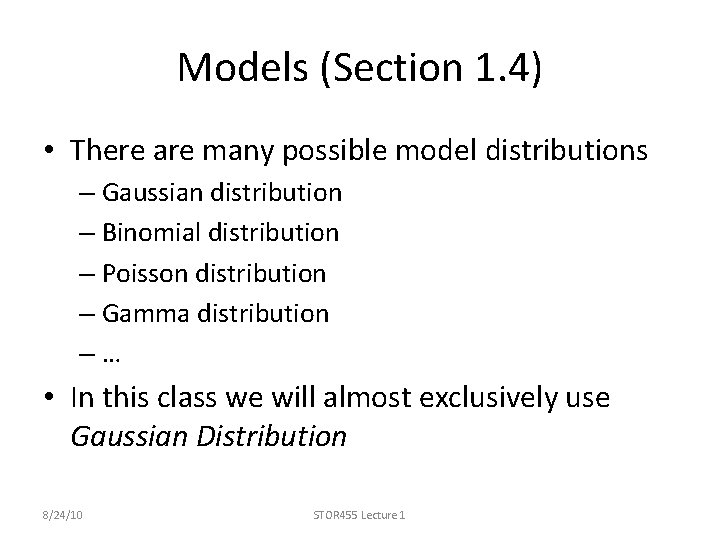
Models (Section 1. 4) • There are many possible model distributions – Gaussian distribution – Binomial distribution – Poisson distribution – Gamma distribution –… • In this class we will almost exclusively use Gaussian Distribution 8/24/10 STOR 455 Lecture 1
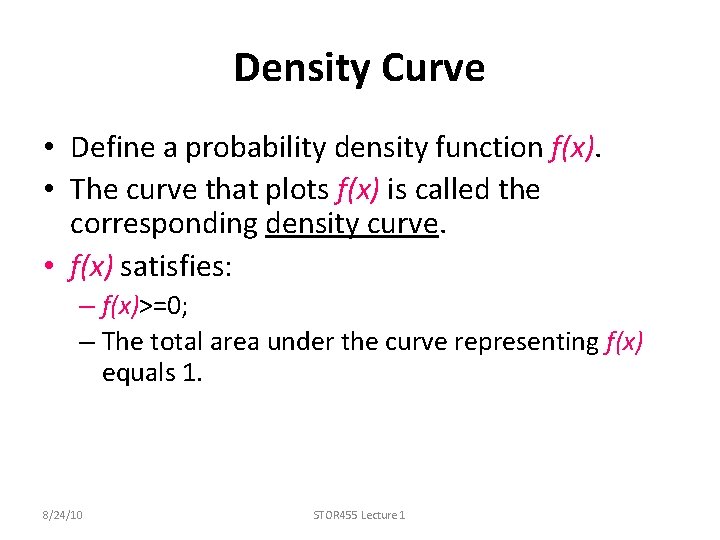
Density Curve • Define a probability density function f(x). • The curve that plots f(x) is called the corresponding density curve. • f(x) satisfies: – f(x)>=0; – The total area under the curve representing f(x) equals 1. 8/24/10 STOR 455 Lecture 1
Density Curves • Describe the overall shape of distributions • Idealized mathematical models for distributions • Show patterns that are accurate enough for practical purposes • Always on or above the horizontal axis • The total area under the curve is exactly 1 • Areas under the curve represent relative frequencies of observations 8/24/10 STOR 455 Lecture 1