DEMAND ANALYSIS Dr K Kannan M A MIS


- Slides: 56
DEMAND ANALYSIS -Dr. K. Kannan. , M. A. , MIS. , M. Phil. , Ph. D. , DCA. , Assistant Professor in Economics, Department of Commerce with Professional Accounting and Accounting &Finance, Hindusthan College of Arts and Science, ( Autonomous) Hindusthan Gardens, (Behind Nava India) Avanashi Road, Coimbatore - 641 028 Tamil Nadu, India. Cell: 09578779766 &09597721524
DEMAND ANALYSIS • Meaning of demand • Law of demand • Determinants of demand • Changes in demand • Elasticity of demand • Types of elasticity of demand • Demand forecasting • Objectives of demand forecasting • Methods of demand forecasting
DEMAND Demand for any commodity mainly depends upon the ability to pay and willingness to buy a commodity or depends upon the purchasing power of the consumer. A want with three attributes - desire to buy, willingness to pay and ability to pay - becomes effective demand.
PRICE OF COMMODITY DISTRIBUTION OF WEALTH TASTE & PREFERENCES PRICE OF RELATED GOODS DETERMINANTS OF DEMAND POPULATION GROWTH INCOME EXPECTATIONS GOVERNMENT POLICIES
Price of the commodity majorly plays an important role in determining the demand. Followed by price of related goods , income , distribution of wealth , tastes and preferences , government policies, population growth are also acting as determinants of demand.
LAW OF DEMAND The law of demand states that the demand for a commodity increases when its price decreases and it falls when its price rises, other things remaining constant.
ASSUMPTIONS : ØIncome level remains constant. ØThe taste of the buyer remains constant. ØThe price of other goods remains constant. ØNo new substitutes for a commodity. ØFuture price rise not expected.
DEMAND SCHEDULE PRICE OF GOOD QUANTITY DEMANDED 1 30 2 20 3 10
DEMAND DIAGRAM
DIAGRAM EXPLANATION: Origin to x-axis denotes the quantity demanded for a commodity. Origin to y-axis denotes the price of the commodity. DD is the demand curve. When the price of the commodity is at a high level , the quantity demanded will be at a low level as explained in the above diagram.
INDIVIDUAL DEMAND FOR A COMMODITY The theory of consumer’s equilibrium provides a convenient basis for the derivation of individual demand curve for a commodity. Marshall was the first economist to explicitly derive the demand curve from consumer’s utility function. Marshall gave the equilibrium condition for the consumption of a commodity, say X, as MUx = P 2 (MUm).
MARKET DEMAND FOR A COMMODITY
Market demand is the combination of every individual demand for a commodity. In the first diagram , the curve resembles the demand of consumer 1. The second diagram represents the demand on a commodity in the view of consumer 2. The last diagram is the combined form of both the consumers , which is known as market demand curve.
DEMAND CURVE SLOPES DOWNWARDS
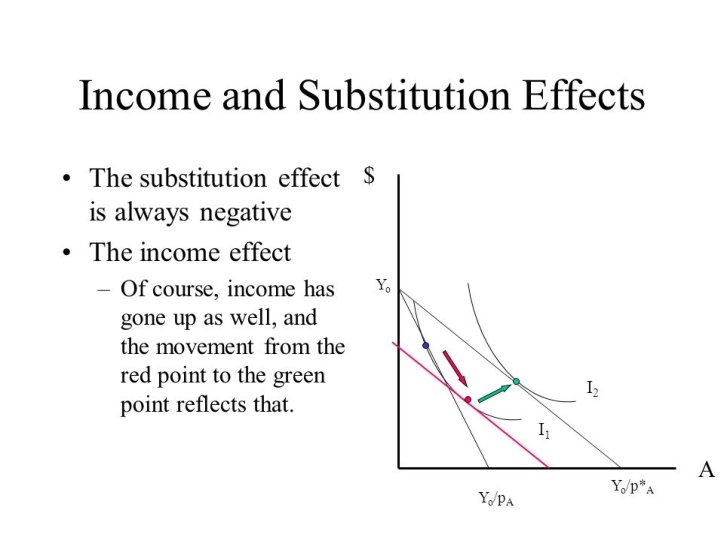
Why does demand curve slopes downwards ? • Law of diminishing marginal utility • Substitution and income effect • New consumers creating demand • Psychological effect
LAW OF DIMINISHING MARGINAL UTILITY Law of Diminishing Marginal Utility is an important law of utility analysis. This law is related to the satisfaction of human wants. All of us experience this law in our daily life. According to Marshall, “The additional benefit which a person derives from a given stock of a thing diminishes with every increase in the stock that he already has. ”
It is clear from the diagram that when the consumer consumes first unit of orange, he get marginal utility equal to 8.
Marginal utility from the consumption of second, third and fourth orange is 6, 4 and 2 respectively. He gets zero marginal utility from the consumption of fifth orange. This is known as point of satiety for the consumer. After that he gets negative utility i. e. -2 from the consumption of sixth unit of oranges. Thus, the table shows that as the consumer goes on consuming more and more units of oranges, marginal utility goes on diminishing.
Some other causes for demand curve downward sloping: • New consumers creating demand • Several users • Psychological effect
• GIFFEN PARADOX A Giffen good may be any inferior commodity much cheaper than its superior substitutes, consumed by the poor households as an essential commodity. If price of such goods increases (price of its substitute remaining constant), its demand increases instead of decreasing because, in case of a Giffen good, income effect of a price rise is greater than its, substitution effect. The reason is, when price of, an inferior good increases, income remaining the same, poor people cut the consumption of the superior substitute so that they may buy more of the inferior good in order to meet their basic needs.
• VEBLEN EFFECT: The law does not apply to the commodities which are used as a status symbol’ of enhancing social prestige or for displaying wealth and riches, e. g. , gold, ’ precious stones, rare paintings, antiques, etc. Rich people buy such goods mainly because their prices are high and buy more of them when their prices move up. • EXPECTATIONS REGARDING FURTHER PRICES: When consumers expect a continuous increase in the price of a durable commodity, they buy more of it despite increase in its price with a view to avoiding the pinch of a much higher price in future.
ELASTICITY OF DEMAND The term elasticity is used to denote a measure of the rate at which demand changes in response to changes in prices. The responsiveness of demand to change in prices or other factors to buy a commodity. Elasticity depends upon • desire to buy a commodity • substitutes available for the commodity • other factors
TYPES OF ELASTICITY OF DEMAND • Price elasticity of demand • Income elasticity of demand • Cross-elasticity of demand
PRICE ELASTICITY OF DEMAND Price elasticity of demand is the responsiveness of quantity demanded for a commodity , to a change in its price. Ep=% Q % P
TYPES OF PRICE ELASTICITY OF DEMAND • • • Perfectly elastic demand Perfectly inelastic demand Unitary elastic demand Relatively inelastic demand Relatively elastic demand
PERFECTLY ELASTIC DEMAND No change in price but increase in quantity demanded.
PERFECTLY INELASTIC DEMAND Increase in price occurs but no change in quantity demanded.
UNITARY ELASTIC DEMAND Changes in price and quantity demanded are vice versa. Hence e = 1
RELATIVELY ELASTIC DEMAND A small change in price but a large change in quantity demanded.
RELATIVELY INELASTIC DEMAND A large change in price but no correspondence change in quantity demanded.
INCOME ELASTICITY OF DEMAND The relationship between quantity demanded income is of positive nature, unlike the negative price-demand relationship. The demand for goods and services increases with increase in consumer’s income and vice-versa. The responsiveness of demand to the change in income is known as income elasticity of demand.
Y The demand for complementary goods has negative cross-elasticity. e>1 price CROSS ELASTICITY OF DEMAND e=infinite e=1 e<1 0 e=0 X Quantity demanded
DEMAND FORECASTING
DEMAND FORECASTING Demand forecasting is predicting future demand for a product. The information regarding future demand is essential for planning and scheduling production, purchase of raw materials, acquisition of finance and advertising. It is much more important where a large-scale production is being planned and production involves a long gestation period. The information regarding future demand is essential also for the existing firms for avoiding under or over-production.
CRITERIA FOR GOOD FORECASTING METHOD • Accuracy : The accuracy of the data both past and present is very much important for future forecasting. • Simplicity : The methods should be simple, easily understandable , technic for the management.
• Economy – cost effective: The cost must be weighted against the importance of forecasting. the cost spent should be cost effective. • Availability: The method used should be able to produce meaningful results quickly. • Maintenance of time lines: The forecast should be capable of maintaining up-todate data which helps the future prediction accurately.
“Demand forecast is an estimate of sales in monetary or physical units for a specified future period under a proposed business plan or program or under an assumed set of economic and other environmental forces, planning premises outside the business organisation for which the forecast or estimate is made. ” • SHORT TERM OBJECTIVE: ü Formulation of production policy ü Price policy ü Fixed sales target ü short term financial plans ü regular availability of labour
• LONG TERM OBJECTIVES : Ø financial planning Ø man power planning Ø to decide about expansion Ø technology
METHODS OF DEMAND FORECASTING • Survey method • Statistical method
SURVEY METHOD It is a direct method of collection of data to estimate the demand in short run. The consumers and the experts are the sources of data in this method. The short term forecasting depends on survive method.
TYPES OF SURVEY METHOD • Customer intention • Expert opinion • Delpi method • Collective opinion method
CUSTOMER INTENTION
The most direct and simple way of assessing future demand for a product is to interview the potential consumers or users and to ask them what quantity of the product they would be willing to buy at different prices over a given period say, one year. This method is known as direct interview method. This method may, cover almost all the potential consumers or only selected groups of consumers from different cities or parts of the area of consumer concentration.
EXPERT OPINION The process brings together in an organised manner, personal judgments about the process being analysed Main reliance is on human judgments. In this method, the executive uses his own anticipation and what he hears from others. Outside experts are also consulted and the other executive heads are also required to give their opinion in the matter. Salesmen are to provide information about customer’s attitude and preferences and the activities of competitors.
DELPHI METHOD • Delphi method of demand forecasting is an extension of the simple expert opinion poll method. This method is used to consolidate the divergent expert opinions and to arrive at a compromise estimate of future demand. The Process is simple. • Under Delphi method, the experts are provided information on estimates of forecasts of other experts along with the underlying assumptions. The experts may revise estimates in the light of forecasts made by other experts. The consensus of experts about the forecasts constitutes the finalforecast.
COLLECTIVE OPINION METHOD An alternative method of collecting necessary information regarding demand is to carry out market studies and experiments in consumer’s behaviour under actual, though controlled, market conditions. This method is known in common parlance as market experiment method. Under this method, firms first select some areas of the representative markets - three or four cities having similar features, viz. , population, income levels, cultural and social background, occupational distribution, choices and preferences of consumers. Then, they carry out market experiments by changing prices, advertisement expenditure, and other controllable variables in the demand function under the assumption that other things remain the same.
STATISTICAL METHODS This method use the past data as a guide to predict the future demand. It involves statistical or mathematical techniques to forecasting. This method is mostly used for long run forecasting. These are based on the assumption that future patterns tend to be extensions of past ones and that one can make useful predictions by studying the past behaviour i. e. the factors which were responsible in the past will also be operative to the same extent in future.
• • TYPES OF STATISTICAL METHODS Trend projection Time series Barrow metric method Correlation and regression Naive model Control experiments Use of economic indicator
TREND PROJECTION The past pattern of sales at different time periods is used and project the future demand for a product. The trend projection is represented graphically which will be more accurate for further analysis. This is algebra related between the sales and time. THE TREND PROJECTION IS ESTIMATED BY FOUR METHODS: • Least square method • Moving average method • Free hand method • Semi - average method
TIME SERIES The time series refers to the date over a period of time. The past data is used for this analysis. It is mainly used to estimated the sales at different time periods. These are four types of time series: • Secular trend • Seasonal variations • Cyclic variations • Random variations
BARROW METRIC METHODS It is an important over trend projection method. This method is capable of analysing complex turning points in forecasting the demand. There are three types of barrow metric method: • Leading series • Lagging series • Co-incident series
CORRELATION AND REGRESSION This method discover the nature and extent of relationship between the variables by means of statistical and econometric techniques. It analyses about relationship between sales and other variables. Example: Employment, national income, population and education.
NAVIE MODELS: Based on the historical observation of sales the future demand is forecasted. This method is less expensive. CONTROL EXPERIMENTS : The forecasting is done with selected determinants of demand assuming others remain the same. It is an experience method and risky too. USE OF ECONOMIC INDICATOR : By using the economic indicator like personal income, agricultural income, automobile registrations, etc. This method will not be useful for new products.
Thank you